
Bovine Lactoferrin Market Size 2025-2029
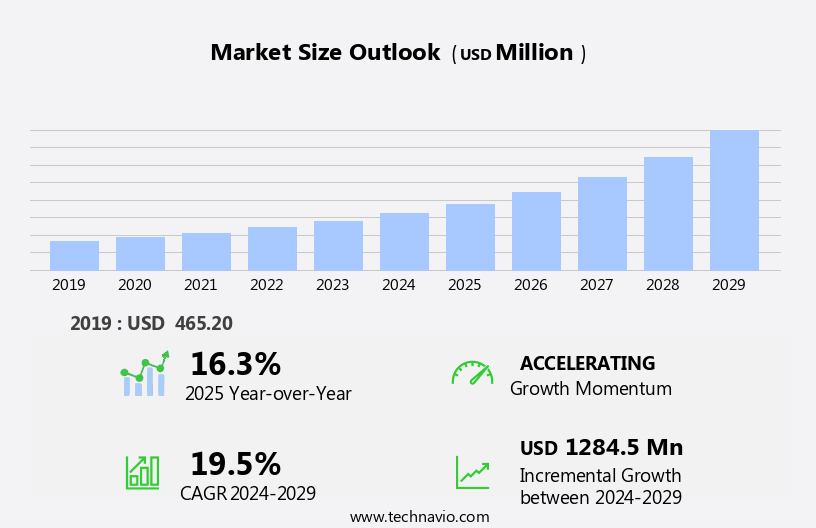
The bovine lactoferrin market size is forecast to increase by USD 1.28 billion, at a CAGR of 19.5% between 2024 and 2029.
- The market is experiencing significant growth, driven by the increasing number of working women and nuclear families. This demographic shift has led to heightened demand for functional food and beverage products that offer health and wellness benefits, making bovine lactoferrin an attractive ingredient due to its immune-boosting properties. Furthermore, the expansion of bovine lactoferrin production facilities is expected to increase supply, potentially leading to price reductions and broader market penetration. However, the market faces challenges, including the decline in global birth rates, which could impact the demand for bovine milk and, consequently, lactoferrin production. To capitalize on market opportunities, companies should focus on developing innovative applications for bovine lactoferrin, catering to the nutritional needs of modern consumers.
- Additionally, addressing the challenge of declining birth rates by exploring alternative sources of demand or diversifying into related markets could provide a strategic advantage. Overall, the market presents a dynamic and promising landscape for companies seeking to innovate and navigate challenges effectively.
What will be the Size of the Bovine Lactoferrin Market during the forecast period?
Explore in-depth regional segment analysis with market size data - historical 2019-2023 and forecasts 2025-2029 - in the full report.
Request Free Sample
The market continues to evolve, driven by its diverse applications across various sectors. In food additives, lactoferrin's role in enhancing the quality of dairy products through iron binding and antimicrobial activity is gaining significant attention. Milk processing companies are increasingly adopting lactoferrin for its ability to improve the shelf life and safety of infant formula and protein hydrolysates. Beyond food applications, lactoferrin's immune support properties are being explored in the pharmaceutical industry. Its potential in wound healing, cell proliferation, and inflammation modulation has led to extensive research and development efforts. Biotechnological applications, such as drug delivery systems and biopharmaceutical development, are also gaining traction.
The market's future prospects are promising, with ongoing research focusing on fractionation techniques to isolate and purify lactoferrin for use in dosage forms like tablets, capsules, and powders. The demand for lactoferrin supplements in dietary supplements, veterinary applications, and sports nutrition is also on the rise. The ongoing unfolding of market activities is influenced by various factors, including safety assessment, regulatory approvals, and efficacy studies. Patent applications and investment opportunities are also shaping the competitive landscape. As the market continues to evolve, lactoferrin's antioxidant properties and potential use in functional foods, gut health, and antimicrobial activity are emerging trends that are expected to drive growth.
Microbial contamination and stability studies remain critical areas of focus for ensuring the quality and safety of lactoferrin products. The regulatory landscape is becoming increasingly complex, with regulatory bodies requiring stringent safety and efficacy data before approving new applications. Despite these challenges, the market's continuous dynamism presents numerous opportunities for innovation and growth.
How is this Bovine Lactoferrin Industry segmented?
The bovine lactoferrin industry research report provides comprehensive data (region-wise segment analysis), with forecasts and estimates in "USD million" for the period 2025-2029, as well as historical data from 2019-2023 for the following segments.
- Application
- Infant nutrition
- Dietary supplement
- Others
- Type
- Freeze dried powder
- Spray dried powder
- Geography
- North America
- US
- Europe
- France
- Germany
- Italy
- UK
- APAC
- Australia
- China
- India
- Japan
- South Korea
- Rest of World (ROW)
- North America
.
By Application Insights
The infant nutrition segment is estimated to witness significant growth during the forecast period.
The market encompasses various applications, including infant formula, protein hydrolysates, animal feed, and dietary supplements. The industry's growth is driven by the increasing demand for lactoferrin in cell proliferation, inflammation modulation, and immune support. Lactoferrin, a milk-derived protein, exhibits antimicrobial activity, antioxidant properties, and iron binding capabilities. In the realm of infant nutrition, lactoferrin supplements are gaining popularity due to their potential role in supporting gut health and enhancing the immune system. The food industry utilizes lactoferrin as a food additive, ensuring product stability and safety assessment during milk processing and fractionation techniques. Animal feed applications are another significant market segment, with lactoferrin's role in improving animal health and productivity.
Veterinary applications are also on the rise, as lactoferrin's anti-inflammatory properties aid in wound healing and immune support. Biotechnology companies are investing in lactoferrin research, leading to advancements in biopharmaceutical development and drug delivery systems. Regulatory approvals and efficacy studies are underway for various applications, including sports nutrition and clinical trials. Emerging trends in the market include the use of lactoferrin in functional foods and beverages, as well as its potential in addressing microbial contamination. Future prospects are promising, with continued research and development in the field of lactoferrin and its various applications.
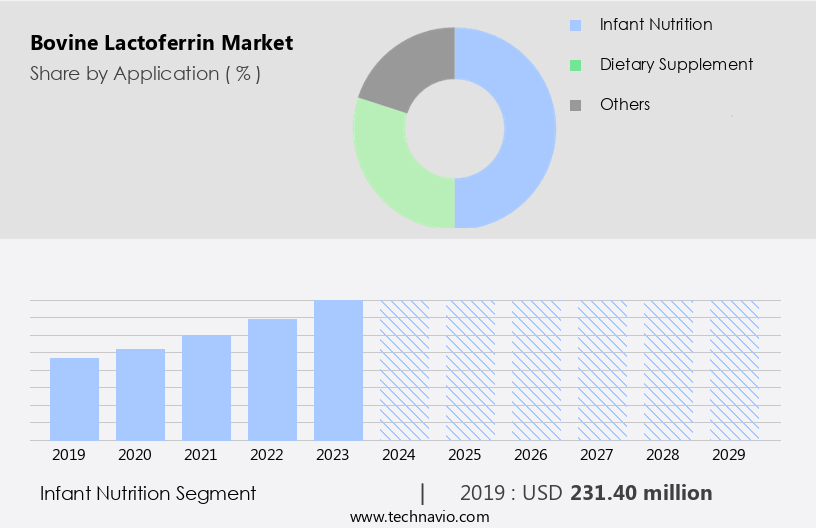
The Infant nutrition segment was valued at USD 231.40 billion in 2019 and showed a gradual increase during the forecast period.
Regional Analysis
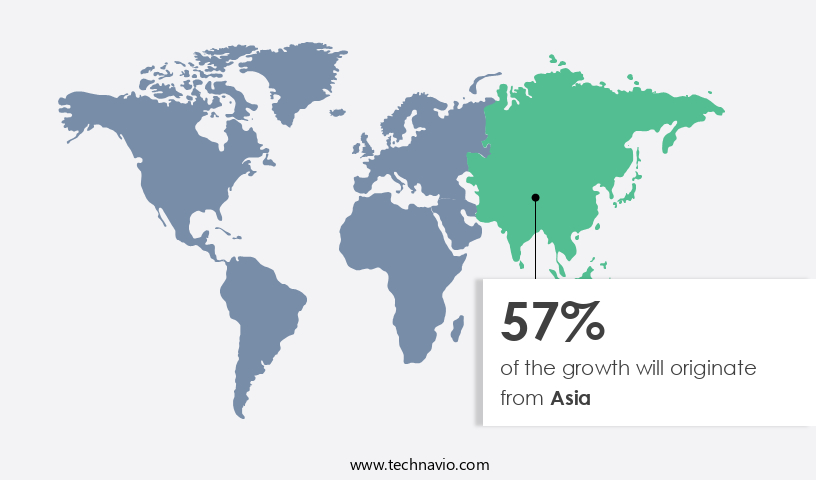
Asia is estimated to contribute 57% to the growth of the global market during the forecast period. Technavio's analysts have elaborately explained the regional trends and drivers that shape the market during the forecast period.
The market is witnessing significant growth due to its diverse applications in various industries. In the healthcare sector, lactoferrin is used in infant formula to support immune system development and reduce the risk of infections. In the animal feed industry, it is used as a growth promoter and an alternative to antibiotics. In the pharmaceutical industry, lactoferrin supplements are used for cell proliferation, inflammation modulation, and wound healing. Food and beverage manufacturers use lactoferrin as a food additive for its antimicrobial activity and antioxidant properties. Milk processing companies use lactoferrin for milk fractionation techniques to extract this protein for commercial use.
The market research reports suggest that the market is expected to grow at a steady pace due to increasing demand for lactoferrin in various industries. Biotechnology companies are investing in the development of lactoferrin-based drug delivery systems, biopharmaceutical development, and safety assessment. Patent applications for lactoferrin-based products are also on the rise. The market's future prospects lie in its potential use in sports nutrition, functional foods, and gut health. Quality control is a crucial factor in the production of bovine lactoferrin. Proper safety assessments and efficacy studies are necessary to ensure the efficacy and safety of lactoferrin-based products.
The market is also facing challenges due to microbial contamination and regulatory approvals. Investment opportunities exist in the market due to its potential applications in various industries. The market's growth is expected to be driven by the increasing demand for lactoferrin in infant formula, protein hydrolysates, and animal feed. The market's future prospects are promising, with potential applications in veterinary applications, dosage forms, and dietary supplements. In conclusion, the market is a dynamic and evolving market with significant growth potential. Its applications in various industries, including healthcare, animal feed, and food and beverage, are driving the market's growth.
The market's future prospects lie in its potential use in biopharmaceutical development, drug delivery systems, and functional foods. Despite the challenges, the market is expected to continue growing due to the increasing demand for better-quality products and the potential health benefits of lactoferrin.
Market Dynamics
Our researchers analyzed the data with 2024 as the base year, along with the key drivers, trends, and challenges. A holistic analysis of drivers will help companies refine their marketing strategies to gain a competitive advantage.
What are the key market drivers leading to the rise in the adoption of Bovine Lactoferrin Industry?
- The rising trend of working women and the prevalence of nuclear families are primary factors fueling market growth.
- The global market for bovine lactoferrin is experiencing growth due to the rising demand for convenient baby care products in the context of increasing numbers of working women and dual-income households. This demographic trend has led to an increase in average household income, which in turn is expected to fuel the market's expansion during the forecast period. Bovine lactoferrin, a glycoprotein with antimicrobial and antioxidant properties, is increasingly being used in the production of infant formula due to its ability to support immune system development in infants. Furthermore, its applications extend beyond infant nutrition, with uses in protein hydrolysates, animal feed, cell proliferation, and veterinary applications.
- Dosage forms of bovine lactoferrin include powders, capsules, tablets, and liquid solutions, making it a versatile ingredient in various industries. Market research reports indicate that the demand for bovine lactoferrin in dietary supplements is also on the rise, as consumers seek natural alternatives to boost their immune systems and overall health. In conclusion, the market is poised for growth due to its diverse applications and increasing demand across various industries. The market's expansion is driven by demographic trends, such as the rise of working women and dual-income households, and the growing awareness of the health benefits of bovine lactoferrin.
What are the market trends shaping the Bovine Lactoferrin Industry?
- The expansion of bovine lactoferrin production facilities is a current market trend. This growth is driven by increasing demand for this versatile protein due to its numerous health benefits and applications in various industries, including food, pharmaceuticals, and cosmetics.
- The market is experiencing significant growth due to the increasing demand for food additives with immune support and antimicrobial properties. This protein, derived from milk processing through fractionation techniques, is renowned for its iron binding, wound healing, and antioxidant properties. Quality control is a top priority in the production of bovine lactoferrin to ensure its efficacy and safety. New production facilities are being established to meet the escalating demand for this versatile protein. For instance, Royal FrieslandCampina NV recently opened a new facility in Veghel, Netherlands, increasing their annual capacity from 20 to 80 metric tonnes.
- This expansion aligns with the latest sustainability standards, further driving the market's growth. Bovine lactoferrin's antimicrobial activity and immune support make it an attractive addition to various food products and pharmaceuticals. Its antioxidant properties also contribute to its appeal as a health supplement. As research continues to uncover new applications for this protein, the future prospects for the market look promising.
What challenges does the Bovine Lactoferrin Industry face during its growth?
- The global decline in birth rates poses a significant challenge to the growth of various industries.
- The global market for bovine lactoferrin, a milk-derived protein with inflammation modulating properties, presents investment opportunities in various sectors, including functional foods and biopharmaceutical development. This protein plays a crucial role in maintaining gut health and combating microbial contamination. Recent research has highlighted its potential applications in addressing inflammation and promoting harmonious gut microbiota. Factors such as increasing awareness of the health benefits of functional foods and the growing demand for natural ingredients are expected to fuel market growth. Furthermore, the safety assessment and patent applications of bovine lactoferrin by biotechnology companies underscore its potential as a valuable commodity.
- However, challenges in production and standardization, as well as regulatory hurdles, may pose obstacles to market expansion. Despite these challenges, the decline in birth rates in several countries has created a demand for alternative sources of essential nutrients, such as bovine lactoferrin. Rising per capita income and cultural changes have influenced family size and dietary preferences, further fueling market growth. As research continues to uncover the potential applications of bovine lactoferrin, the market is poised for significant advancements in the coming years.
Exclusive Customer Landscape
The bovine lactoferrin market forecasting report includes the adoption lifecycle of the market, covering from the innovator's stage to the laggard's stage. It focuses on adoption rates in different regions based on penetration. Furthermore, the bovine lactoferrin market report also includes key purchase criteria and drivers of price sensitivity to help companies evaluate and develop their market growth analysis strategies.
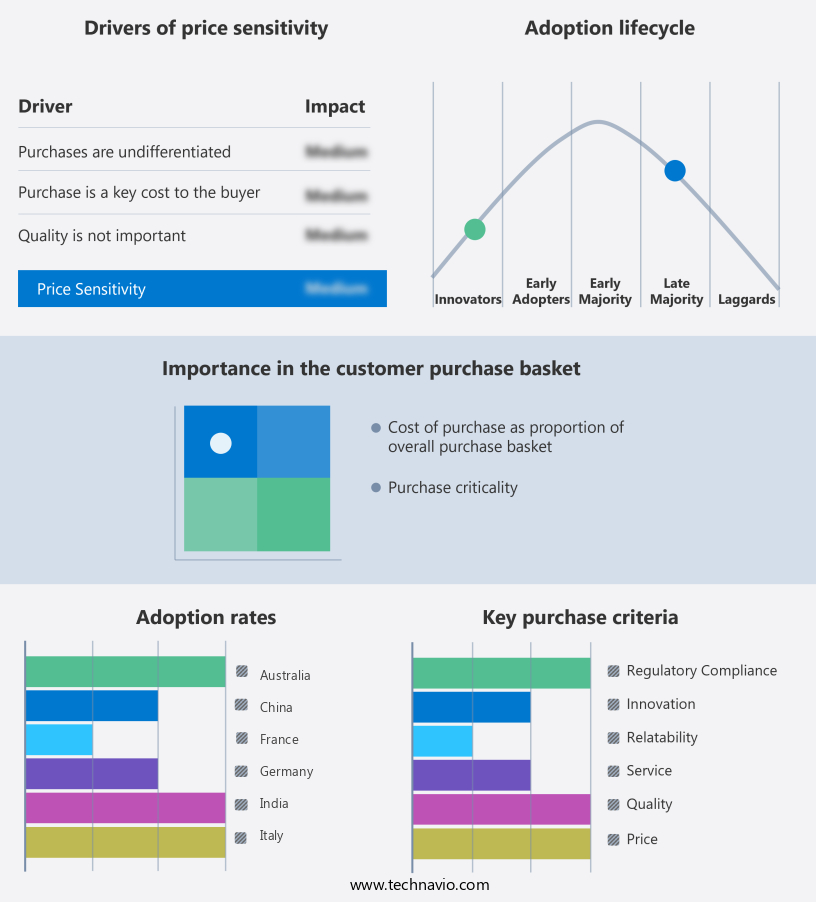
Customer Landscape
Key Companies & Market Insights
Companies are implementing various strategies, such as strategic alliances, bovine lactoferrin market forecast, partnerships, mergers and acquisitions, geographical expansion, and product/service launches, to enhance their presence in the industry.
Bega Cheese Ltd. - Bovine lactoferrin, a protein derived from cow milk, mirrors the lactoferrin found in human breast milk.
The industry research and growth report includes detailed analyses of the competitive landscape of the market and information about key companies, including:
- Bega Cheese Ltd.
- Beston Global Food Co. Ltd.
- Cure Nutraceutical PVT. LTD.
- Fonterra Cooperative Group Ltd.
- Glanbia plc
- Jarrow Formulas Inc.
- KAVYA PHARMA
- Merck KGaA
- MILEI GmbH
- Modilac
- Noumi Ltd.
- Oskia Skincare Ltd.
- Oy Medix Biochemica Ab
- Royal FrieslandCampina NV
- Saputo Inc.
- Savencia SA
- TurtleTree
- US CLINICALS
- Valfoo Asia Pacific Ltd.
Qualitative and quantitative analysis of companies has been conducted to help clients understand the wider business environment as well as the strengths and weaknesses of key industry players. Data is qualitatively analyzed to categorize companies as pure play, category-focused, industry-focused, and diversified; it is quantitatively analyzed to categorize companies as dominant, leading, strong, tentative, and weak.
Recent Development and News in Bovine Lactoferrin Market
- In February 2023, Danish dairy cooperative Arla Foods announced the launch of its new bovine lactoferrin ingredient, Lacprodan IS-1312, designed for use in infant formula and other food applications. This innovative product is expected to strengthen Arla's position in the global infant formula market (Business Wire).
- In May 2024, Dutch biotech company, Chr. Hansen, entered into a strategic partnership with Chinese dairy company, Mengniu Dairy, to develop and commercialize bovine lactoferrin in China. This collaboration is expected to expand Chr. Hansen's reach in the Asian market and bolster Mengniu's product portfolio (Reuters).
- In January 2025, Fonterra, the world's largest dairy exporter, completed the acquisition of New Zealand-based biotech company, LactoProduce, which specializes in the production of bovine lactoferrin. This acquisition is expected to enhance Fonterra's capabilities in the production and commercialization of high-value dairy ingredients (BusinessDesk).
- In March 2025, the European Food Safety Authority (EFSA) granted a positive opinion on the renewal of the health claim for bovine lactoferrin in the prevention of Helicobacter pylori infection. This regulatory approval is expected to boost market growth and increase consumer confidence in bovine lactoferrin-fortified products (EFSA).
Research Analyst Overview
- The market is characterized by ongoing research and development in the areas of purification methods, protein structure, and bioavailability studies. Lactoferrin concentration in various formulations is a significant market driver, with prebiotic fibers and probiotic strains being common additives to enhance health benefits. Price points vary based on production methods and dosage recommendations, which are influenced by clinical outcomes and consumer preferences. Side effects and safety concerns are crucial considerations for marketing strategies, with ongoing research addressing drug interactions and analytical techniques to ensure product safety. The immune system modulation, anti-inflammatory activity, and antibacterial properties of lactoferrin are well-documented, making it a popular ingredient in functional foods and dietary supplements.
- Antiviral activity and iron absorption are additional health benefits, with pharmacokinetic studies providing insights into the role of lactoferrin in the gut microbiota. Distribution channels continue to expand, with online sales and retail outlets catering to diverse consumer needs. Analytical techniques, such as mass spectrometry, are essential for understanding the protein structure and assessing the efficacy of purification methods. Anti-inflammatory and immune system modulation are key areas of research, with clinical trials investigating dosage recommendations and clinical outcomes. Safety concerns, including side effects and drug interactions, are being addressed through rigorous testing and research.
- The market for bovine lactoferrin is expected to grow, driven by consumer demand for natural health solutions and ongoing research into its health benefits.
Dive into Technavio's robust research methodology, blending expert interviews, extensive data synthesis, and validated models for unparalleled Bovine Lactoferrin Market insights. See full methodology.
|
Market Scope |
|
|
Report Coverage |
Details |
|
Page number |
192 |
|
Base year |
2024 |
|
Historic period |
2019-2023 |
|
Forecast period |
2025-2029 |
|
Growth momentum & CAGR |
Accelerate at a CAGR of 19.5% |
|
Market growth 2025-2029 |
USD 1284.5 million |
|
Market structure |
Fragmented |
|
YoY growth 2024-2025(%) |
16.3 |
|
Key countries |
China, US, Japan, India, South Korea, Germany, UK, Australia, France, and Italy |
|
Competitive landscape |
Leading Companies, Market Positioning of Companies, Competitive Strategies, and Industry Risks |
What are the Key Data Covered in this Bovine Lactoferrin Market Research and Growth Report?
- CAGR of the Bovine Lactoferrin industry during the forecast period
- Detailed information on factors that will drive the growth and forecasting between 2025 and 2029
- Precise estimation of the size of the market and its contribution of the industry in focus to the parent market
- Accurate predictions about upcoming growth and trends and changes in consumer behaviour
- Growth of the market across Asia, Europe, North America, and Rest of World (ROW)
- Thorough analysis of the market's competitive landscape and detailed information about companies
- Comprehensive analysis of factors that will challenge the bovine lactoferrin market growth of industry companies
We can help! Our analysts can customize this bovine lactoferrin market research report to meet your requirements.
 RIA -
RIA - 
