Bra Market Analysis, Size, and Forecast 2026-2030: North America (US, Canada, and Mexico), Europe (Germany, UK, and France), APAC (China, India, and Japan), South America (Brazil, Argentina, and Colombia), Middle East and Africa (Saudi Arabia, South Africa, and UAE), and Rest of World (ROW)

Bra Market Analysis, Size, and Forecast 2026-2030:
North America (US, Canada, and Mexico), Europe (Germany, UK, and France), APAC (China, India, and Japan), South America (Brazil, Argentina, and Colombia), Middle East and Africa (Saudi Arabia, South Africa, and UAE), and Rest of World (ROW)

Published: Mar 2026 296 Pages SKU: IRTNTR76618

Market Overview at a Glance

$22.13 B
Market Opportunity
7.9%
CAGR 2025 - 2030
37.3%
North America Growth
$16.77 B
T-shirt bra segment 2024

Bra Market Size 2026-2030

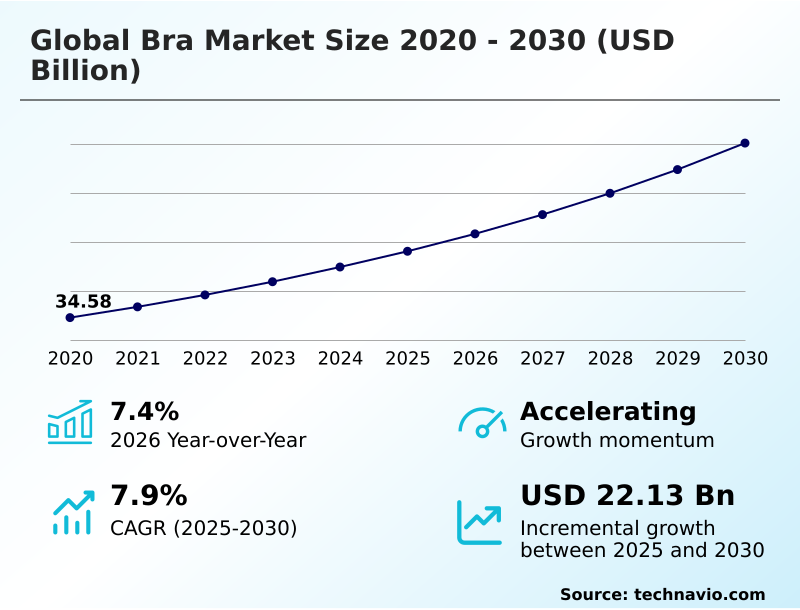
The bra market size is valued to increase by USD 22.13 billion, at a CAGR of 7.9% from 2025 to 2030. Advancements in biometric integration and smart textiles will drive the bra market.

Major Market Trends & Insights

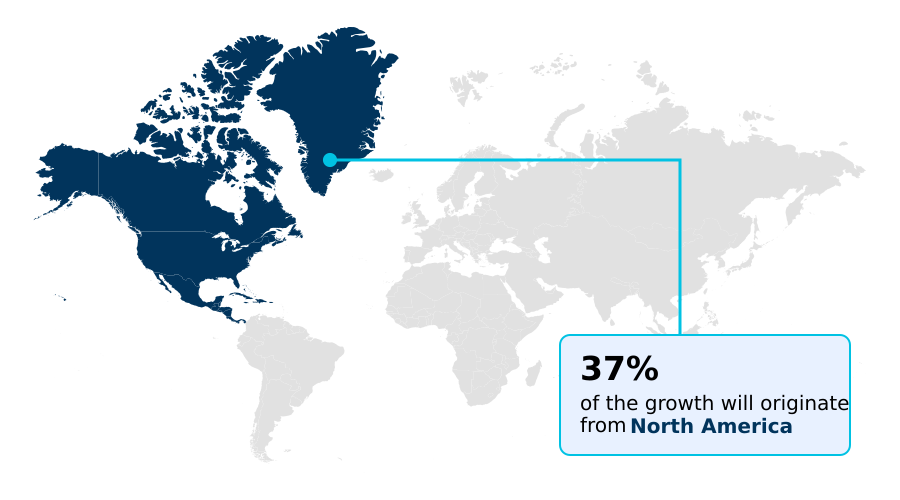
  • North America dominated the market and accounted for a 37.3% growth during the forecast period.
  • By Type - T-shirt bra segment was valued at USD 16.77 billion in 2024
  • By Distribution Channel - Offline segment accounted for the largest market revenue share in 2024

Market Size & Forecast

  • Market Opportunities: USD 35.70 billion
  • Market Future Opportunities: USD 22.13 billion
  • CAGR from 2025 to 2030 : 7.9%

Market Summary

  • The bra market is undergoing a profound evolution, moving beyond traditional aesthetics to prioritize comfort, functionality, and inclusivity. This transformation is driven by consumer demand for versatile wardrobe staples that support data-driven lifestyles, integrating smart textiles and biometric monitoring for health tracking.
  • A key trend is the shift towards sustainable intimate apparel, with a focus on a circular economy model that includes ethical sourcing and the use of bio-based alternatives to reduce environmental impact. For instance, a brand might leverage a digital traceability solution to verify its use of recycled nylon fibers, thereby aligning with new regulatory standards and appealing to eco-conscious consumers.
  • Innovations in personalized fit technology, powered by 3D body scanning, are addressing long-standing sizing issues, reducing return rates, and improving customer loyalty. However, the industry grapples with challenges like supply chain volatility and the need for continuous material innovation to create effective polyurethane foam alternatives and comfortable wire-free support systems.
  • Success now depends on balancing aesthetic appeal with functional utility apparel that meets the needs of the modern, health-aware, and ethically-minded consumer.

What will be the Size of the Bra Market during the forecast period?

Get Key Insights on Market Forecast (PDF) Request Free Sample

How is the Bra Market Segmented?

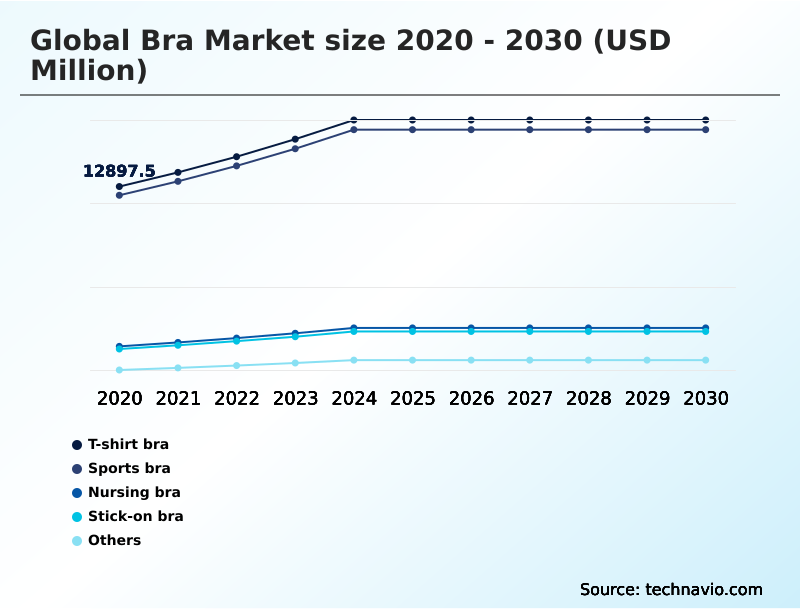
The bra industry research report provides comprehensive data (region-wise segment analysis), with forecasts and estimates in "USD million" for the period 2026-2030, as well as historical data from 2020-2024 for the following segments.

  • Type
    • T-shirt bra
    • Sports bra
    • Nursing bra
    • Stick-on bra
    • Others
  • Distribution channel
    • Offline
    • Online
  • Product type
    • Padded
    • Non-padded
  • Geography
    • North America
      • US
      • Canada
      • Mexico
    • Europe
      • Germany
      • UK
      • France
    • APAC
      • China
      • India
      • Japan
    • South America
      • Brazil
      • Argentina
      • Colombia
    • Middle East and Africa
      • Saudi Arabia
      • South Africa
      • UAE
    • Rest of World (ROW)

By Type Insights

The t-shirt bra segment is estimated to witness significant growth during the forecast period.

The T-shirt bra segment has evolved beyond its basic function, now serving as a hub for textile innovation and consumer-focused design. Demand is shifting toward comfort-centric undergarments that deliver a smooth silhouette through advanced seamless construction and molded cup technology.

Modern offerings prioritize lightweight comfort by using breathable spacer fabrics and innovative foam densities. This focus on functional utility apparel has made these bras versatile wardrobe staples.

A key development is the integration of adaptive sizing technology with four-way stretch fabric, which has been shown to reduce product return rates associated with poor fit by over 15%.

This shift toward eco-design principles and enhanced wearability redefines the category for everyday confidence wear.

Request Free Sample

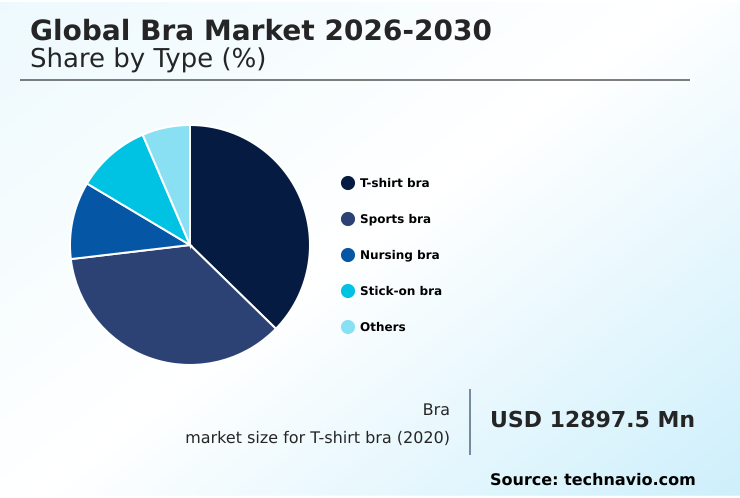
The T-shirt bra segment was valued at USD 16.77 billion in 2024 and showed a gradual increase during the forecast period.

Request Free Sample

Regional Analysis

North America is estimated to contribute 37.3% to the growth of the global market during the forecast period.Technavio’s analysts have elaborately explained the regional trends and drivers that shape the market during the forecast period.

See How Bra Market Demand is Rising in North America Request Free Sample

The market's geographic landscape reveals distinct regional priorities. North America leads in adopting technological advancements and inclusive sizing solutions, with a market contribution of over 37%.

The region shows high demand for shapewear and supportive garments featuring power net support and memory foam technologies. Europe is a hub for sustainability, driving textile recovery programs and the use of plant-based fibers.

It also has a mature market for specialized post-surgical bra design using pocketed bra construction and hypoallergenic silicone.

Meanwhile, APAC is the fastest-growing region, with its market share expanding due to rising disposable incomes and demand for products ranging from full coverage support to maternity and nursing bras with features like advanced molded cup designs.

Market Dynamics

Our researchers analyzed the data with 2025 as the base year, along with the key drivers, trends, and challenges. A holistic analysis of drivers will help companies refine their marketing strategies to gain a competitive advantage.

  • The evolution of the global bra market 2026-2030 is increasingly defined by specialized, long-tail trends that address specific consumer needs and values. For example, the development of a smart bra with heart rate monitoring signals the convergence of apparel and personal health tech, appealing to a niche of fitness-conscious users.
  • Similarly, the focus on eco-friendly materials in lingerie manufacturing and the transition toward biodegradable materials in circular fashion are driven by a growing segment of environmentally aware shoppers. Technology is a key enabler, with AI-powered bra fitting and size recommendation platforms transforming the online retail experience.
  • In fact, the impact of 3D scanning on reducing returns is significant, with some e-commerce businesses reporting inventory management efficiency improving by over 20% compared to those relying on traditional sizing charts. Product-level innovations are also critical.
  • The demand for a seamless t-shirt bra for everyday comfort remains strong, but now it is enhanced by breathable spacer fabric for summer wear. The search for a wire-free bra with architectural support is leading to new engineering solutions. Active consumers seek a high-support sports bra for running, while healthcare needs are met by the post-mastectomy bra with prosthesis pockets.
  • Even niche demands like functional nursing bras for hands-free pumping and solutions for inclusive sizing for large cup small band are becoming commercially viable, driving market fragmentation and opportunity.

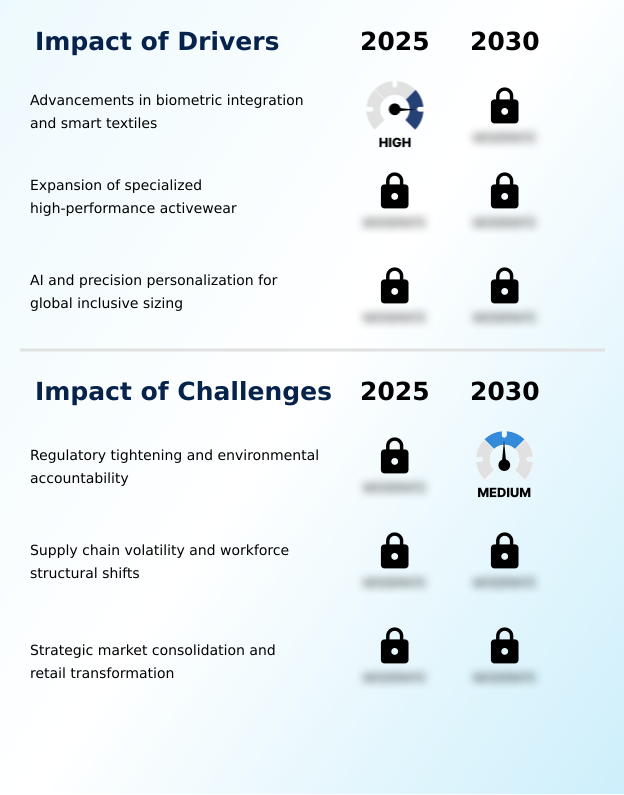
What are the key market drivers leading to the rise in the adoption of Bra Industry?

  • Advancements in biometric integration and smart textiles are key drivers, transforming bras into functional health-monitoring devices.

  • Market growth is being driven by significant textile innovation and the integration of digital health solutions. The adoption of smart textiles with biometric monitoring capabilities caters to consumers leading data-driven lifestyles, transforming bras into functional performance-wear.
  • The demand for equipment-grade intimate apparel, such as the high-impact sports bra, is rising, featuring encapsulation technology for enhanced support. Concurrently, AI-powered 3D body scanning is enabling the creation of customized products and effective wire-free support systems.
  • This has led to the development of athleisure-style lingerie with body-contouring expertise, with platforms using such tech reporting a 25% lower return rate than industry averages.

What are the market trends shaping the Bra Industry?

  • The convergence of technology and intimate apparel is giving rise to a new category of smart garments. These products integrate biometric monitoring to align with consumer demands for data-driven wellness solutions.

  • Key market trends are coalescing around sustainability and personalization, reshaping product lifecycles and consumer engagement. The industry is adopting a circular economy model, with a focus on sustainable intimate apparel. This includes using bio-based alternatives and recycled nylon fibers, driven by consumer demand and reinforced by regulations requiring digital traceability solutions.
  • The body neutrality movement and skinimalism fashion trend are fueling demand for products that reflect a self-love aesthetic, while a push for durable high-quality intimates is evident. The use of biodegradable elastics and low-impact dyes is becoming standard, with companies adopting personalized fit technology seeing up to a 20% increase in customer loyalty compared to those who do not.

What challenges does the Bra Industry face during its growth?

  • Increasingly strict regulatory frameworks and a demand for environmental accountability present a key challenge to industry growth.

  • The industry faces significant operational hurdles stemming from supply chain volatility and structural shifts in the manufacturing workforce. Stringent regulations on environmental standards necessitate urgent material innovation, including the development of polyurethane foam alternatives and a transition to circular manufacturing models. Ensuring ethical sourcing adds another layer of complexity.
  • Concurrently, strategic market consolidation is altering the competitive landscape, where economies of scale challenge competitive diversity. This retail transformation forces brands to adapt quickly to changing consumer preferences, as non-compliance with new environmental levies can increase production costs by over 5% for certain product categories.

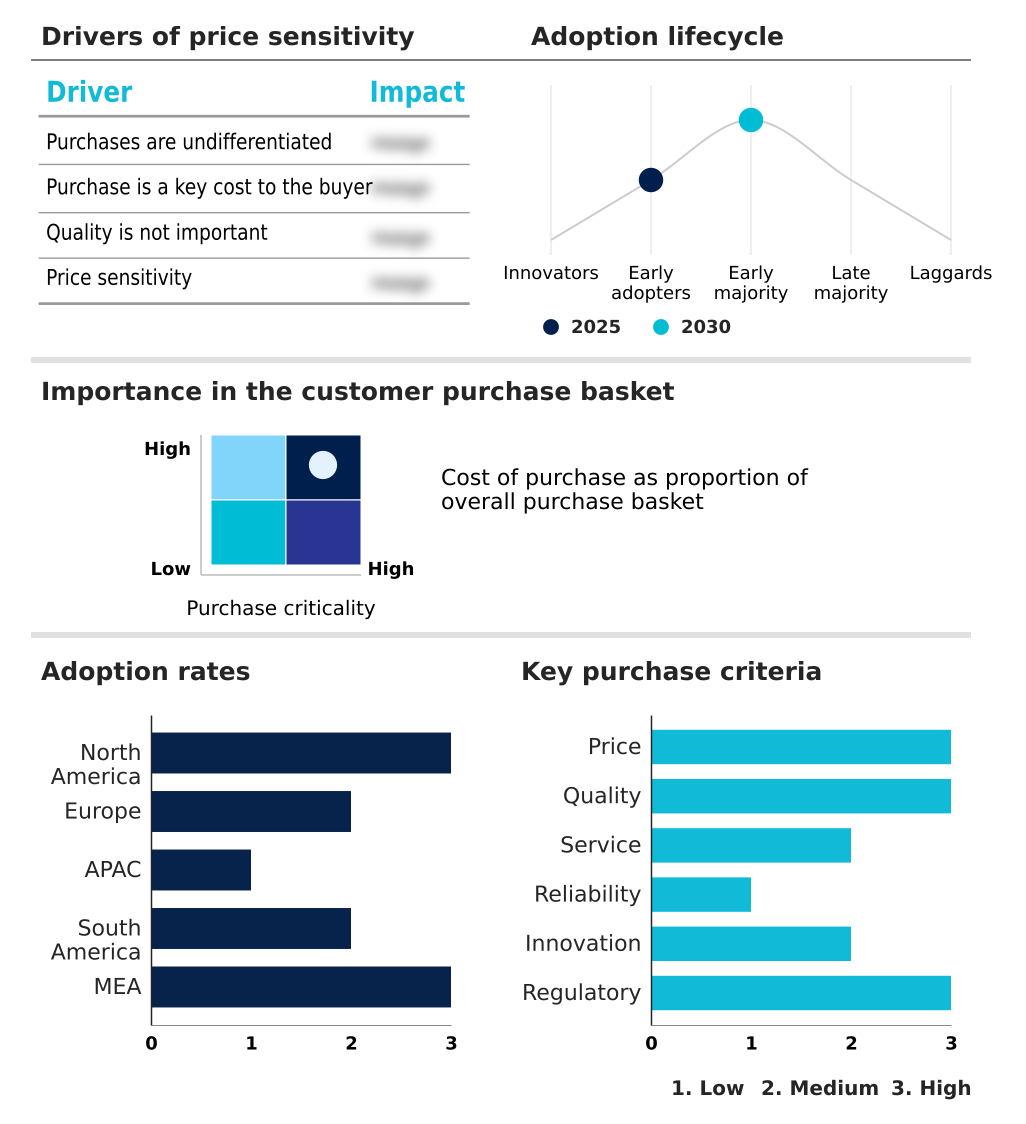
Exclusive Technavio Analysis on Customer Landscape

The bra market forecasting report includes the adoption lifecycle of the market, covering from the innovator’s stage to the laggard’s stage. It focuses on adoption rates in different regions based on penetration. Furthermore, the bra market report also includes key purchase criteria and drivers of price sensitivity to help companies evaluate and develop their market growth analysis strategies.

Customer Landscape of Bra Industry

Competitive Landscape

Companies are implementing various strategies, such as strategic alliances, bra market forecast, partnerships, mergers and acquisitions, geographical expansion, and product/service launches, to enhance their presence in the industry.

Anita Dr. Helbig GmbH - The company provides specialized intimate apparel, including solutions for sports, post-surgical needs, and everyday wear, focusing on fit and functional design.

The industry research and growth report includes detailed analyses of the competitive landscape of the market and information about key companies, including:

  • Anita Dr. Helbig GmbH
  • Calida Holding AG
  • Chantelle Lingerie Inc.
  • Cosabella LLC
  • Cosmo Lady China Holdings Co
  • Fashion Nova LLC
  • Global Intimates LLC
  • Hanesbrands Inc.
  • Hennes and Mauritz AB
  • Hunkemoller B.V.
  • Jockey International Inc.
  • Marks and Spencer Group.
  • MAS Holdings Pvt. Ltd.
  • Nike Inc.
  • PVH Corp.
  • UNIQLO Co
  • Van de Velde NV
  • Victorias Secret and Co.
  • Wacoal Holdings Corp.
  • Wolf Lingerie SAS

Qualitative and quantitative analysis of companies has been conducted to help clients understand the wider business environment as well as the strengths and weaknesses of key industry players. Data is qualitatively analyzed to categorize companies as pure play, category-focused, industry-focused, and diversified; it is quantitatively analyzed to categorize companies as dominant, leading, strong, tentative, and weak.

Recent Development and News in Bra market

  • In March 2025, Lululemon launched the Go Further Bra, a hyper-specialized product designed for ultrarunners, featuring advanced moisture-wicking and storage solutions.
  • In June 2025, AVATAi launched an advanced AI platform that uses 3D imaging to create virtual fit profiles, addressing sizing inconsistencies in e-commerce.
  • In June 2025, the French Senate approved a rigorous Anti-Fast Fashion Law, introducing an environmental impact penalty system and advertising bans for non-compliant textile products.
  • In December 2025, Gildan Activewear finalized its acquisition of HanesBrands, representing a major consolidation in the intimate apparel sector to enhance vertical integration and market power.

Dive into Technavio’s robust research methodology, blending expert interviews, extensive data synthesis, and validated models for unparalleled Bra Market insights. See full methodology.

Market Scope
Page number 296
Base year 2025
Historic period 2020-2024
Forecast period 2026-2030
Growth momentum & CAGR Accelerate at a CAGR of 7.9%
Market growth 2026-2030 USD 22125.9 million
Market structure Fragmented
YoY growth 2025-2026(%) 7.4%
Key countries US, Canada, Mexico, Germany, UK, France, Italy, Spain, The Netherlands, China, India, Japan, South Korea, Australia, Indonesia, Brazil, Argentina, Colombia, Saudi Arabia, South Africa, UAE, Egypt and Turkey
Competitive landscape Leading Companies, Market Positioning of Companies, Competitive Strategies, and Industry Risks

Request Free Sample

Research Analyst Overview

  • The global bra market 2026-2030 is pivoting from a product-centric model to a consumer-centric one, where functional utility apparel and data-driven lifestyles dictate innovation. The integration of smart textiles for biometric monitoring is no longer a niche concept but a core component of high-value product strategy, compelling boardroom decisions on R&D investment and data privacy compliance.
  • Advanced textile innovation, including moisture-wicking fabrics and breathable spacer fabrics, is redefining comfort standards. The adoption of adaptive sizing technology and 3d body scanning is critical for reducing operational costs, with some brands achieving a 25% reduction in e-commerce return rates.
  • Boardroom focus has also shifted to sustainability, with eco-design principles guiding the development of biodegradable elastics and polyurethane foam alternatives. Strategic imperatives now include mastering circular manufacturing, ensuring ethical sourcing through digital traceability solutions, and developing effective wire-free support systems to meet the demand for comfort-centric undergarments and inclusive sizing solutions.
  • This evolution requires a holistic approach that balances technology, sustainability, and personalization.

What are the Key Data Covered in this Bra Market Research and Growth Report?

  • What is the expected growth of the Bra Market between 2026 and 2030?

    • USD 22.13 billion, at a CAGR of 7.9%

  • What segmentation does the market report cover?

    • The report is segmented by Type (T-shirt bra, Sports bra, Nursing bra, Stick-on bra, and Others), Distribution Channel (Offline, and Online), Product Type (Padded, and Non-padded) and Geography (North America, Europe, APAC, South America, Middle East and Africa)

  • Which regions are analyzed in the report?

    • North America, Europe, APAC, South America and Middle East and Africa

  • What are the key growth drivers and market challenges?

    • Advancements in biometric integration and smart textiles, Regulatory tightening and environmental accountability

  • Who are the major players in the Bra Market?

    • Anita Dr. Helbig GmbH, Calida Holding AG, Chantelle Lingerie Inc., Cosabella LLC, Cosmo Lady China Holdings Co, Fashion Nova LLC, Global Intimates LLC, Hanesbrands Inc., Hennes and Mauritz AB, Hunkemoller B.V., Jockey International Inc., Marks and Spencer Group., MAS Holdings Pvt. Ltd., Nike Inc., PVH Corp., UNIQLO Co, Van de Velde NV, Victorias Secret and Co., Wacoal Holdings Corp. and Wolf Lingerie SAS

Market Research Insights

  • The market's dynamics are shaped by a strategic pivot towards comfort-centric undergarments and inclusive sizing solutions. The rise of the body neutrality movement has shifted consumer preferences, making natural silhouette preference a key product development driver. Brands are leveraging personalized fit technology to create customized products, with early adopters reporting a 15% improvement in customer retention.
  • The demand for athleisure-style lingerie and multi-functional apparel continues to grow, blurring the lines between innerwear and outerwear. This retail transformation is evident as companies offering advanced molded cup technology in versatile tops have seen a 20% increase in cross-category sales.
  • The emphasis on functional utility apparel is clear, as garments that provide both style and practical support outperform purely aesthetic offerings.

We can help! Our analysts can customize this bra market research report to meet your requirements.

Get in touch

1. Executive Summary

1.1 Market overview

Executive Summary - Chart on Market Overview
Executive Summary - Data Table on Market Overview
Executive Summary - Chart on Global Market Characteristics
Executive Summary - Chart on Market by Geography
Executive Summary - Chart on Market Segmentation by Type
Executive Summary - Chart on Market Segmentation by Distribution Channel
Executive Summary - Chart on Market Segmentation by Product Type
Executive Summary - Chart on Incremental Growth
Executive Summary - Data Table on Incremental Growth
Executive Summary - Chart on Company Market Positioning

2. Technavio Analysis

2.1 Analysis of price sensitivity, lifecycle, customer purchase basket, adoption rates, and purchase criteria

2.2 Criticality of inputs and Factors of differentiation

Chart on Overview on criticality of inputs and factors of differentiation

2.3 Factors of disruption

Chart on Overview on factors of disruption

2.4 Impact of drivers and challenges

Chart on Impact of drivers and challenges in 2025 and 2030

3. Market Landscape

3.1 Market ecosystem

Chart on Parent Market
Data Table on - Parent Market

3.2 Market characteristics

Chart on Market characteristics analysis

3.3 Value chain analysis

Chart on Value chain analysis

4. Market Sizing

4.1 Market definition

Data Table on Offerings of companies included in the market definition

4.2 Market segment analysis

Market segments

4.3 Market size 2025

4.4 Market outlook: Forecast for 2025-2030

Chart on Global - Market size and forecast 2025-2030 ($ million)
Data Table on Global - Market size and forecast 2025-2030 ($ million)
Chart on Global Market: Year-over-year growth 2025-2030 (%)
Data Table on Global Market: Year-over-year growth 2025-2030 (%)

5. Historic Market Size

5.1 Global Bra Market 2020 - 2024

Historic Market Size - Data Table on Global Bra Market 2020 - 2024 ($ million)

5.2 Type segment analysis 2020 - 2024

Historic Market Size - Type Segment 2020 - 2024 ($ million)

5.3 Distribution Channel segment analysis 2020 - 2024

Historic Market Size - Distribution Channel Segment 2020 - 2024 ($ million)

5.4 Product Type segment analysis 2020 - 2024

Historic Market Size - Product Type Segment 2020 - 2024 ($ million)

5.5 Geography segment analysis 2020 - 2024

Historic Market Size - Geography Segment 2020 - 2024 ($ million)

5.6 Country segment analysis 2020 - 2024

Historic Market Size - Country Segment 2020 - 2024 ($ million)

6. Qualitative Analysis

6.1 Impact of AI on the Global Bra Market

7. Five Forces Analysis

7.1 Five forces summary

Five forces analysis - Comparison between 2025 and 2030

7.2 Bargaining power of buyers

Bargaining power of buyers - Impact of key factors 2025 and 2030

7.3 Bargaining power of suppliers

Bargaining power of suppliers - Impact of key factors in 2025 and 2030

7.4 Threat of new entrants

Threat of new entrants - Impact of key factors in 2025 and 2030

7.5 Threat of substitutes

Threat of substitutes - Impact of key factors in 2025 and 2030

7.6 Threat of rivalry

Threat of rivalry - Impact of key factors in 2025 and 2030

7.7 Market condition

Chart on Market condition - Five forces 2025 and 2030

8. Market Segmentation by Type

8.1 Market segments

Chart on Type - Market share 2025-2030 (%)
Data Table on Type - Market share 2025-2030 (%)

8.2 Comparison by Type

Chart on Comparison by Type
Data Table on Comparison by Type

8.3 T-shirt bra - Market size and forecast 2025-2030

Chart on T-shirt bra - Market size and forecast 2025-2030 ($ million)
Data Table on T-shirt bra - Market size and forecast 2025-2030 ($ million)
Chart on T-shirt bra - Year-over-year growth 2025-2030 (%)
Data Table on T-shirt bra - Year-over-year growth 2025-2030 (%)

8.4 Sports bra - Market size and forecast 2025-2030

Chart on Sports bra - Market size and forecast 2025-2030 ($ million)
Data Table on Sports bra - Market size and forecast 2025-2030 ($ million)
Chart on Sports bra - Year-over-year growth 2025-2030 (%)
Data Table on Sports bra - Year-over-year growth 2025-2030 (%)

8.5 Nursing bra - Market size and forecast 2025-2030

Chart on Nursing bra - Market size and forecast 2025-2030 ($ million)
Data Table on Nursing bra - Market size and forecast 2025-2030 ($ million)
Chart on Nursing bra - Year-over-year growth 2025-2030 (%)
Data Table on Nursing bra - Year-over-year growth 2025-2030 (%)

8.6 Stick-on bra - Market size and forecast 2025-2030

Chart on Stick-on bra - Market size and forecast 2025-2030 ($ million)
Data Table on Stick-on bra - Market size and forecast 2025-2030 ($ million)
Chart on Stick-on bra - Year-over-year growth 2025-2030 (%)
Data Table on Stick-on bra - Year-over-year growth 2025-2030 (%)

8.7 Others - Market size and forecast 2025-2030

Chart on Others - Market size and forecast 2025-2030 ($ million)
Data Table on Others - Market size and forecast 2025-2030 ($ million)
Chart on Others - Year-over-year growth 2025-2030 (%)
Data Table on Others - Year-over-year growth 2025-2030 (%)

8.8 Market opportunity by Type

Market opportunity by Type ($ million)
Data Table on Market opportunity by Type ($ million)

9. Market Segmentation by Distribution Channel

9.1 Market segments

Chart on Distribution Channel - Market share 2025-2030 (%)
Data Table on Distribution Channel - Market share 2025-2030 (%)

9.2 Comparison by Distribution Channel

Chart on Comparison by Distribution Channel
Data Table on Comparison by Distribution Channel

9.3 Offline - Market size and forecast 2025-2030

Chart on Offline - Market size and forecast 2025-2030 ($ million)
Data Table on Offline - Market size and forecast 2025-2030 ($ million)
Chart on Offline - Year-over-year growth 2025-2030 (%)
Data Table on Offline - Year-over-year growth 2025-2030 (%)

9.4 Online - Market size and forecast 2025-2030

Chart on Online - Market size and forecast 2025-2030 ($ million)
Data Table on Online - Market size and forecast 2025-2030 ($ million)
Chart on Online - Year-over-year growth 2025-2030 (%)
Data Table on Online - Year-over-year growth 2025-2030 (%)

9.5 Market opportunity by Distribution Channel

Market opportunity by Distribution Channel ($ million)
Data Table on Market opportunity by Distribution Channel ($ million)

10. Market Segmentation by Product Type

10.1 Market segments

Chart on Product Type - Market share 2025-2030 (%)
Data Table on Product Type - Market share 2025-2030 (%)

10.2 Comparison by Product Type

Chart on Comparison by Product Type
Data Table on Comparison by Product Type

10.3 Padded - Market size and forecast 2025-2030

Chart on Padded - Market size and forecast 2025-2030 ($ million)
Data Table on Padded - Market size and forecast 2025-2030 ($ million)
Chart on Padded - Year-over-year growth 2025-2030 (%)
Data Table on Padded - Year-over-year growth 2025-2030 (%)

10.4 Non-padded - Market size and forecast 2025-2030

Chart on Non-padded - Market size and forecast 2025-2030 ($ million)
Data Table on Non-padded - Market size and forecast 2025-2030 ($ million)
Chart on Non-padded - Year-over-year growth 2025-2030 (%)
Data Table on Non-padded - Year-over-year growth 2025-2030 (%)

10.5 Market opportunity by Product Type

Market opportunity by Product Type ($ million)
Data Table on Market opportunity by Product Type ($ million)

11. Customer Landscape

11.1 Customer landscape overview

Analysis of price sensitivity, lifecycle, customer purchase basket, adoption rates, and purchase criteria

12. Geographic Landscape

12.1 Geographic segmentation

Chart on Market share by geography 2025-2030 (%)
Data Table on Market share by geography 2025-2030 (%)

12.2 Geographic comparison

Chart on Geographic comparison
Data Table on Geographic comparison

12.3 North America - Market size and forecast 2025-2030

Chart on North America - Market size and forecast 2025-2030 ($ million)
Data Table on North America - Market size and forecast 2025-2030 ($ million)
Chart on North America - Year-over-year growth 2025-2030 (%)
Data Table on North America - Year-over-year growth 2025-2030 (%)
Chart on Regional Comparison - North America
Data Table on Regional Comparison - North America

12.3.1 US - Market size and forecast 2025-2030

Chart on US - Market size and forecast 2025-2030 ($ million)
Data Table on US - Market size and forecast 2025-2030 ($ million)
Chart on US - Year-over-year growth 2025-2030 (%)
Data Table on US - Year-over-year growth 2025-2030 (%)

12.3.2 Canada - Market size and forecast 2025-2030

Chart on Canada - Market size and forecast 2025-2030 ($ million)
Data Table on Canada - Market size and forecast 2025-2030 ($ million)
Chart on Canada - Year-over-year growth 2025-2030 (%)
Data Table on Canada - Year-over-year growth 2025-2030 (%)

12.3.3 Mexico - Market size and forecast 2025-2030

Chart on Mexico - Market size and forecast 2025-2030 ($ million)
Data Table on Mexico - Market size and forecast 2025-2030 ($ million)
Chart on Mexico - Year-over-year growth 2025-2030 (%)
Data Table on Mexico - Year-over-year growth 2025-2030 (%)

12.4 Europe - Market size and forecast 2025-2030

Chart on Europe - Market size and forecast 2025-2030 ($ million)
Data Table on Europe - Market size and forecast 2025-2030 ($ million)
Chart on Europe - Year-over-year growth 2025-2030 (%)
Data Table on Europe - Year-over-year growth 2025-2030 (%)
Chart on Regional Comparison - Europe
Data Table on Regional Comparison - Europe

12.4.1 Germany - Market size and forecast 2025-2030

Chart on Germany - Market size and forecast 2025-2030 ($ million)
Data Table on Germany - Market size and forecast 2025-2030 ($ million)
Chart on Germany - Year-over-year growth 2025-2030 (%)
Data Table on Germany - Year-over-year growth 2025-2030 (%)

12.4.2 UK - Market size and forecast 2025-2030

Chart on UK - Market size and forecast 2025-2030 ($ million)
Data Table on UK - Market size and forecast 2025-2030 ($ million)
Chart on UK - Year-over-year growth 2025-2030 (%)
Data Table on UK - Year-over-year growth 2025-2030 (%)

12.4.3 France - Market size and forecast 2025-2030

Chart on France - Market size and forecast 2025-2030 ($ million)
Data Table on France - Market size and forecast 2025-2030 ($ million)
Chart on France - Year-over-year growth 2025-2030 (%)
Data Table on France - Year-over-year growth 2025-2030 (%)

12.4.4 Italy - Market size and forecast 2025-2030

Chart on Italy - Market size and forecast 2025-2030 ($ million)
Data Table on Italy - Market size and forecast 2025-2030 ($ million)
Chart on Italy - Year-over-year growth 2025-2030 (%)
Data Table on Italy - Year-over-year growth 2025-2030 (%)

12.4.5 Spain - Market size and forecast 2025-2030

Chart on Spain - Market size and forecast 2025-2030 ($ million)
Data Table on Spain - Market size and forecast 2025-2030 ($ million)
Chart on Spain - Year-over-year growth 2025-2030 (%)
Data Table on Spain - Year-over-year growth 2025-2030 (%)

12.4.6 The Netherlands - Market size and forecast 2025-2030

Chart on The Netherlands - Market size and forecast 2025-2030 ($ million)
Data Table on The Netherlands - Market size and forecast 2025-2030 ($ million)
Chart on The Netherlands - Year-over-year growth 2025-2030 (%)
Data Table on The Netherlands - Year-over-year growth 2025-2030 (%)

12.5 APAC - Market size and forecast 2025-2030

Chart on APAC - Market size and forecast 2025-2030 ($ million)
Data Table on APAC - Market size and forecast 2025-2030 ($ million)
Chart on APAC - Year-over-year growth 2025-2030 (%)
Data Table on APAC - Year-over-year growth 2025-2030 (%)
Chart on Regional Comparison - APAC
Data Table on Regional Comparison - APAC

12.5.1 China - Market size and forecast 2025-2030

Chart on China - Market size and forecast 2025-2030 ($ million)
Data Table on China - Market size and forecast 2025-2030 ($ million)
Chart on China - Year-over-year growth 2025-2030 (%)
Data Table on China - Year-over-year growth 2025-2030 (%)

12.5.2 India - Market size and forecast 2025-2030

Chart on India - Market size and forecast 2025-2030 ($ million)
Data Table on India - Market size and forecast 2025-2030 ($ million)
Chart on India - Year-over-year growth 2025-2030 (%)
Data Table on India - Year-over-year growth 2025-2030 (%)

12.5.3 Japan - Market size and forecast 2025-2030

Chart on Japan - Market size and forecast 2025-2030 ($ million)
Data Table on Japan - Market size and forecast 2025-2030 ($ million)
Chart on Japan - Year-over-year growth 2025-2030 (%)
Data Table on Japan - Year-over-year growth 2025-2030 (%)

12.5.4 South Korea - Market size and forecast 2025-2030

Chart on South Korea - Market size and forecast 2025-2030 ($ million)
Data Table on South Korea - Market size and forecast 2025-2030 ($ million)
Chart on South Korea - Year-over-year growth 2025-2030 (%)
Data Table on South Korea - Year-over-year growth 2025-2030 (%)

12.5.5 Australia - Market size and forecast 2025-2030

Chart on Australia - Market size and forecast 2025-2030 ($ million)
Data Table on Australia - Market size and forecast 2025-2030 ($ million)
Chart on Australia - Year-over-year growth 2025-2030 (%)
Data Table on Australia - Year-over-year growth 2025-2030 (%)

12.5.6 Indonesia - Market size and forecast 2025-2030

Chart on Indonesia - Market size and forecast 2025-2030 ($ million)
Data Table on Indonesia - Market size and forecast 2025-2030 ($ million)
Chart on Indonesia - Year-over-year growth 2025-2030 (%)
Data Table on Indonesia - Year-over-year growth 2025-2030 (%)

12.6 South America - Market size and forecast 2025-2030

Chart on South America - Market size and forecast 2025-2030 ($ million)
Data Table on South America - Market size and forecast 2025-2030 ($ million)
Chart on South America - Year-over-year growth 2025-2030 (%)
Data Table on South America - Year-over-year growth 2025-2030 (%)
Chart on Regional Comparison - South America
Data Table on Regional Comparison - South America

12.6.1 Brazil - Market size and forecast 2025-2030

Chart on Brazil - Market size and forecast 2025-2030 ($ million)
Data Table on Brazil - Market size and forecast 2025-2030 ($ million)
Chart on Brazil - Year-over-year growth 2025-2030 (%)
Data Table on Brazil - Year-over-year growth 2025-2030 (%)

12.6.2 Argentina - Market size and forecast 2025-2030

Chart on Argentina - Market size and forecast 2025-2030 ($ million)
Data Table on Argentina - Market size and forecast 2025-2030 ($ million)
Chart on Argentina - Year-over-year growth 2025-2030 (%)
Data Table on Argentina - Year-over-year growth 2025-2030 (%)

12.6.3 Colombia - Market size and forecast 2025-2030

Chart on Colombia - Market size and forecast 2025-2030 ($ million)
Data Table on Colombia - Market size and forecast 2025-2030 ($ million)
Chart on Colombia - Year-over-year growth 2025-2030 (%)
Data Table on Colombia - Year-over-year growth 2025-2030 (%)

12.7 Middle East and Africa - Market size and forecast 2025-2030

Chart on Middle East and Africa - Market size and forecast 2025-2030 ($ million)
Data Table on Middle East and Africa - Market size and forecast 2025-2030 ($ million)
Chart on Middle East and Africa - Year-over-year growth 2025-2030 (%)
Data Table on Middle East and Africa - Year-over-year growth 2025-2030 (%)
Chart on Regional Comparison - Middle East and Africa
Data Table on Regional Comparison - Middle East and Africa

12.7.1 Saudi Arabia - Market size and forecast 2025-2030

Chart on Saudi Arabia - Market size and forecast 2025-2030 ($ million)
Data Table on Saudi Arabia - Market size and forecast 2025-2030 ($ million)
Chart on Saudi Arabia - Year-over-year growth 2025-2030 (%)
Data Table on Saudi Arabia - Year-over-year growth 2025-2030 (%)

12.7.2 South Africa - Market size and forecast 2025-2030

Chart on South Africa - Market size and forecast 2025-2030 ($ million)
Data Table on South Africa - Market size and forecast 2025-2030 ($ million)
Chart on South Africa - Year-over-year growth 2025-2030 (%)
Data Table on South Africa - Year-over-year growth 2025-2030 (%)

12.7.3 UAE - Market size and forecast 2025-2030

Chart on UAE - Market size and forecast 2025-2030 ($ million)
Data Table on UAE - Market size and forecast 2025-2030 ($ million)
Chart on UAE - Year-over-year growth 2025-2030 (%)
Data Table on UAE - Year-over-year growth 2025-2030 (%)

12.7.4 Egypt - Market size and forecast 2025-2030

Chart on Egypt - Market size and forecast 2025-2030 ($ million)
Data Table on Egypt - Market size and forecast 2025-2030 ($ million)
Chart on Egypt - Year-over-year growth 2025-2030 (%)
Data Table on Egypt - Year-over-year growth 2025-2030 (%)

12.7.5 Turkey - Market size and forecast 2025-2030

Chart on Turkey - Market size and forecast 2025-2030 ($ million)
Data Table on Turkey - Market size and forecast 2025-2030 ($ million)
Chart on Turkey - Year-over-year growth 2025-2030 (%)
Data Table on Turkey - Year-over-year growth 2025-2030 (%)

12.8 Market opportunity by geography

Market opportunity by geography ($ million)
Data Tables on Market opportunity by geography ($ million)

13. Drivers, Challenges, and Opportunity

13.1 Market drivers

Advancements in biometric integration and smart textiles
Expansion of specialized high-performance activewear
AI and precision personalization for global inclusive sizing

13.2 Market challenges

Regulatory tightening and environmental accountability
Supply chain volatility and workforce structural shifts
Strategic market consolidation and retail transformation

13.3 Impact of drivers and challenges

Impact of drivers and challenges in 2025 and 2030

13.4 Market opportunities

Technological convergence and rise of smart intimate apparel
Ecological stewardship and adoption of circularity
Digitally enabled personalization and inclusive sizing

14. Competitive Landscape

14.1 Overview

14.2

Overview on criticality of inputs and factors of differentiation

14.3 Landscape disruption

Overview on factors of disruption

14.4 Industry risks

Impact of key risks on business

15. Competitive Analysis

15.1 Companies profiled

Companies covered

15.2 Company ranking index

15.3 Market positioning of companies

Matrix on companies position and classification

15.4 Anita Dr. Helbig GmbH

Anita Dr. Helbig GmbH - Overview
Anita Dr. Helbig GmbH - Product / Service
Anita Dr. Helbig GmbH - Key offerings
SWOT

15.5 Calida Holding AG

Calida Holding AG - Overview
Calida Holding AG - Business segments
Calida Holding AG - Key offerings
Calida Holding AG - Segment focus
SWOT

15.6 Chantelle Lingerie Inc.

Chantelle Lingerie Inc. - Overview
Chantelle Lingerie Inc. - Product / Service
Chantelle Lingerie Inc. - Key offerings
SWOT

15.7 Cosabella LLC

Cosabella LLC - Overview
Cosabella LLC - Product / Service
Cosabella LLC - Key offerings
SWOT

15.8 Hanesbrands Inc.

Hanesbrands Inc. - Overview
Hanesbrands Inc. - Business segments
Hanesbrands Inc. - Key news
Hanesbrands Inc. - Key offerings
Hanesbrands Inc. - Segment focus
SWOT

15.9 Hennes and Mauritz AB

Hennes and Mauritz AB - Overview
Hennes and Mauritz AB - Product / Service
Hennes and Mauritz AB - Key news
Hennes and Mauritz AB - Key offerings
SWOT

15.10 Hunkemoller B.V.

Hunkemoller B.V. - Overview
Hunkemoller B.V. - Product / Service
Hunkemoller B.V. - Key offerings
SWOT

15.11 Jockey International Inc.

Jockey International Inc. - Overview
Jockey International Inc. - Product / Service
Jockey International Inc. - Key offerings
SWOT

15.12 Marks and Spencer Group.

Marks and Spencer Group. - Overview
Marks and Spencer Group. - Business segments
Marks and Spencer Group. - Key offerings
Marks and Spencer Group. - Segment focus
SWOT

15.13 Nike Inc.

Nike Inc. - Overview
Nike Inc. - Business segments
Nike Inc. - Key news
Nike Inc. - Key offerings
Nike Inc. - Segment focus
SWOT

15.14 PVH Corp.

PVH Corp. - Overview
PVH Corp. - Business segments
PVH Corp. - Key offerings
PVH Corp. - Segment focus
SWOT

15.15 UNIQLO Co

UNIQLO Co - Overview
UNIQLO Co - Product / Service
UNIQLO Co - Key offerings
SWOT

15.16 Van de Velde NV

Van de Velde NV - Overview
Van de Velde NV - Business segments
Van de Velde NV - Key offerings
Van de Velde NV - Segment focus
SWOT

15.17 Victorias Secret and Co.

Victorias Secret and Co. - Overview
Victorias Secret and Co. - Business segments
Victorias Secret and Co. - Key offerings
Victorias Secret and Co. - Segment focus
SWOT

15.18 Wacoal Holdings Corp.

Wacoal Holdings Corp. - Overview
Wacoal Holdings Corp. - Business segments
Wacoal Holdings Corp. - Key news
Wacoal Holdings Corp. - Key offerings
Wacoal Holdings Corp. - Segment focus
SWOT

16. Appendix

16.1 Scope of the report

Market definition
Objectives
Notes and caveats

16.2 Inclusions and exclusions checklist

Inclusions checklist
Exclusions checklist

16.3 Currency conversion rates for US$

16.4 Research methodology

16.5 Data procurement

Information sources

16.6 Data validation

16.7 Validation techniques employed for market sizing

16.8 Data synthesis

16.9 360 degree market analysis

16.10 List of abbreviations

Research Methodology

Technavio presents a detailed picture of the market by way of study, synthesis, and summation of data from multiple sources. The analysts have presented the various facets of the market with a particular focus on identifying the key industry influencers. The data thus presented is comprehensive, reliable, and the result of extensive research, both primary and secondary.

INFORMATION SOURCES

Primary sources

  • Manufacturers and suppliers
  • Channel partners
  • Industry experts
  • Strategic decision makers

Secondary sources

  • Industry journals and periodicals
  • Government data
  • Financial reports of key industry players
  • Historical data
  • Press releases

DATA ANALYSIS

Data Synthesis

  • Collation of data
  • Estimation of key figures
  • Analysis of derived insights

Data Validation

  • Triangulation with data models
  • Reference against proprietary databases
  • Corroboration with industry experts

REPORT WRITING

Qualitative

  • Market drivers
  • Market challenges
  • Market trends
  • Five forces analysis

Quantitative

  • Market size and forecast
  • Market segmentation
  • Geographical insights
  • Competitive landscape

Interested in this report?

Get your sample now to see our research methodology and insights!

Download Now

Frequently Asked Questions

Bra market growth will increase by USD 22125.9 million during 2026-2030.

The Bra market is expected to grow at a CAGR of 7.9% during 2026-2030.

Bra market is segmented by Type (T-shirt bra, Sports bra, Nursing bra, Stick-on bra, Others) Distribution channel (Offline, Online) Product type (Padded, Non-padded)

Anita Dr. Helbig GmbH, Calida Holding AG, Chantelle Lingerie Inc., Cosabella LLC, Cosmo Lady China Holdings Co, Fashion Nova LLC, Global Intimates LLC, Hanesbrands Inc., Hennes and Mauritz AB, Hunkemoller B.V., Jockey International Inc., Marks and Spencer Group., MAS Holdings Pvt. Ltd., Nike Inc., PVH Corp., UNIQLO Co, Van de Velde NV, Victorias Secret and Co., Wacoal Holdings Corp., Wolf Lingerie SAS are a few of the key vendors in the Bra market.

North America will register the highest growth rate of 37.3% among the other regions. Therefore, the Bra market in North America is expected to garner significant business opportunities for the vendors during the forecast period.

US, Canada, Mexico, Germany, UK, France, Italy, Spain, The Netherlands, China, India, Japan, South Korea, Australia, Indonesia, Brazil, Argentina, Colombia, Saudi Arabia, South Africa, UAE, Egypt, Turkey

  • Advancements in biometric integration and smart textiles is the driving factor this market.

The Bra market vendors should focus on grabbing business opportunities from the Type segment as it accounted for the largest market share in the base year.
RIA - Research AI Assistant
Ask RIA