
Building Information Modeling (BIM) Software Market Size 2025-2029
The building information modeling (bim) software market size is valued to increase USD 13.1 billion, at a CAGR of 24.8% from 2024 to 2029. Increasing need for management of large-scale projects will drive the building information modeling (bim) software market.
Major Market Trends & Insights
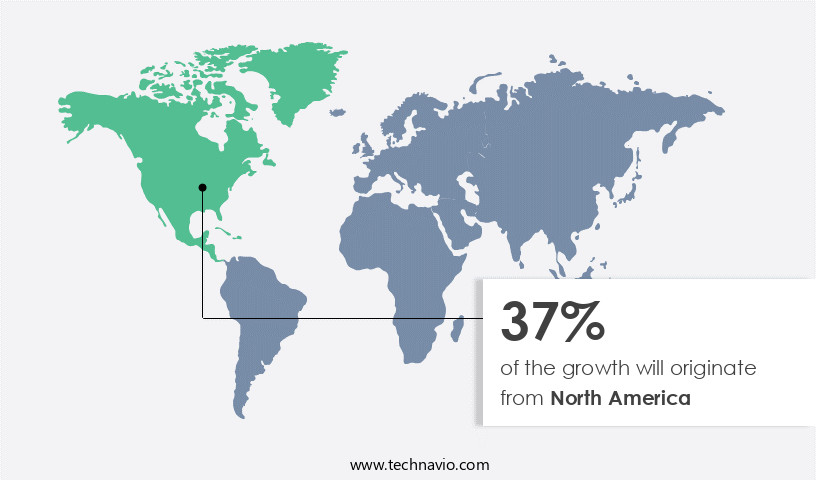
- North America dominated the market and accounted for a 37% growth during the forecast period.
- By End-user - Architects segment was valued at USD 1.24 billion in 2023
- By Deployment - On-premises segment accounted for the largest market revenue share in 2023
Market Size & Forecast
- Market Opportunities: USD 463.63 million
- Market Future Opportunities: USD 13098.10 million
- CAGR : 24.8%
- North America: Largest market in 2023
Market Summary
- The market represents a dynamic and continuously evolving sector, driven by advancements in technology and the increasing need for efficient management of large-scale construction projects. Core technologies, such as 5D building information modeling, enable more accurate and comprehensive project planning, design, and execution. Applications span various sectors, including architecture, engineering, and construction, with service types ranging from software licensing to managed services. Despite these benefits, challenges persist, including high implementation and operating costs.
- Regions like North America and Europe lead in BIM adoption, with Europe accounting for over 40% of the global market share. The market's ongoing evolution is influenced by various factors, including the growing importance of data-driven construction processes and increasing regulatory support for BIM adoption.
What will be the Size of the Building Information Modeling (BIM) Software Market during the forecast period?

Get Key Insights on Market Forecast (PDF) Request Free Sample
How is the Building Information Modeling (BIM) Software Market Segmented and what are the key trends of market segmentation?
The building information modeling (bim) software industry research report provides comprehensive data (region-wise segment analysis), with forecasts and estimates in "USD million" for the period 2025-2029, as well as historical data from 2019-2023 for the following segments.
- End-user
- Architects
- AEC engineering offices
- Contractors
- Facility managers
- Others
- Deployment
- On-premises
- Cloud-based
- Type
- Construction
- Pre-construction
- Post-construction
- Application
- Commercial
- Industrial
- Public infrastructure
- Residential
- Geography
- North America
- US
- Canada
- Europe
- France
- Germany
- Italy
- UK
- APAC
- China
- India
- Japan
- South Korea
- Rest of World (ROW)
- North America
By End-user Insights
The architects segment is estimated to witness significant growth during the forecast period.
Building Information Modeling (BIM) software has gained significant traction in the architecture industry, transforming the design and construction process. Approximately 75% of architectural firms in the US have adopted BIM, with Europe following closely at 70%. Looking forward, the industry anticipates a 25% increase in BIM adoption by 2026. Cloud-based BIM solutions have become increasingly popular due to their flexibility and accessibility, with over 60% of firms utilizing this technology. Clash detection software is another essential component, as it allows for the identification and resolution of potential design conflicts, reducing construction delays and rework by up to 30%.
Mobile BIM apps enable professionals to access project information on-the-go, contributing to a 12% increase in productivity. BIM collaboration platforms facilitate seamless communication and coordination among stakeholders, leading to a 15% reduction in project errors. IFC data exchange ensures interoperability between various BIM systems, while MEP engineering software and building performance simulation tools optimize energy efficiency and sustainability. Point cloud processing and structural analysis software enhance the accuracy and reliability of models, while parametric modeling and 4D BIM scheduling improve design flexibility and project planning. BIM software integration, data interoperability, and BIM data management are crucial aspects, ensuring a cohesive workflow.
Reality capture workflows, sustainability assessments, and quantity takeoff software further expand the capabilities of BIM, aligning with open BIM standards and digital twin technology. Construction simulation, BIM standards compliance, and facility management systems enable efficient cost estimation, design review, and model checking. Energy modeling software and BIM execution plans are essential components in the pursuit of energy efficiency and regulatory compliance. In summary, the market continues to evolve, offering numerous benefits to architects, engineers, and contractors. Its adoption is on the rise, with cloud-based solutions, clash detection software, and mobile apps driving growth. The integration of various BIM tools and technologies enhances collaboration, accuracy, and efficiency, ultimately leading to improved project outcomes.

The Architects segment was valued at USD 1.24 billion in 2019 and showed a gradual increase during the forecast period.

Regional Analysis
North America is estimated to contribute 37% to the growth of the global market during the forecast period.Technavio’s analysts have elaborately explained the regional trends and drivers that shape the market during the forecast period.
See How Building Information Modeling (BIM) Software Market Demand is Rising in North America Request Free Sample
The market in North America is experiencing significant growth, driven by the expanding residential and non-residential construction sectors. With an estimated annual spending of approximately USD1 trillion in the US construction industry, this region represents a lucrative market for BIM software providers. The maturity of the construction industry in North America, particularly in sectors such as oil and gas, manufacturing, building, and mining, contributes to the region's early adoption of advanced technologies. According to recent reports, the number of BIM users in the US is projected to increase, and the integration of BIM in design and construction processes is expected to become more widespread.
Furthermore, the adoption of BIM software is anticipated to lead to increased productivity, improved collaboration, and reduced project costs, making it a valuable investment for businesses in the region.
Market Dynamics
Our researchers analyzed the data with 2024 as the base year, along with the key drivers, trends, and challenges. A holistic analysis of drivers will help companies refine their marketing strategies to gain a competitive advantage.
The market encompasses a range of solutions designed to facilitate infrastructure project planning, design, and construction. These tools employ IFC data exchange for seamless building design collaboration, enabling parametric modeling techniques to optimize project efficiency. Real-time collaboration in BIM projects is a significant advantage, allowing for synchronous updates and reducing potential errors. Cloud-based BIM platforms have gained traction in the construction industry due to their flexibility and accessibility. Design review processes have been streamlined using BIM software, allowing for more accurate and efficient evaluations. Automated quantity takeoff in BIM software further enhances productivity by automating the estimation process.
Building performance simulation for energy efficiency is a key application of BIM, enabling architects and engineers to optimize designs for sustainability. Virtual reality applications in BIM for design visualization offer immersive experiences, enabling stakeholders to better understand complex designs. BIM implementation strategies for large-scale projects require careful planning and execution. MEP engineers rely on BIM software for designing and coordinating intricate systems. BIM software integration with ERP systems streamlines project management and data sharing. Building Information Modeling plays a crucial role in facilities management, enabling real-time monitoring and optimization of building performance. 4D BIM for construction project scheduling offers improved visualization and coordination, reducing delays and increasing efficiency.
Clash detection software for model coordination ensures potential issues are identified and resolved early in the design process. BIM software for sustainable building design is a growing trend, with an increasing number of projects adopting this approach. BIM data management solutions facilitate efficient data handling and organization. Model validation using BIM software ensures project accuracy and reduces potential errors. Adoption rates of BIM software in infrastructure projects vary significantly across regions and industries. For instance, more than 80% of new infrastructure projects in Europe are mandated to use BIM, compared to less than 50% in Asia Pacific. This disparity highlights the need for a comprehensive understanding of regional trends and market dynamics.

What are the key market drivers leading to the rise in the adoption of Building Information Modeling (BIM) Software Industry?
- The escalating demand for managing complex projects is the primary market motivator.
- The escalating need for managing resources efficiently in large-scale construction projects has led to the increasing adoption of building information modeling (BIM) solutions. These advanced technologies automate processes, enabling organizations to effectively handle project-related inquiries and maintain regular follow-ups. By integrating data from various sources, BIM software streamlines communication between teams, ensuring all stakeholders are on the same page. Moreover, BIM solutions offer numerous benefits for large-scale project management. They facilitate accurate estimating and scheduling, allowing organizations to optimize resources and minimize delays. Additionally, BIM models provide a centralized database for project information, ensuring all team members have access to up-to-date data.
- Furthermore, these solutions enable better coordination between different disciplines, reducing errors and rework. In essence, BIM software plays a crucial role in enhancing project efficiency and productivity, making it an indispensable tool for large-scale construction projects. By automating processes and providing real-time access to project information, BIM solutions empower organizations to manage resources effectively and deliver high-quality outputs.
What are the market trends shaping the Building Information Modeling (BIM) Software Industry?
- Building information modeling in the fifth dimension (5D) is set to experience significant growth. This trend is poised to shape the construction industry market.
- 5D Building Information Modeling (BIM) represents an evolution in construction project management, expanding upon the capabilities of 3D and 4D BIM. This innovation enables investors to access valuable information, including deviations from project schedules and budgets, cost and labor productivity rates, and real-time cost estimation. By integrating time, cost, and other essential dimensions, 5D BIM enhances the efficiency of cost scheduling and estimation processes.
- The development of 5G BIM solutions is expected to significantly contribute to the expansion of the global BIM software market, offering substantial benefits to stakeholders in the construction industry.
What challenges does the Building Information Modeling (BIM) Software Industry face during its growth?
- The high implementation and operating costs pose a significant challenge to the growth of the industry. This issue, which is mandatory for businesses to address, can significantly impact profitability and competitiveness within the sector.
- The market experiences continuous evolution, with various firms adopting these solutions to enhance project efficiency and accuracy. However, the high cost of BIM software poses a challenge for small architectural and engineering firms in the construction industry. These firms often work on smaller projects and cannot justify the investment in expensive BIM software packages. Despite the numerous modules and applications, the software's high cost renders most of them unnecessary for these firms.
- Consequently, SMEs in the construction sector are hesitant to invest in BIM software due to the perceived lack of return on investment. The market's ongoing development includes advancements in cloud-based solutions and subscription models, which may provide more accessible and cost-effective alternatives for SMEs.
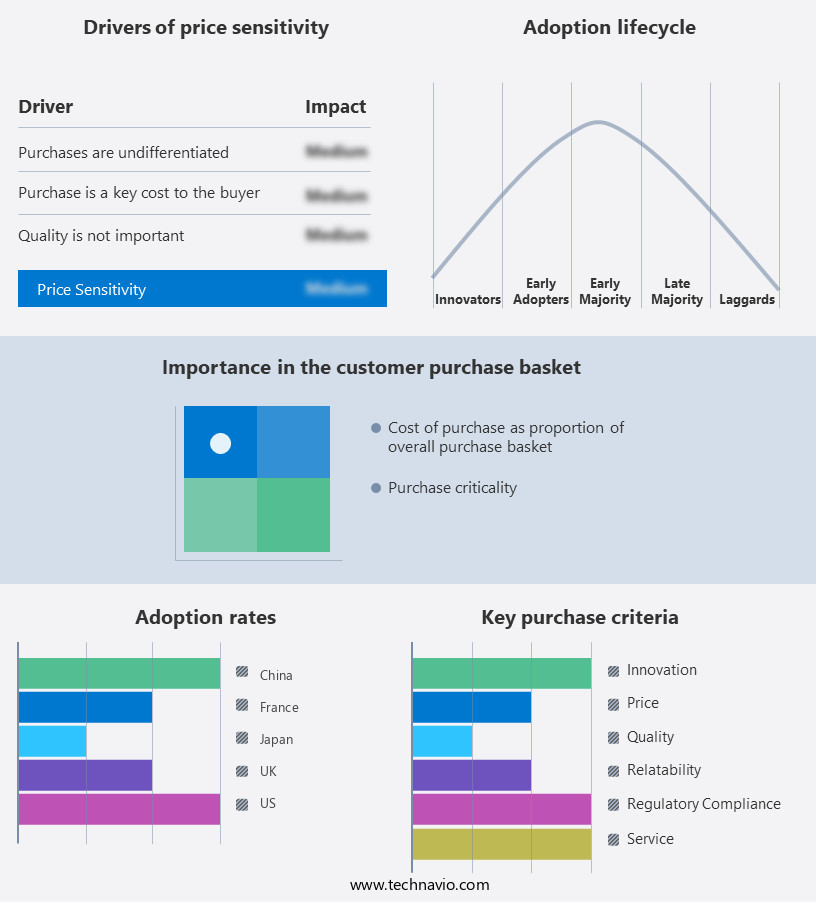
Exclusive Customer Landscape
The building information modeling (bim) software market forecasting report includes the adoption lifecycle of the market, covering from the innovator’s stage to the laggard’s stage. It focuses on adoption rates in different regions based on penetration. Furthermore, the building information modeling (bim) software market report also includes key purchase criteria and drivers of price sensitivity to help companies evaluate and develop their market growth analysis strategies.
Customer Landscape of Building Information Modeling (BIM) Software Industry
Competitive Landscape & Market Insights
Companies are implementing various strategies, such as strategic alliances, building information modeling (bim) software market forecast, partnerships, mergers and acquisitions, geographical expansion, and product/service launches, to enhance their presence in the industry.
Asite Solutions Ltd. - The company specializes in providing Building Information Modeling (BIM) software solutions, with a focus on Revit as a key offering. This software enables architects, engineers, and construction professionals to design, plan, and manage building projects more efficiently and accurately. By utilizing BIM technology, stakeholders can streamline workflows, reduce errors, and enhance collaboration throughout the project lifecycle.
The industry research and growth report includes detailed analyses of the competitive landscape of the market and information about key companies, including:
- Asite Solutions Ltd.
- Autodesk Inc.
- AVEVA Group Plc
- Bentley Systems Inc.
- Dalux Corp.
- Dassault Systemes SE
- Glodon Co. Ltd.
- Hexagon AB
- KUBUS B.V.
- MRI Software LLC
- Nemetschek SE
- Oracle Corp.
- Pinnacle Infotech Inc
- Plannerly
- Planon Group
- Procore Technologies Inc.
- Revizto SA
- thinkproject Holding GmbH
- Trimble Inc.
- Virtual Construction and Technology BIM One Inc.
Qualitative and quantitative analysis of companies has been conducted to help clients understand the wider business environment as well as the strengths and weaknesses of key industry players. Data is qualitatively analyzed to categorize companies as pure play, category-focused, industry-focused, and diversified; it is quantitatively analyzed to categorize companies as dominant, leading, strong, tentative, and weak.
Recent Development and News in Building Information Modeling (BIM) Software Market
- In January 2024, Autodesk, a leading BIM software provider, announced the launch of its new product, Autodesk BIM 360 Design, which integrates design, construction, and operations in a unified platform. This development aimed to streamline the construction process and improve collaboration among stakeholders (Autodesk Press Release).
- In March 2024, Bentley Systems and Topcon Positioning Group entered into a strategic partnership to integrate Topcon's construction layout and surveying solutions with Bentley's BIM software. This collaboration aimed to enhance the accuracy and efficiency of construction projects (Bentley Systems Press Release).
- In May 2025, Trimble acquired SketchUp, a popular 3D modeling software, for USD1.1 billion. This acquisition was expected to expand Trimble's portfolio and strengthen its position in the AEC (Architecture, Engineering, and Construction) industry (Trimble Press Release).
- In the same month, the European Union announced the adoption of the Public Procurement Directive 2014/24/EU, mandating the use of BIM for public construction projects. This regulatory approval is expected to accelerate the adoption of BIM software in Europe (European Commission Press Release).
Dive into Technavio’s robust research methodology, blending expert interviews, extensive data synthesis, and validated models for unparalleled Building Information Modeling (BIM) Software Market insights. See full methodology.
|
Market Scope |
|
|
Report Coverage |
Details |
|
Page number |
251 |
|
Base year |
2024 |
|
Historic period |
2019-2023 |
|
Forecast period |
2025-2029 |
|
Growth momentum & CAGR |
Accelerate at a CAGR of 24.8% |
|
Market growth 2025-2029 |
USD 13098.1 million |
|
Market structure |
Fragmented |
|
YoY growth 2024-2025(%) |
20.8 |
|
Key countries |
US, China, Canada, Germany, UK, Japan, France, India, Italy, and South Korea |
|
Competitive landscape |
Leading Companies, Market Positioning of Companies, Competitive Strategies, and Industry Risks |
Research Analyst Overview
- Building Information Modeling (BIM) is a dynamic and evolving market, shaped by continuous innovation and advancements in technology. Object-oriented modeling, a foundational concept in BIM, enables the creation of complex, interconnected models that accurately represent building components and their relationships. Cloud-based BIM solutions have gained significant traction, offering flexibility, accessibility, and collaboration capabilities. Clash detection software integrated into these platforms ensures efficient coordination between various design disciplines, reducing potential conflicts and rework. Mobile BIM apps allow professionals to access and review models on-site, fostering real-time communication and collaboration. BIM collaboration platforms facilitate seamless data exchange using IFC data exchange standards, enabling interoperability between different software applications.
- Mep engineering software, building performance simulation tools, and point cloud processing solutions are integral components of the BIM ecosystem. Structural analysis software and 3D modeling tools enable engineers to design and analyze building structures more effectively. BIM software integration, data interoperability, and parametric modeling are key areas of focus, ensuring efficient workflows and reducing errors. 4D BIM scheduling provides a more comprehensive understanding of project timelines, while geometric modeling and sustainable assessment tools help optimize building designs for energy efficiency and environmental impact. Quantity takeoff software, open BIM standards, and digital twin technology are shaping the future of the industry, offering new opportunities for cost estimation, facility management, and construction simulation.
- BIM standards compliance and design review software ensure adherence to industry regulations and best practices, while model checking tools help maintain model accuracy and integrity. In summary, the Building Information Modeling market is characterized by ongoing innovation, with a focus on cloud-based solutions, collaboration, and interoperability. These advancements are driving improvements in design efficiency, accuracy, and sustainability.
What are the Key Data Covered in this Building Information Modeling (BIM) Software Market Research and Growth Report?
-
What is the expected growth of the Building Information Modeling (BIM) Software Market between 2025 and 2029?
-
USD 13.1 billion, at a CAGR of 24.8%
-
-
What segmentation does the market report cover?
-
The report segmented by End-user (Architects, AEC engineering offices, Contractors, Facility managers, and Others), Deployment (On-premises and Cloud-based), Type (Construction, Pre-construction, and Post-construction), Application (Commercial, Industrial, Public infrastructure, and Residential), and Geography (North America, Europe, APAC, South America, and Middle East and Africa)
-
-
Which regions are analyzed in the report?
-
North America, Europe, APAC, South America, and Middle East and Africa
-
-
What are the key growth drivers and market challenges?
-
Increasing need for management of large-scale projects, High implementation and operating costs
-
-
Who are the major players in the Building Information Modeling (BIM) Software Market?
-
Key Companies Asite Solutions Ltd., Autodesk Inc., AVEVA Group Plc, Bentley Systems Inc., Dalux Corp., Dassault Systemes SE, Glodon Co. Ltd., Hexagon AB, KUBUS B.V., MRI Software LLC, Nemetschek SE, Oracle Corp., Pinnacle Infotech Inc, Plannerly, Planon Group, Procore Technologies Inc., Revizto SA, thinkproject Holding GmbH, Trimble Inc., and Virtual Construction and Technology BIM One Inc.
-
Market Research Insights
- The market continues to expand, driven by the increasing adoption of digital construction methods and the demand for more efficient project delivery. According to industry estimates, the global BIM market is projected to reach USD12.2 billion by 2025, growing at a compound annual growth rate of 10.5% from 2020. This growth is fueled by the integration of spatial data and data analytics into BIM software, enabling model coordination, digital construction, and model validation. Software licensing and maintenance management also contribute significantly to the market's growth. However, data privacy concerns and the need for BIM security are emerging challenges.
- Despite these challenges, BIM software pricing remains competitive, with consulting services, API integration, and plugin development offering additional value to clients. The market also encompasses various use cases, including construction management software, asset management, lifecycle cost analysis, and construction lifecycle management. BIM software implementation requires careful planning and workflows optimization, but offers substantial benefits in terms of project collaboration and model authoring.
We can help! Our analysts can customize this building information modeling (bim) software market research report to meet your requirements.