Business Intelligence (BI) Market Analysis, Size, and Forecast 2026-2030: North America (US, Canada, and Mexico), APAC (China, Japan, and India), Europe (Germany, UK, and France), Middle East and Africa (Saudi Arabia, UAE, and South Africa), South America (Brazil, Argentina, and Colombia), and Rest of World (ROW)

Business Intelligence (BI) Market Analysis, Size, and Forecast 2026-2030:
North America (US, Canada, and Mexico), APAC (China, Japan, and India), Europe (Germany, UK, and France), Middle East and Africa (Saudi Arabia, UAE, and South Africa), South America (Brazil, Argentina, and Colombia), and Rest of World (ROW)

Published: Apr 2026 305 Pages SKU: IRTNTR74439

Market Overview at a Glance

$19.31 B
Market Opportunity
10.4%
CAGR 2025 - 2030
33.5%
North America Growth
$12.62 B
BFSI segment 2024

Business Intelligence (BI) Market Size 2026-2030

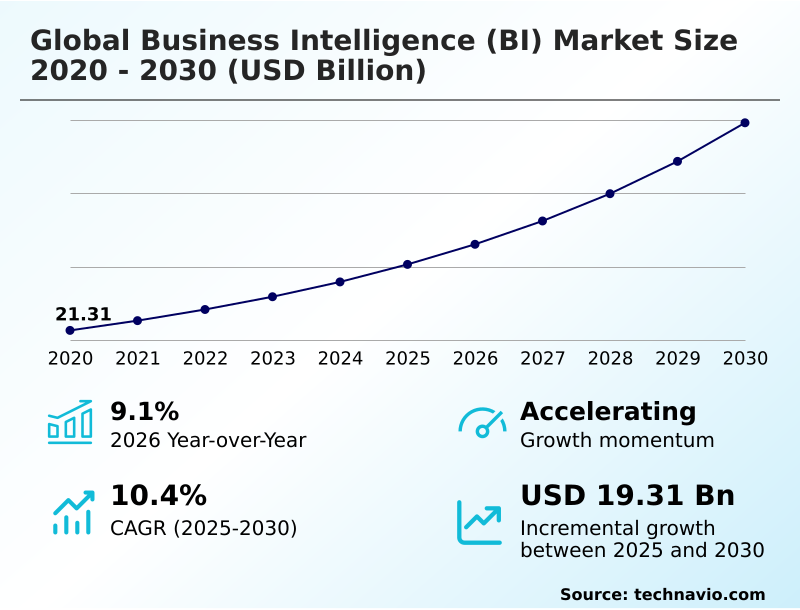
The business intelligence (bi) market size is valued to increase by USD 19.31 billion, at a CAGR of 10.4% from 2025 to 2030. Integration of generative AI and agentic workflows will drive the business intelligence (bi) market.

Major Market Trends & Insights

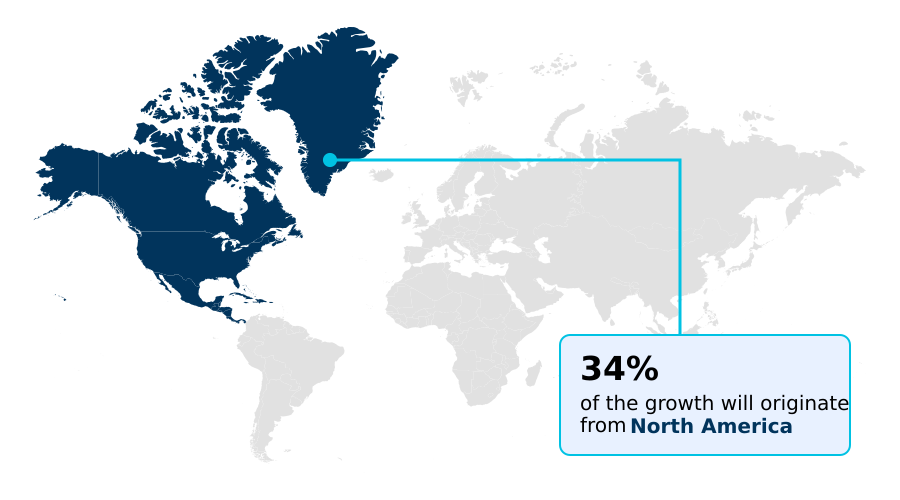
  • North America dominated the market and accounted for a 33.5% growth during the forecast period.
  • By End-user - BFSI segment was valued at USD 12.62 billion in 2024
  • By Deployment - Cloud segment accounted for the largest market revenue share in 2024

Market Size & Forecast

  • Market Opportunities: USD 28.30 billion
  • Market Future Opportunities: USD 19.31 billion
  • CAGR from 2025 to 2030 : 10.4%

Market Summary

  • The business intelligence (bi) market is undergoing a significant transformation, moving beyond static reporting to dynamic, AI-driven ecosystems. This evolution is defined by the integration of agentic analytics and autonomous reasoning, enabling platforms to provide proactive insights rather than reactive data visualizations.
  • Key drivers include the demand for real-time data connectivity and the infusion of generative AI into conversational interfaces, which democratizes data analysis for non-technical users.
  • For instance, in supply chain management, a translytical task flow allows a manager to query inventory levels using natural language, receive an AI-generated summary identifying a potential stockout, and authorize a replenishment order directly from the dashboard. This seamless integration of analysis and action is becoming the new standard.
  • However, the market faces challenges related to data sovereignty across multi-cloud environments and ensuring semantic inconsistency does not undermine trust. Successful adoption hinges on establishing a robust business data fabric that guarantees data quality and governance, turning a unified analytics platform into a truly strategic asset for enterprise-wide decision-making and operational efficiency.

What will be the Size of the Business Intelligence (BI) Market during the forecast period?

Get Key Insights on Market Forecast (PDF) Request Free Sample

How is the Business Intelligence (BI) Market Segmented?

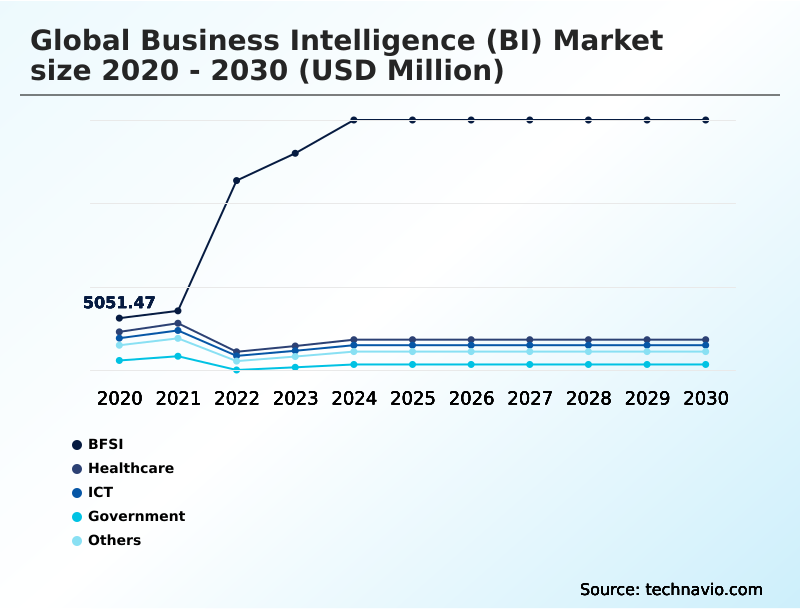
The business intelligence (bi) industry research report provides comprehensive data (region-wise segment analysis), with forecasts and estimates in "USD million" for the period 2026-2030, as well as historical data from 2020-2024 for the following segments.

  • End-user
    • BFSI
    • Healthcare
    • ICT
    • Government
    • Others
  • Deployment
    • Cloud
    • On-premises
  • Type
    • Traditional BI
    • Cloud BI
    • Mobile BI
    • Social BI
  • Geography
    • North America
      • US
      • Canada
      • Mexico
    • APAC
      • China
      • Japan
      • India
    • Europe
      • Germany
      • UK
      • France
    • Middle East and Africa
      • Saudi Arabia
      • UAE
      • South Africa
    • South America
      • Brazil
      • Argentina
      • Colombia
    • Rest of World (ROW)

By End-user Insights

The bfsi segment is estimated to witness significant growth during the forecast period.

The BFSI segment's use of business intelligence (BI) is shifting toward proactive risk management and hyper-personalized financial products.

Financial institutions now utilize advanced analytics to navigate complex regulatory environments, with some achieving a 40% reduction in compliance reporting times through automated data lineage tracking.

The adoption of a robust business data fabric, supported by data fabric architectures, enables the analysis of unstructured collaborative information for sentiment analysis on investment products.

Firms are implementing retrieval augmented generation for customer service bots and using embedded analytics within mobile banking apps.

While traditional BI remains crucial for standardized reporting, hybrid-cloud strategies are becoming common, balancing the security of on-premises data with the scalability of automated machine learning models in the cloud.

This dual approach supports both long-term on-premises support for legacy systems and agile development.

Request Free Sample

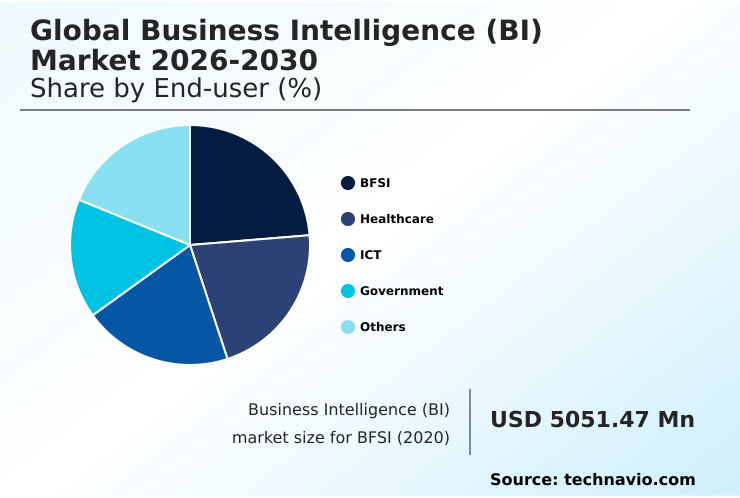
The BFSI segment was valued at USD 12.62 billion in 2024 and showed a gradual increase during the forecast period.

Request Free Sample

Regional Analysis

North America is estimated to contribute 33.5% to the growth of the global market during the forecast period.Technavio’s analysts have elaborately explained the regional trends and drivers that shape the market during the forecast period.

See How Business Intelligence (BI) Market Demand is Rising in North America Request Free Sample

The geographic landscape of the business intelligence (BI) market is led by North America, which accounts for 33.5% of the incremental growth, driven by mature adoption of cloud-native analytics.

Enterprises in this region are pioneering direct-lake data processing to eliminate data duplication. In contrast, the APAC market is characterized by rapid adoption of mobile-first analytics, where the integration of mobile BI is critical.

European firms prioritize data sovereignty and compliance, driving demand for solutions with strong governance.

Across regions, specific tools are gaining traction; geospatial point maps and sankey charts are being used to visualize complex supply chains, while translytical task flows are enabling operational actions directly from dashboards.

In retail, the omniconsumer model is optimized through real-time stock alignment analytics. Furthermore, smart city initiatives are leveraging ambient sensing and edge computing to process data locally, enhancing urban management efficiency.

Market Dynamics

Our researchers analyzed the data with 2025 as the base year, along with the key drivers, trends, and challenges. A holistic analysis of drivers will help companies refine their marketing strategies to gain a competitive advantage.

  • The business intelligence (BI) market is rapidly advancing beyond standard reporting, with specialized applications driving significant value across industries. In logistics, generative AI for logistics route optimization is delivering efficiency gains more than double that of legacy planning systems. For technology firms, real-time analytics for network optimization is critical for managing 5G network performance and customer experience.
  • The healthcare sector is leveraging prescriptive analytics for patient outcome prediction, enabling proactive clinical interventions. In finance, open finance analytics for customer segmentation is reshaping product development, while continuous intelligence for dynamic risk modeling enhances portfolio stability.
  • Platform modernization is also key; enterprise-grade on-premises analytics modernization ensures stability for regulated industries, while AI-assisted low-code business intelligence development accelerates custom application deployment. Security is being hardened through secure OAuth-based authentication for legacy integration, and governance is being standardized with rule-based semantic model authoring for governance.
  • Advanced visualization techniques, like geospatial point map visualization for supply chains, are becoming standard. Key platform capabilities now include automated discovery tools for data fabric, AI agents with retrieval augmented generation, and automated observability for IT operations risk, creating a more intelligent and resilient analytics ecosystem.
  • The integration of BI metrics into Google Workspace and the use of social BI sentiment analysis for brand reputation further extend the reach of data-driven insights.

What are the key market drivers leading to the rise in the adoption of Business Intelligence (BI) Industry?

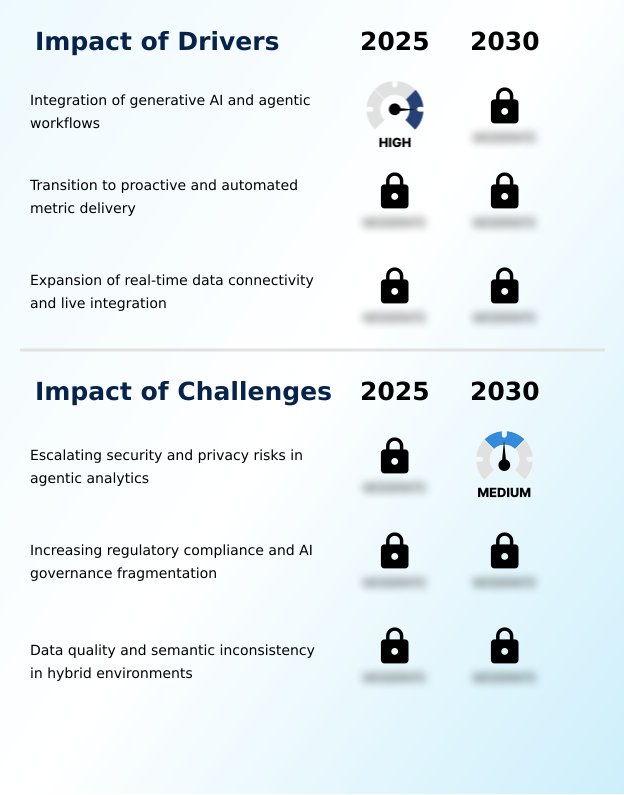
  • The primary market driver is the integration of generative AI and agentic workflows, transforming traditional dashboards into interactive, conversational analysis platforms.

  • Growth in the business intelligence (BI) market is primarily driven by the integration of advanced AI capabilities and the demand for real-time analysis.
  • The development of sophisticated semantic models is enabling more accurate conversational reporting, allowing organizations to achieve a single source of truth. This shift improves operational efficiency by over 25% in data-intensive departments.
  • The demand for real-time data connectivity with live data sources is fueling the adoption of the business data fabric, which simplifies data management and enhances data quality management.
  • This architecture supports translytical task flows and continuous intelligence, allowing for immediate action on insights. Automated metric delivery and the use of automated discovery tools ensure that relevant information is pushed to users proactively.
  • Together, these drivers are pushing the industry toward a more agile and responsive unified analytics platform that serves the entire organization.

What are the market trends shaping the Business Intelligence (BI) Industry?

  • The market is evolving toward agentic analytics and autonomous reasoning, where intelligent systems transition from presenting data to proactively solving complex business problems.

  • Key trends in the business intelligence (BI) market are centered on automation and accessibility, fundamentally changing how organizations interact with data. The evolution toward agentic analytics and autonomous reasoning is enabling platforms to perform multi-step workflows, moving beyond simple data presentation to proactive problem-solving.
  • This is complemented by the push for pervasive and embedded insights, where conversational interfaces allow users to query data using natural language narratives. Such innovations have been shown to reduce ad-hoc reporting requests by up to 60%.
  • The institutionalized data trust is being established through automated data governance and the introduction of a data product trust score, which provides clear data lineage. Conversational analytics, supported by automated data stewardship, ensures that insights are not only accessible but also reliable, fostering a culture of data-driven decision-making across the enterprise.

What challenges does the Business Intelligence (BI) Industry face during its growth?

  • A key market challenge is the escalation of security and privacy risks associated with agentic analytics, which expands the potential for unauthorized data exposure.

  • The primary challenges in the business intelligence (BI) market revolve around security, governance, and data quality. The rise of secure agentic systems introduces new vulnerabilities, necessitating stronger security protocols like OAuth-based authentication. Navigating AI governance fragmentation is a significant hurdle, as non-compliance with varying international transparency and accountability standards can result in penalties of up to 4% of global revenue.
  • Ensuring data quality across multi-cloud environments is complicated by semantic inconsistency and data drift, which can undermine user trust. Addressing data sovereignty and data residency requirements adds further complexity.
  • Organizations are adopting cloud BI, social BI, and other tools, but must first implement automated anomaly detection and robust governance to ensure the reliability of insights derived from these platforms, thus preventing flawed decision-making.

Exclusive Technavio Analysis on Customer Landscape

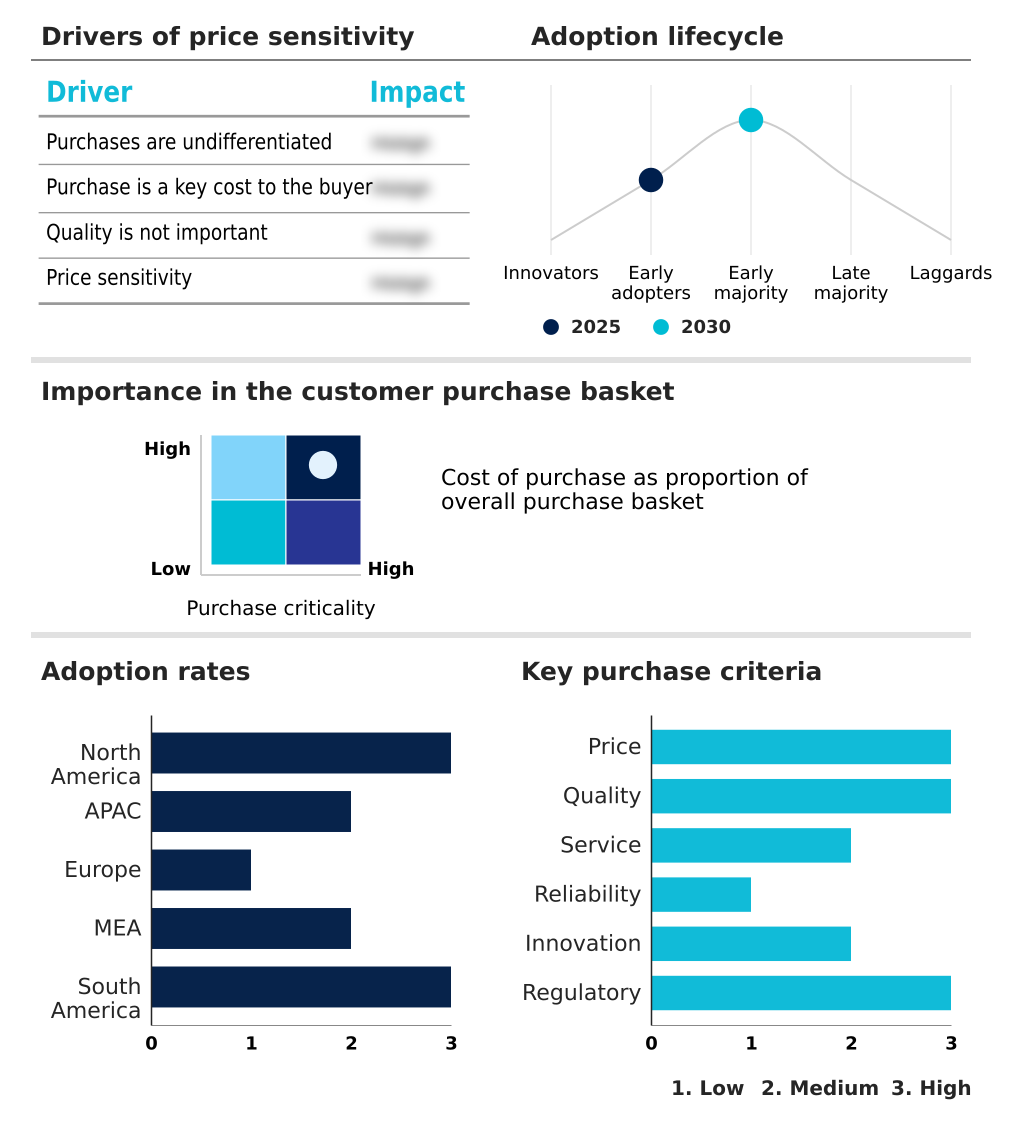
The business intelligence (bi) market forecasting report includes the adoption lifecycle of the market, covering from the innovator’s stage to the laggard’s stage. It focuses on adoption rates in different regions based on penetration. Furthermore, the business intelligence (bi) market report also includes key purchase criteria and drivers of price sensitivity to help companies evaluate and develop their market growth analysis strategies.

Customer Landscape of Business Intelligence (BI) Industry

Competitive Landscape

Companies are implementing various strategies, such as strategic alliances, business intelligence (bi) market forecast, partnerships, mergers and acquisitions, geographical expansion, and product/service launches, to enhance their presence in the industry.

Alteryx Inc. - Offerings include interactive dashboards, business reporting, and data visualization across large-scale cloud datasets, delivered via a highly reliable, scalable, and low-cost infrastructure platform.

The industry research and growth report includes detailed analyses of the competitive landscape of the market and information about key companies, including:

  • Alteryx Inc.
  • Amazon Web Services Inc.
  • Domo Inc.
  • GoodData Corp.
  • Google LLC
  • IBM Corp.
  • Idera Inc.
  • Infor Inc.
  • Microsoft Corp.
  • Oracle Corp.
  • QlikTech International AB
  • Salesforce Inc.
  • SAP SE
  • SAS Institute Inc.
  • Sisense Ltd.
  • Teradata Corp.
  • ThoughtSpot Inc.
  • TIBCO Software Inc.
  • Zoho Corp. Pvt. Ltd.

Qualitative and quantitative analysis of companies has been conducted to help clients understand the wider business environment as well as the strengths and weaknesses of key industry players. Data is qualitatively analyzed to categorize companies as pure play, category-focused, industry-focused, and diversified; it is quantitatively analyzed to categorize companies as dominant, leading, strong, tentative, and weak.

Recent Development and News in Business intelligence (bi) market

  • In March, 2025, Salesforce Inc. launched Tableau 2025.2, integrating Tableau Pulse metrics directly into Google Workspace applications to embed data-driven insights within daily productivity tools.
  • In April, 2025, Databricks Ventures made a strategic investment in Omni to enhance integration with the Databricks Data Intelligence Platform, improving analytics performance on data lakehouses for ICT firms.
  • In November, 2025, IBM Corp. announced the general availability of IBM Cognos Analytics 12.1.x, providing enterprise-grade stability and advanced reporting for organizations requiring long-term on-premises support.
  • In December, 2025, Salesforce Inc. announced the Tableau 2026 release, which featured the full integration of Tableau Pulse into the mobile experience to deliver personalized metrics and automated insights to mobile devices.

Dive into Technavio’s robust research methodology, blending expert interviews, extensive data synthesis, and validated models for unparalleled Business Intelligence (BI) Market insights. See full methodology.

Market Scope
Page number 305
Base year 2025
Historic period 2020-2024
Forecast period 2026-2030
Growth momentum & CAGR Accelerate at a CAGR of 10.4%
Market growth 2026-2030 USD 19312.7 million
Market structure Fragmented
YoY growth 2025-2026(%) 9.1%
Key countries US, Canada, Mexico, China, Japan, India, Australia, South Korea, Indonesia, Germany, UK, France, Italy, Spain, The Netherlands, Saudi Arabia, UAE, South Africa, Qatar, Egypt, Brazil, Argentina and Colombia
Competitive landscape Leading Companies, Market Positioning of Companies, Competitive Strategies, and Industry Risks

Request Free Sample

Research Analyst Overview

  • The business intelligence (BI) market is defined by a fundamental shift toward automated, predictive ecosystems built on a unified analytics platform. The integration of agentic analytics with conversational interfaces, powered by retrieval augmented generation, is making sophisticated analysis accessible to non-technical users.
  • This trend is underpinned by the move to a comprehensive business data fabric, a key boardroom topic as it directly impacts enterprise-wide risk posture and has been shown to reduce data processing times by over 30%.
  • Core technologies like direct-lake data processing and advanced semantic models are enabling translytical task flows where users can act on insights within a single environment. The market is also seeing broader adoption of cloud BI, mobile BI, and social BI, supported by robust data fabric architectures that handle real-time data connectivity from live data sources.
  • Governance is evolving with automated data stewardship and features like the data product trust score, ensuring transparency and accountability standards are met across multi-cloud environments while managing challenges like data sovereignty. From predictive maintenance in manufacturing to real-time stock alignment in retail, BI is becoming an active participant in operational execution.

What are the Key Data Covered in this Business Intelligence (BI) Market Research and Growth Report?

  • What is the expected growth of the Business Intelligence (BI) Market between 2026 and 2030?

    • USD 19.31 billion, at a CAGR of 10.4%

  • What segmentation does the market report cover?

    • The report is segmented by End-user (BFSI, Healthcare, ICT, Government, and Others), Deployment (Cloud, and On-premises), Type (Traditional BI, Cloud BI, Mobile BI, and Social BI) and Geography (North America, APAC, Europe, Middle East and Africa, South America)

  • Which regions are analyzed in the report?

    • North America, APAC, Europe, Middle East and Africa and South America

  • What are the key growth drivers and market challenges?

    • Integration of generative AI and agentic workflows, Escalating security and privacy risks in agentic analytics

  • Who are the major players in the Business Intelligence (BI) Market?

    • Alteryx Inc., Amazon Web Services Inc., Domo Inc., GoodData Corp., Google LLC, IBM Corp., Idera Inc., Infor Inc., Microsoft Corp., Oracle Corp., QlikTech International AB, Salesforce Inc., SAP SE, SAS Institute Inc., Sisense Ltd., Teradata Corp., ThoughtSpot Inc., TIBCO Software Inc. and Zoho Corp. Pvt. Ltd.

Market Research Insights

  • The business intelligence (BI) market's dynamics are shaped by a strategic shift toward proactive and automated intelligence. Organizations leveraging proactive metric delivery have seen critical issue response times improve by up to 50%, a direct result of moving away from manual dashboard monitoring.
  • The implementation of institutionalized data trust through automated data governance is critical, with early adopters reporting a 30% reduction in data-related errors and enhanced compliance. Real-time data integration capabilities are no longer optional; they are essential for maintaining a competitive edge.
  • The focus is on creating a single source of truth through better data quality management, which underpins all advanced analytical functions. This push towards pervasive and embedded insights ensures that decision-making is data-informed at every level of an organization, fostering a more agile and responsive operational model.

We can help! Our analysts can customize this business intelligence (bi) market research report to meet your requirements.

Get in touch

1. Executive Summary

1.1 Market overview

Executive Summary - Chart on Market Overview
Executive Summary - Data Table on Market Overview
Executive Summary - Chart on Global Market Characteristics
Executive Summary - Chart on Market by Geography
Executive Summary - Chart on Market Segmentation by End-user
Executive Summary - Chart on Market Segmentation by Deployment
Executive Summary - Chart on Market Segmentation by Type
Executive Summary - Chart on Incremental Growth
Executive Summary - Data Table on Incremental Growth
Executive Summary - Chart on Company Market Positioning

2. Technavio Analysis

2.1 Analysis of price sensitivity, lifecycle, customer purchase basket, adoption rates, and purchase criteria

2.2 Criticality of inputs and Factors of differentiation

Chart on Overview on criticality of inputs and factors of differentiation

2.3 Factors of disruption

Chart on Overview on factors of disruption

2.4 Impact of drivers and challenges

Chart on Impact of drivers and challenges in 2025 and 2030

3. Market Landscape

3.1 Market ecosystem

Chart on Parent Market
Data Table on - Parent Market

3.2 Market characteristics

Chart on Market characteristics analysis

3.3 Value chain analysis

Chart on Value chain analysis

4. Market Sizing

4.1 Market definition

Data Table on Offerings of companies included in the market definition

4.2 Market segment analysis

Market segments

4.3 Market size 2025

4.4 Market outlook: Forecast for 2025-2030

Chart on Global - Market size and forecast 2025-2030 ($ million)
Data Table on Global - Market size and forecast 2025-2030 ($ million)
Chart on Global Market: Year-over-year growth 2025-2030 (%)
Data Table on Global Market: Year-over-year growth 2025-2030 (%)

5. Historic Market Size

5.1 Global Business Intelligence (BI) Market 2020 - 2024

Historic Market Size - Data Table on Global Business Intelligence (BI) Market 2020 - 2024 ($ million)

5.2 End-user segment analysis 2020 - 2024

Historic Market Size - End-user Segment 2020 - 2024 ($ million)

5.3 Deployment segment analysis 2020 - 2024

Historic Market Size - Deployment Segment 2020 - 2024 ($ million)

5.4 Type segment analysis 2020 - 2024

Historic Market Size - Type Segment 2020 - 2024 ($ million)

5.5 Geography segment analysis 2020 - 2024

Historic Market Size - Geography Segment 2020 - 2024 ($ million)

5.6 Country segment analysis 2020 - 2024

Historic Market Size - Country Segment 2020 - 2024 ($ million)

6. Qualitative Analysis

6.1 Impact of AI on Global Business Intelligence (BI) Market

6.2 Impact of Geopolitical Conflict on Global Business Intelligence (BI) Market

7. Five Forces Analysis

7.1 Five forces summary

Five forces analysis - Comparison between 2025 and 2030

7.2 Bargaining power of buyers

Bargaining power of buyers - Impact of key factors 2025 and 2030

7.3 Bargaining power of suppliers

Bargaining power of suppliers - Impact of key factors in 2025 and 2030

7.4 Threat of new entrants

Threat of new entrants - Impact of key factors in 2025 and 2030

7.5 Threat of substitutes

Threat of substitutes - Impact of key factors in 2025 and 2030

7.6 Threat of rivalry

Threat of rivalry - Impact of key factors in 2025 and 2030

7.7 Market condition

Chart on Market condition - Five forces 2025 and 2030

8. Market Segmentation by End-user

8.1 Market segments

Chart on End-user - Market share 2025-2030 (%)
Data Table on End-user - Market share 2025-2030 (%)

8.2 Comparison by End-user

Chart on Comparison by End-user
Data Table on Comparison by End-user

8.3 BFSI - Market size and forecast 2025-2030

Chart on BFSI - Market size and forecast 2025-2030 ($ million)
Data Table on BFSI - Market size and forecast 2025-2030 ($ million)
Chart on BFSI - Year-over-year growth 2025-2030 (%)
Data Table on BFSI - Year-over-year growth 2025-2030 (%)

8.4 Healthcare - Market size and forecast 2025-2030

Chart on Healthcare - Market size and forecast 2025-2030 ($ million)
Data Table on Healthcare - Market size and forecast 2025-2030 ($ million)
Chart on Healthcare - Year-over-year growth 2025-2030 (%)
Data Table on Healthcare - Year-over-year growth 2025-2030 (%)

8.5 ICT - Market size and forecast 2025-2030

Chart on ICT - Market size and forecast 2025-2030 ($ million)
Data Table on ICT - Market size and forecast 2025-2030 ($ million)
Chart on ICT - Year-over-year growth 2025-2030 (%)
Data Table on ICT - Year-over-year growth 2025-2030 (%)

8.6 Government - Market size and forecast 2025-2030

Chart on Government - Market size and forecast 2025-2030 ($ million)
Data Table on Government - Market size and forecast 2025-2030 ($ million)
Chart on Government - Year-over-year growth 2025-2030 (%)
Data Table on Government - Year-over-year growth 2025-2030 (%)

8.7 Others - Market size and forecast 2025-2030

Chart on Others - Market size and forecast 2025-2030 ($ million)
Data Table on Others - Market size and forecast 2025-2030 ($ million)
Chart on Others - Year-over-year growth 2025-2030 (%)
Data Table on Others - Year-over-year growth 2025-2030 (%)

8.8 Market opportunity by End-user

Market opportunity by End-user ($ million)
Data Table on Market opportunity by End-user ($ million)

9. Market Segmentation by Deployment

9.1 Market segments

Chart on Deployment - Market share 2025-2030 (%)
Data Table on Deployment - Market share 2025-2030 (%)

9.2 Comparison by Deployment

Chart on Comparison by Deployment
Data Table on Comparison by Deployment

9.3 Cloud - Market size and forecast 2025-2030

Chart on Cloud - Market size and forecast 2025-2030 ($ million)
Data Table on Cloud - Market size and forecast 2025-2030 ($ million)
Chart on Cloud - Year-over-year growth 2025-2030 (%)
Data Table on Cloud - Year-over-year growth 2025-2030 (%)

9.4 On-premises - Market size and forecast 2025-2030

Chart on On-premises - Market size and forecast 2025-2030 ($ million)
Data Table on On-premises - Market size and forecast 2025-2030 ($ million)
Chart on On-premises - Year-over-year growth 2025-2030 (%)
Data Table on On-premises - Year-over-year growth 2025-2030 (%)

9.5 Market opportunity by Deployment

Market opportunity by Deployment ($ million)
Data Table on Market opportunity by Deployment ($ million)

10. Market Segmentation by Type

10.1 Market segments

Chart on Type - Market share 2025-2030 (%)
Data Table on Type - Market share 2025-2030 (%)

10.2 Comparison by Type

Chart on Comparison by Type
Data Table on Comparison by Type

10.3 Traditional BI - Market size and forecast 2025-2030

Chart on Traditional BI - Market size and forecast 2025-2030 ($ million)
Data Table on Traditional BI - Market size and forecast 2025-2030 ($ million)
Chart on Traditional BI - Year-over-year growth 2025-2030 (%)
Data Table on Traditional BI - Year-over-year growth 2025-2030 (%)

10.4 Cloud BI - Market size and forecast 2025-2030

Chart on Cloud BI - Market size and forecast 2025-2030 ($ million)
Data Table on Cloud BI - Market size and forecast 2025-2030 ($ million)
Chart on Cloud BI - Year-over-year growth 2025-2030 (%)
Data Table on Cloud BI - Year-over-year growth 2025-2030 (%)

10.5 Mobile BI - Market size and forecast 2025-2030

Chart on Mobile BI - Market size and forecast 2025-2030 ($ million)
Data Table on Mobile BI - Market size and forecast 2025-2030 ($ million)
Chart on Mobile BI - Year-over-year growth 2025-2030 (%)
Data Table on Mobile BI - Year-over-year growth 2025-2030 (%)

10.6 Social BI - Market size and forecast 2025-2030

Chart on Social BI - Market size and forecast 2025-2030 ($ million)
Data Table on Social BI - Market size and forecast 2025-2030 ($ million)
Chart on Social BI - Year-over-year growth 2025-2030 (%)
Data Table on Social BI - Year-over-year growth 2025-2030 (%)

10.7 Market opportunity by Type

Market opportunity by Type ($ million)
Data Table on Market opportunity by Type ($ million)

11. Customer Landscape

11.1 Customer landscape overview

Analysis of price sensitivity, lifecycle, customer purchase basket, adoption rates, and purchase criteria

12. Geographic Landscape

12.1 Geographic segmentation

Chart on Market share by geography 2025-2030 (%)
Data Table on Market share by geography 2025-2030 (%)

12.2 Geographic comparison

Chart on Geographic comparison
Data Table on Geographic comparison

12.3 North America - Market size and forecast 2025-2030

Chart on North America - Market size and forecast 2025-2030 ($ million)
Data Table on North America - Market size and forecast 2025-2030 ($ million)
Chart on North America - Year-over-year growth 2025-2030 (%)
Data Table on North America - Year-over-year growth 2025-2030 (%)
Chart on Regional Comparison - North America
Data Table on Regional Comparison - North America

12.3.1 US - Market size and forecast 2025-2030

Chart on US - Market size and forecast 2025-2030 ($ million)
Data Table on US - Market size and forecast 2025-2030 ($ million)
Chart on US - Year-over-year growth 2025-2030 (%)
Data Table on US - Year-over-year growth 2025-2030 (%)

12.3.2 Canada - Market size and forecast 2025-2030

Chart on Canada - Market size and forecast 2025-2030 ($ million)
Data Table on Canada - Market size and forecast 2025-2030 ($ million)
Chart on Canada - Year-over-year growth 2025-2030 (%)
Data Table on Canada - Year-over-year growth 2025-2030 (%)

12.3.3 Mexico - Market size and forecast 2025-2030

Chart on Mexico - Market size and forecast 2025-2030 ($ million)
Data Table on Mexico - Market size and forecast 2025-2030 ($ million)
Chart on Mexico - Year-over-year growth 2025-2030 (%)
Data Table on Mexico - Year-over-year growth 2025-2030 (%)

12.4 APAC - Market size and forecast 2025-2030

Chart on APAC - Market size and forecast 2025-2030 ($ million)
Data Table on APAC - Market size and forecast 2025-2030 ($ million)
Chart on APAC - Year-over-year growth 2025-2030 (%)
Data Table on APAC - Year-over-year growth 2025-2030 (%)
Chart on Regional Comparison - APAC
Data Table on Regional Comparison - APAC

12.4.1 China - Market size and forecast 2025-2030

Chart on China - Market size and forecast 2025-2030 ($ million)
Data Table on China - Market size and forecast 2025-2030 ($ million)
Chart on China - Year-over-year growth 2025-2030 (%)
Data Table on China - Year-over-year growth 2025-2030 (%)

12.4.2 Japan - Market size and forecast 2025-2030

Chart on Japan - Market size and forecast 2025-2030 ($ million)
Data Table on Japan - Market size and forecast 2025-2030 ($ million)
Chart on Japan - Year-over-year growth 2025-2030 (%)
Data Table on Japan - Year-over-year growth 2025-2030 (%)

12.4.3 India - Market size and forecast 2025-2030

Chart on India - Market size and forecast 2025-2030 ($ million)
Data Table on India - Market size and forecast 2025-2030 ($ million)
Chart on India - Year-over-year growth 2025-2030 (%)
Data Table on India - Year-over-year growth 2025-2030 (%)

12.4.4 Australia - Market size and forecast 2025-2030

Chart on Australia - Market size and forecast 2025-2030 ($ million)
Data Table on Australia - Market size and forecast 2025-2030 ($ million)
Chart on Australia - Year-over-year growth 2025-2030 (%)
Data Table on Australia - Year-over-year growth 2025-2030 (%)

12.4.5 South Korea - Market size and forecast 2025-2030

Chart on South Korea - Market size and forecast 2025-2030 ($ million)
Data Table on South Korea - Market size and forecast 2025-2030 ($ million)
Chart on South Korea - Year-over-year growth 2025-2030 (%)
Data Table on South Korea - Year-over-year growth 2025-2030 (%)

12.4.6 Indonesia - Market size and forecast 2025-2030

Chart on Indonesia - Market size and forecast 2025-2030 ($ million)
Data Table on Indonesia - Market size and forecast 2025-2030 ($ million)
Chart on Indonesia - Year-over-year growth 2025-2030 (%)
Data Table on Indonesia - Year-over-year growth 2025-2030 (%)

12.5 Europe - Market size and forecast 2025-2030

Chart on Europe - Market size and forecast 2025-2030 ($ million)
Data Table on Europe - Market size and forecast 2025-2030 ($ million)
Chart on Europe - Year-over-year growth 2025-2030 (%)
Data Table on Europe - Year-over-year growth 2025-2030 (%)
Chart on Regional Comparison - Europe
Data Table on Regional Comparison - Europe

12.5.1 Germany - Market size and forecast 2025-2030

Chart on Germany - Market size and forecast 2025-2030 ($ million)
Data Table on Germany - Market size and forecast 2025-2030 ($ million)
Chart on Germany - Year-over-year growth 2025-2030 (%)
Data Table on Germany - Year-over-year growth 2025-2030 (%)

12.5.2 UK - Market size and forecast 2025-2030

Chart on UK - Market size and forecast 2025-2030 ($ million)
Data Table on UK - Market size and forecast 2025-2030 ($ million)
Chart on UK - Year-over-year growth 2025-2030 (%)
Data Table on UK - Year-over-year growth 2025-2030 (%)

12.5.3 France - Market size and forecast 2025-2030

Chart on France - Market size and forecast 2025-2030 ($ million)
Data Table on France - Market size and forecast 2025-2030 ($ million)
Chart on France - Year-over-year growth 2025-2030 (%)
Data Table on France - Year-over-year growth 2025-2030 (%)

12.5.4 Italy - Market size and forecast 2025-2030

Chart on Italy - Market size and forecast 2025-2030 ($ million)
Data Table on Italy - Market size and forecast 2025-2030 ($ million)
Chart on Italy - Year-over-year growth 2025-2030 (%)
Data Table on Italy - Year-over-year growth 2025-2030 (%)

12.5.5 Spain - Market size and forecast 2025-2030

Chart on Spain - Market size and forecast 2025-2030 ($ million)
Data Table on Spain - Market size and forecast 2025-2030 ($ million)
Chart on Spain - Year-over-year growth 2025-2030 (%)
Data Table on Spain - Year-over-year growth 2025-2030 (%)

12.5.6 The Netherlands - Market size and forecast 2025-2030

Chart on The Netherlands - Market size and forecast 2025-2030 ($ million)
Data Table on The Netherlands - Market size and forecast 2025-2030 ($ million)
Chart on The Netherlands - Year-over-year growth 2025-2030 (%)
Data Table on The Netherlands - Year-over-year growth 2025-2030 (%)

12.6 Middle East and Africa - Market size and forecast 2025-2030

Chart on Middle East and Africa - Market size and forecast 2025-2030 ($ million)
Data Table on Middle East and Africa - Market size and forecast 2025-2030 ($ million)
Chart on Middle East and Africa - Year-over-year growth 2025-2030 (%)
Data Table on Middle East and Africa - Year-over-year growth 2025-2030 (%)
Chart on Regional Comparison - Middle East and Africa
Data Table on Regional Comparison - Middle East and Africa

12.6.1 Saudi Arabia - Market size and forecast 2025-2030

Chart on Saudi Arabia - Market size and forecast 2025-2030 ($ million)
Data Table on Saudi Arabia - Market size and forecast 2025-2030 ($ million)
Chart on Saudi Arabia - Year-over-year growth 2025-2030 (%)
Data Table on Saudi Arabia - Year-over-year growth 2025-2030 (%)

12.6.2 UAE - Market size and forecast 2025-2030

Chart on UAE - Market size and forecast 2025-2030 ($ million)
Data Table on UAE - Market size and forecast 2025-2030 ($ million)
Chart on UAE - Year-over-year growth 2025-2030 (%)
Data Table on UAE - Year-over-year growth 2025-2030 (%)

12.6.3 South Africa - Market size and forecast 2025-2030

Chart on South Africa - Market size and forecast 2025-2030 ($ million)
Data Table on South Africa - Market size and forecast 2025-2030 ($ million)
Chart on South Africa - Year-over-year growth 2025-2030 (%)
Data Table on South Africa - Year-over-year growth 2025-2030 (%)

12.6.4 Qatar - Market size and forecast 2025-2030

Chart on Qatar - Market size and forecast 2025-2030 ($ million)
Data Table on Qatar - Market size and forecast 2025-2030 ($ million)
Chart on Qatar - Year-over-year growth 2025-2030 (%)
Data Table on Qatar - Year-over-year growth 2025-2030 (%)

12.6.5 Egypt - Market size and forecast 2025-2030

Chart on Egypt - Market size and forecast 2025-2030 ($ million)
Data Table on Egypt - Market size and forecast 2025-2030 ($ million)
Chart on Egypt - Year-over-year growth 2025-2030 (%)
Data Table on Egypt - Year-over-year growth 2025-2030 (%)

12.7 South America - Market size and forecast 2025-2030

Chart on South America - Market size and forecast 2025-2030 ($ million)
Data Table on South America - Market size and forecast 2025-2030 ($ million)
Chart on South America - Year-over-year growth 2025-2030 (%)
Data Table on South America - Year-over-year growth 2025-2030 (%)
Chart on Regional Comparison - South America
Data Table on Regional Comparison - South America

12.7.1 Brazil - Market size and forecast 2025-2030

Chart on Brazil - Market size and forecast 2025-2030 ($ million)
Data Table on Brazil - Market size and forecast 2025-2030 ($ million)
Chart on Brazil - Year-over-year growth 2025-2030 (%)
Data Table on Brazil - Year-over-year growth 2025-2030 (%)

12.7.2 Argentina - Market size and forecast 2025-2030

Chart on Argentina - Market size and forecast 2025-2030 ($ million)
Data Table on Argentina - Market size and forecast 2025-2030 ($ million)
Chart on Argentina - Year-over-year growth 2025-2030 (%)
Data Table on Argentina - Year-over-year growth 2025-2030 (%)

12.7.3 Colombia - Market size and forecast 2025-2030

Chart on Colombia - Market size and forecast 2025-2030 ($ million)
Data Table on Colombia - Market size and forecast 2025-2030 ($ million)
Chart on Colombia - Year-over-year growth 2025-2030 (%)
Data Table on Colombia - Year-over-year growth 2025-2030 (%)

12.8 Market opportunity by geography

Market opportunity by geography ($ million)
Data Tables on Market opportunity by geography ($ million)

13. Drivers, Challenges, and Opportunity

13.1 Market drivers

Integration of generative AI and agentic workflows
Transition to proactive and automated metric delivery
Expansion of real-time data connectivity and live integration

13.2 Market challenges

Escalating security and privacy risks in agentic analytics
Increasing regulatory compliance and AI governance fragmentation
Data quality and semantic inconsistency in hybrid environments

13.3 Impact of drivers and challenges

Impact of drivers and challenges in 2025 and 2030

13.4 Market opportunities

Evolution toward agentic analytics and autonomous reasoning
Democratization through pervasive and embedded insights
Institutionalization of trust and automated data governance

14. Competitive Landscape

14.1 Overview

14.2

Overview on criticality of inputs and factors of differentiation

14.3 Landscape disruption

Overview on factors of disruption

14.4 Industry risks

Impact of key risks on business

15. Competitive Analysis

15.1 Companies profiled

Companies covered

15.2 Company ranking index

15.3 Market positioning of companies

Matrix on companies position and classification

15.4 Amazon Web Services Inc.

Amazon Web Services Inc. - Overview
Amazon Web Services Inc. - Product / Service
Amazon Web Services Inc. - Key offerings
SWOT

15.5 Domo Inc.

Domo Inc. - Overview
Domo Inc. - Product / Service
Domo Inc. - Key offerings
SWOT

15.6 GoodData Corp.

GoodData Corp. - Overview
GoodData Corp. - Product / Service
GoodData Corp. - Key offerings
SWOT

15.7 Google LLC

Google LLC - Overview
Google LLC - Product / Service
Google LLC - Key offerings
SWOT

15.8 IBM Corp.

IBM Corp. - Overview
IBM Corp. - Business segments
IBM Corp. - Key news
IBM Corp. - Key offerings
IBM Corp. - Segment focus
SWOT

15.9 Infor Inc.

Infor Inc. - Overview
Infor Inc. - Product / Service
Infor Inc. - Key offerings
SWOT

15.10 Microsoft Corp.

Microsoft Corp. - Overview
Microsoft Corp. - Business segments
Microsoft Corp. - Key news
Microsoft Corp. - Key offerings
Microsoft Corp. - Segment focus
SWOT

15.11 Oracle Corp.

Oracle Corp. - Overview
Oracle Corp. - Business segments
Oracle Corp. - Key news
Oracle Corp. - Key offerings
Oracle Corp. - Segment focus
SWOT

15.12 QlikTech International AB

QlikTech International AB - Overview
QlikTech International AB - Product / Service
QlikTech International AB - Key offerings
SWOT

15.13 Salesforce Inc.

Salesforce Inc. - Overview
Salesforce Inc. - Business segments
Salesforce Inc. - Key news
Salesforce Inc. - Key offerings
Salesforce Inc. - Segment focus
SWOT

15.14 SAP SE

SAP SE - Overview
SAP SE - Business segments
SAP SE - Key news
SAP SE - Key offerings
SAP SE - Segment focus
SWOT

15.15 SAS Institute Inc.

SAS Institute Inc. - Overview
SAS Institute Inc. - Product / Service
SAS Institute Inc. - Key offerings
SWOT

15.16 Teradata Corp.

Teradata Corp. - Overview
Teradata Corp. - Business segments
Teradata Corp. - Key news
Teradata Corp. - Key offerings
Teradata Corp. - Segment focus
SWOT

15.17 TIBCO Software Inc.

TIBCO Software Inc. - Overview
TIBCO Software Inc. - Product / Service
TIBCO Software Inc. - Key offerings
SWOT

15.18 Zoho Corp. Pvt. Ltd.

Zoho Corp. Pvt. Ltd. - Overview
Zoho Corp. Pvt. Ltd. - Product / Service
Zoho Corp. Pvt. Ltd. - Key offerings
SWOT

16. Appendix

16.1 Scope of the report

Market definition
Objectives
Notes and caveats

16.2 Inclusions and exclusions checklist

Inclusions checklist
Exclusions checklist

16.3 Currency conversion rates for US$

16.4 Research methodology

16.5 Data procurement

Information sources

16.6 Data validation

16.7 Validation techniques employed for market sizing

16.8 Data synthesis

16.9 360 degree market analysis

16.10 List of abbreviations

Research Methodology

Technavio presents a detailed picture of the market by way of study, synthesis, and summation of data from multiple sources. The analysts have presented the various facets of the market with a particular focus on identifying the key industry influencers. The data thus presented is comprehensive, reliable, and the result of extensive research, both primary and secondary.

INFORMATION SOURCES

Primary sources

  • Manufacturers and suppliers
  • Channel partners
  • Industry experts
  • Strategic decision makers

Secondary sources

  • Industry journals and periodicals
  • Government data
  • Financial reports of key industry players
  • Historical data
  • Press releases

DATA ANALYSIS

Data Synthesis

  • Collation of data
  • Estimation of key figures
  • Analysis of derived insights

Data Validation

  • Triangulation with data models
  • Reference against proprietary databases
  • Corroboration with industry experts

REPORT WRITING

Qualitative

  • Market drivers
  • Market challenges
  • Market trends
  • Five forces analysis

Quantitative

  • Market size and forecast
  • Market segmentation
  • Geographical insights
  • Competitive landscape

Interested in this report?

Get your sample now to see our research methodology and insights!

Download Now

Frequently Asked Questions

Business Intelligence (BI) market growth will increase by USD 19312.7 million during 2026-2030.

The Business Intelligence (BI) market is expected to grow at a CAGR of 10.4% during 2026-2030.

Business Intelligence (BI) market is segmented by End-user (BFSI, Healthcare, ICT, Government, Others) Deployment (Cloud, On-premises) Type (Traditional BI, Cloud BI, Mobile BI, Social BI)

Alteryx Inc., Amazon Web Services Inc., Domo Inc., GoodData Corp., Google LLC, IBM Corp., Idera Inc., Infor Inc., Microsoft Corp., Oracle Corp., QlikTech International AB, Salesforce Inc., SAP SE, SAS Institute Inc., Sisense Ltd., Teradata Corp., ThoughtSpot Inc., TIBCO Software Inc., Zoho Corp. Pvt. Ltd. are a few of the key vendors in the Business Intelligence (BI) market.

North America will register the highest growth rate of 33.5% among the other regions. Therefore, the Business Intelligence (BI) market in North America is expected to garner significant business opportunities for the vendors during the forecast period.

US, Canada, Mexico, China, Japan, India, Australia, South Korea, Indonesia, Germany, UK, France, Italy, Spain, The Netherlands, Saudi Arabia, UAE, South Africa, Qatar, Egypt, Brazil, Argentina, Colombia

  • Integration of generative AI and agentic workflows is the driving factor this market.

The Business Intelligence (BI) market vendors should focus on grabbing business opportunities from the End-user segment as it accounted for the largest market share in the base year.
RIA - Research AI Assistant
Ask RIA