Cable Cars Market Size 2025-2029
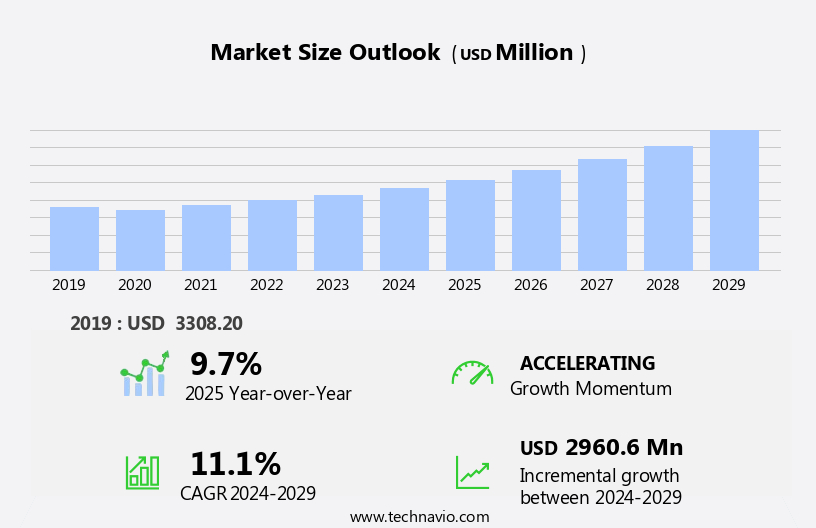
The cable cars market size is forecast to increase by USD 2.96 billion, at a CAGR of 11.1% between 2024 and 2029.
- The market is witnessing significant growth due to the expansion of the global transportation systems sector, particularly in urban areas and industrial settings. Passengers and goods transportation on challenging terrains, such as mountains and mining sites, is increasingly relying on cable cars and gondolas. The continuous loop system ensures efficient and reliable transportation, making it a popular choice in various industries. Modern cable cars are equipped with smart technologies, renewable energy sources, and eco-friendly features, such as solar and wind energy, to reduce their carbon footprint and provide sustainable transportation solutions. Product innovations, including advanced cabins and improved safety features, are also driving market growth. However, the high installation costs remain a challenge for market expansion.
- Overall, the cable car market is poised for continued growth in the coming years, with a focus on enhancing passenger experience and increasing operational efficiency.
What will be Cable Cars Market Size During the Forecast Period?
- The cable car market has gained significant traction in various industries, particularly in the tourism sector and industrial applications. These transportation systems, which include gondolas, cabins, and ropeways, offer efficient solutions for traversing steep terrains and geographical barriers in both urban areas and remote locations. Cable cars have long been a popular choice for tourist destinations nestled in the mountains and hilly areas. The unique experience of ascending or descending steep inclines while enjoying panoramic views is a major draw for travelers. Moreover, these transportation systems provide access to areas that may otherwise be inaccessible due to the terrain. In industrial settings, cable cars serve as cost-effective construction and transportation solutions. They are widely used in mining operations to transport goods and passengers between different levels of mines. Additionally, they are employed in urban transportation systems to facilitate movement in hilly areas, reducing the need for extensive road networks. The continuous loop design of cable cars ensures a smooth and efficient operation. Original Equipment Manufacturers (OEMs) have been investing in the electrification of these systems, making them more environmentally friendly and reducing operational costs.
- Cable cars cater to a diverse range of passengers, from tourists seeking scenic views to industrial workers transporting goods. These transportation systems are versatile and can be customized to suit various applications, making them an attractive option for both tourism activities and industrial processes. In conclusion, the cable car market is an essential component of the transportation industry, providing efficient and cost-effective solutions for traversing steep terrains and geographical barriers in various industries. Whether it's in tourist destinations offering breathtaking views or industrial settings requiring reliable transportation, cable cars continue to play a crucial role in overcoming challenges posed by the terrain.
How is this market segmented and which is the largest segment?
The market research report provides comprehensive data (region-wise segment analysis), with forecasts and estimates in "USD billion" for the period 2025-2029, as well as historical data from 2019-2023 for the following segments.
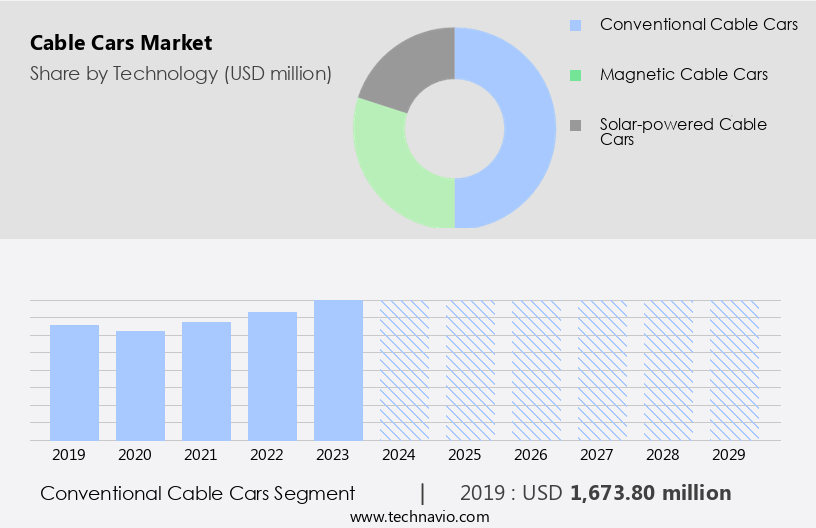
- Technology
- Conventional cable cars
- Magnetic cable cars
- Solar-powered cable cars
- Application
- Tourism
- Urban transportation
- Industrial
- Geography
- Europe
- France
- Italy
- North America
- Canada
- US
- APAC
- China
- India
- Japan
- South America
- Brazil
- Middle East and Africa
- Europe
By Technology Insights
- The conventional cable cars segment is estimated to witness significant growth during the forecast period.
Cable cars, also known as aerial tramways or gondolas, hold a substantial position in The market. These transportation systems rely on one or two stationary ropes for support and a third, moving rope for propulsion. The use of this design is extensive, catering to both practical transit needs and tourism attractions. For instance, the Peak Tram in Hong Kong, established in 1888, is a renowned example of a conventional cable car system. Passengers are treated to captivating views of Hong Kong's skyline as they ascend to Victoria Peak. This iconic cable car not only serves as a transit solution but also offers an unforgettable experience. Cable cars play a crucial role in various sectors, including agriculture, rural areas, and urban environments.
Additionally, in agriculture, they provide access to hilly terrains, enabling efficient farming practices. In rural areas, they offer a means of transportation in regions with poor infrastructure. In urban environments, they serve as an alternative to traditional public transport, reducing traffic congestion and offering scenic routes. Innovations in cable car technology continue to evolve, with detachable cable systems and alternative energy sources such as solar and wind power gaining popularity. These advancements enhance the functionality and sustainability of cable cars, making them an attractive investment for various industries. Hence, such factors are fuelling the growth of this segment during the forecast period.
Get a glance at the market report of share of various segments Request Free Sample
The conventional cable cars segment was valued at USD 1.67 billion in 2019 and showed a gradual increase during the forecast period.
Regional Analysis
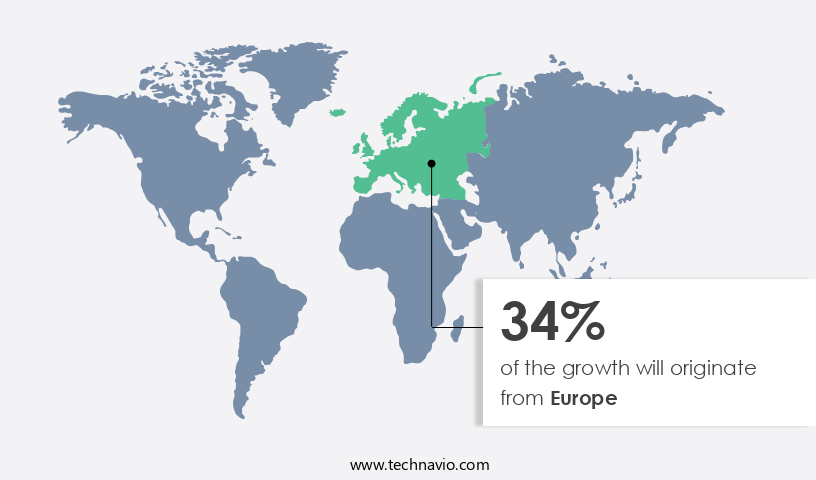
- Europe is estimated to contribute 34% to the growth of the global market during the forecast period.
Technavio's analysts have elaborately explained the regional trends and drivers that shape the market during the forecast period.
For more insights on the market share of various regions Request Free Sample
The cable car market in Europe is experiencing notable expansion due to substantial investments in novel transportation projects and the enhancement of infrastructure in tourist destinations. For instance, in October 2024, the Bachledka Ski and Sun resort in Slovakia unveiled its new six-seater cable car, Frankova. This project, set to welcome visitors from December 2024, signifies a total investment of approximately USD 12 million, with an additional USD 6 million sourced from the Sports Support Fund. This funding illustrates the crucial role of both public and private sectors in driving such initiatives. Located in the Bachledova Dolina Valley of the High Tatras, this cable car offers panoramic views of the mountains and steep terrains, making it an attractive addition to European cable car offerings. As global tourism continues to grow, the demand for efficient smart transportation solutions in remote areas and geographical barriers remains high, further fueling the expansion of the cable car market.
Market Dynamics
Our researchers analyzed the data with 2024 as the base year, along with the key drivers, trends, and challenges. A holistic analysis of drivers will help companies refine their marketing strategies to gain a competitive advantage.
What are the key market drivers leading to the rise in the adoption of Cable Cars Market?
Expansion of global tourism sector is the key driver of the market.
- The market in metropolitan cities is witnessing notable expansion due to the burgeoning tourism industry. The increasing number of international tourists and their associated spending on travel experiences are primary catalysts fueling the demand for cable car systems. For instance, in 2023, India recorded a substantial rise in foreign tourist arrivals, reaching 9.24 million, marking a 43.5% increase from the previous year. This influx of tourists generated approximately USD27 billion in foreign exchange earnings, signifying a substantial 65% growth compared to 2022. This significant rise in tourism highlights the importance of providing efficient and appealing transportation solutions, such as cable cars, to augment the tourist experience.
- These transportation systems, which include gondola lifts, aerial tramways, funicular ropeways, chair lifts, and surface lifts, are essential components of tourism infrastructure in mountainous regions and popular hiking destinations. By offering breathtaking views and convenient access to otherwise inaccessible areas, cable cars contribute to the overall appeal of these destinations and enhance the tourist experience.
What are the market trends shaping the Cable Cars Market?
Product innovations is the upcoming trend in the market.
- The market is experiencing notable progress in technological and design enhancements, catering to the demands for effective urban transportation and captivating tourism experiences. A recent announcement by the Santo Domingo government in December 2024, revealed a USD 250 million investment in the Santo Domingo Oeste Cable Car project. This ambitious initiative includes seven stations and is expected to connect six districts to the Duarte Highway. With a travel time of 20 minutes, this system aims to accommodate 4,500 passengers per hour in each direction, benefiting approximately 400,000 residents.
- The project signifies the increasing adoption of cable cars as a viable solution to urban congestion and a reliable transportation alternative in densely populated areas. This trend is gaining traction in various urban settings, both in industrial contexts and tourism industries. The integration of advanced technology and innovative designs is becoming essential in attracting passengers and goods transportation in challenging terrains.
What challenges does Cable Cars Market face during the growth?
High installation costs is a key challenge affecting the market growth.
- The market encounters substantial hurdles, primarily due to the substantial capital investment required for installing and maintaining these systems. This financial commitment can hinder the growth and expansion of cable car infrastructure. The significant expense is attributed to the substantial investment necessary for constructing the essential infrastructure. This involves the development of towers, stations, and cable installation, all of which necessitate high-quality materials and extensive construction efforts. The intricacy of designing and engineering ropeway systems further amplifies the costs. These systems necessitate specialized knowledge to ensure they are safe, productive, and long-lasting, often requiring the hiring of skilled professionals and investment in advanced engineering solutions.
- Inclined lifts, such as cable cars, offer unique benefits as public transport solutions, providing scenic views and reducing traffic congestion. However, their implementation faces challenges due to the high installation costs. Monocable and tricable ropeway systems are increasingly being considered as sustainable alternatives to traditional material handling methods, with some systems incorporating renewable energy sources. Despite these advantages, the initial investment remains a significant barrier to entry for many potential users. Cable cars, also known as aerial lifts or inclined railways, offer an efficient and eco-friendly transportation solution, particularly in mountainous regions and tourist destinations. However, their implementation requires a substantial investment in infrastructure, including towers, stations, and cables.
Exclusive Customer Landscape
The market forecasting report includes the adoption lifecycle of the market, covering from the innovator's stage to the laggard's stage. It focuses on adoption rates in different regions based on penetration. Furthermore, the market report also includes key purchase criteria and drivers of price sensitivity to help companies evaluate and develop their market growth analysis strategies.

Customer Landscape
Key Companies & Market Insights
Companies are implementing various strategies, such as strategic alliances, market forecast, partnerships, mergers and acquisitions, geographical expansion, and product/service launches, to enhance their presence in the market.
The market research and growth report includes detailed analyses of the competitive landscape of the market and information about key companies, including:
Aarconinfra Ropeways and future Mobility Pvt ltd. - This company offers cable cars with advanced POD cable cars designed for both passenger and cargo transport, eco-friendly and versatile.
- Bartholet Maschinenbau AG
- Calag Carrosserie Langenthal AG
- Conveyor and Ropeway Services Pvt. Ltd.
- Damodar Ropeways and Infra Ltd.
- DH Ltd.
- Doppelmayr Seilbahnen GmbH
- HIM CABLEWAYS
- Leitner AG
- MND SAS
- Nippon Cable Co.Ltd.
- POMA
- Rowema
- SYSTRA SA
- Tatralift as
- Udan Khatola
Qualitative and quantitative analysis of companies has been conducted to help clients understand the wider business environment as well as the strengths and weaknesses of key market players. Data is qualitatively analyzed to categorize companies as pure play, category-focused, industry-focused, and diversified; it is quantitatively analyzed to categorize companies as dominant, leading, strong, tentative, and weak.
Research Analyst Overview
Cable cars have become an integral part of transportation in various tourist destinations around the world, offering passengers breathtaking panoramic views of mountains, steep terrains, and scenic landscapes. These transportation systems are particularly useful in areas with geographical barriers, such as mountains or remote locations, providing access to otherwise inaccessible regions. Cable cars are not only limited to adventure tourism and tourist attractions but are also used in urban transportation solutions to overcome traffic congestion in metropolitan cities. The cable car industry caters to both passengers and goods, with applications ranging from mining and agriculture to urban environments and adventure tourism. The systems are designed to operate efficiently in various terrains, including hilly areas and poor infrastructure, making them a cost-effective solution for transportation in rural and industrial settings.
Moreover, cable cars come in various forms, including gondola lifts, aerial tramways, funicular ropeways, chair lifts, surface lifts, material ropeways, and inclined lifts. The cable car manufacturing industry is constantly innovating, with new cable car systems and technologies being developed to enhance the passenger experience and improve efficiency. These innovations include continuous loop systems, detachable cable systems, and electrification, among others. Overall, cable cars provide a unique and unforgettable transportation experience, making them a popular choice for tourists and locals alike.
| Cable Cars Market Scope | |
|
Report Coverage |
Details |
|
Page number |
204 |
|
Base year |
2024 |
|
Historic period |
2019-2023 |
|
Forecast period |
2025-2029 |
|
Growth momentum & CAGR |
Accelerate at a CAGR of 11.1% |
|
Market Growth 2025-2029 |
USD 2.96 billion |
|
Market structure |
Fragmented |
|
YoY growth 2024-2025(%) |
9.7 |
|
Key countries |
US, Switzerland, China, Canada, Austria, Japan, India, France, Italy, and Brazil |
|
Competitive landscape |
Leading Companies, Market Positioning of Companies, Competitive Strategies, and Industry Risks |
What are the Key Data Covered in this Market Research and Growth Report?
- CAGR of the market during the forecast period
- Detailed information on factors that will drive the market growth and forecasting between 2025 and 2029
- Precise estimation of the size of the market and its contribution of the market in focus to the parent market
- Accurate predictions about upcoming market growth and trends and changes in consumer behaviour
- Growth of the market across Europe, North America, APAC, South America, and Middle East and Africa
- Thorough analysis of the market's competitive landscape and detailed information about companies
- Comprehensive analysis of factors that will challenge the growth of market companies
We can help! Our analysts can customize this market research report to meet your requirements.
 RIA -
RIA - 
