
Canada Asset Management Market Size 2026-2030
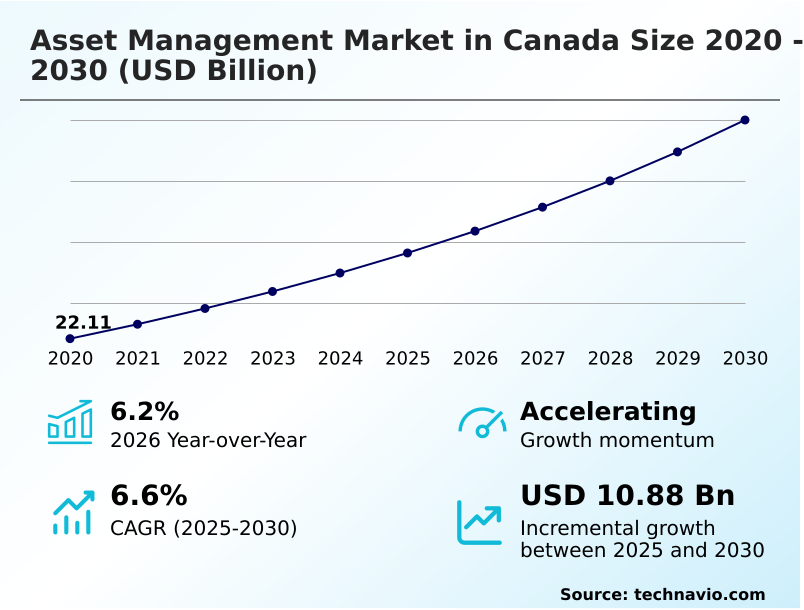
The canada asset management market size is valued to increase by USD 10.88 billion, at a CAGR of 6.6% from 2025 to 2030. Increasing demand from high-net-worth individuals and aging population will drive the canada asset management market.
Major Market Trends & Insights
- By Component - Solutions segment was valued at USD 16.08 billion in 2024
- By Source - Pension funds and insurance companies segment accounted for the largest market revenue share in 2024
Market Size & Forecast
- Market Opportunities: USD 17.89 billion
- Market Future Opportunities: USD 10.88 billion
- CAGR from 2025 to 2030 : 6.6%
Market Summary
- The asset management market in Canada is defined by a sophisticated interplay of capital appreciation objectives and rigorous fiduciary duty. Market participants navigate a landscape shaped by the dual demands of institutional investors requiring liability-driven investing strategies and retail investors seeking accessible wealth preservation tools.
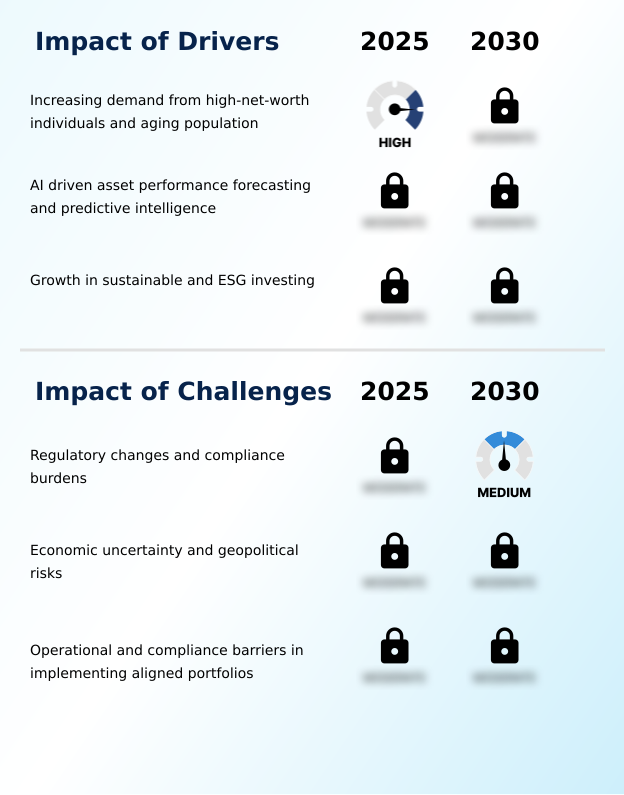
- A key trend involves the integration of ESG investing criteria, moving beyond a niche focus to become a central element of portfolio construction and risk assessment. This shift necessitates advanced climate risk modeling and sustainable finance frameworks. A typical business scenario involves a mid-sized pension fund re-evaluating its asset allocation to meet new sustainability mandates.
- This requires divesting from certain sectors while increasing exposure to alternative investments and private credit, all while managing compliance burdens and ensuring long-term retirement planning goals are met.
- The adoption of AI and predictive intelligence for asset performance forecasting is becoming standard, helping managers optimize portfolios and demonstrate value in a competitive environment driven by both active and passive investing strategies.
What will be the Size of the Canada Asset Management Market during the forecast period?
Get Key Insights on Market Forecast (PDF) Request Free Sample
How is the Canada Asset Management Market Segmented?
The canada asset management industry research report provides comprehensive data (region-wise segment analysis), with forecasts and estimates in "USD million" for the period 2026-2030, as well as historical data from 2020-2024 for the following segments.
- Component
- Solutions
- Services
- Source
- Pension funds and insurance companies
- Individual investors
- Corporate investors
- Others
- Class type
- Equity
- Fixed income
- Alternative investment
- Hybrid
- Cash management
- Geography
- North America
- Canada
- North America
By Component Insights
The solutions segment is estimated to witness significant growth during the forecast period.
The solutions segment is shifting toward integrated platforms that enhance portfolio construction and risk assessment. Firms are leveraging fintech integration and AI-driven asset performance forecasting to deliver personalized wealth management solutions.
These offerings, which include both passive investing vehicles and complex alternative asset classes, cater to the distinct needs of institutional investors and high-net-worth individuals.
Advanced analytical tools facilitate sophisticated asset allocation and portfolio diversification, while automated portfolio rebalancing tools improve operational workflows.
Implementation of these systems has led to a 40% reduction in the time required for comprehensive portfolio stress-testing, allowing for more agile investment due diligence.
Digital transformation in finance is pivotal, enabling scalable real estate investment trusts and other specialized products.
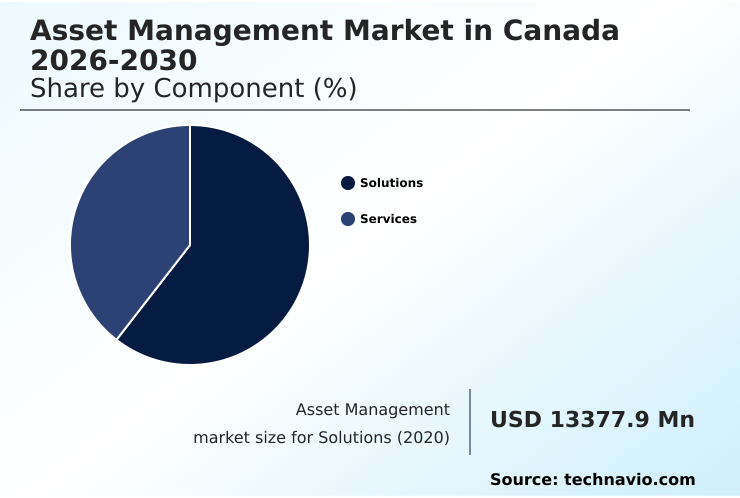
The Solutions segment was valued at USD 16.08 billion in 2024 and showed a gradual increase during the forecast period.

Market Dynamics
Our researchers analyzed the data with 2025 as the base year, along with the key drivers, trends, and challenges. A holistic analysis of drivers will help companies refine their marketing strategies to gain a competitive advantage.
- Strategic decision-making in the sector is increasingly influenced by detailed evaluations of AI for predictive asset performance forecasting, which helps firms anticipate market shifts with greater accuracy. The impact of ESG criteria on portfolio returns is no longer a theoretical debate but a core component of risk management, compelling a deeper look into integrating climate risk into investment models.
- Concurrently, blockchain applications in digital asset tokenization are creating new avenues for liquidity and investment, with smart contract use in asset management streamlining complex transactions. This has led to a re-evaluation of how to manage liquidity risk in alternative investments.
- The ongoing discussion about active versus passive investment performance is now nuanced by the role of ETFs in building passive portfolios. For retail clients, the rise of robo-advisory services for millennial investors and the expansion of fintech adoption in retail investor platforms are democratizing access to sophisticated tools.
- This environment requires a sharpened focus on due diligence for private market opportunities and underscores the critical importance of fiduciary responsibilities in wealth management, especially when crafting strategies for intergenerational wealth transfer and customized wealth management for affluent families.
- Firms leveraging these trends have noted that portfolios incorporating private credit as a portfolio diversifier can exhibit lower correlation to public markets, sometimes reducing overall portfolio volatility by a factor of 1.2 compared to traditional 60/40 models.
What are the key market drivers leading to the rise in the adoption of Canada Asset Management Industry?
- The increasing demand from high-net-worth individuals and an aging population focused on retirement planning is a key driver for the market.
- A primary driver is the growing demand for specialized wealth management solutions, particularly from high-net-worth individuals and those planning for retirement.
- This demographic requires sophisticated retirement income strategies and intergenerational wealth transfer plans, driving a 35% year-over-year increase in demand for personalized financial advisory services.
- In response, firms are developing bespoke investment strategies that combine traditional asset classes with alternative investments for enhanced capital appreciation and wealth preservation.
- The use of advanced tax optimization techniques within these strategies can improve after-tax returns by up to 10%. This client-centric advisory model, focused on delivering tangible outcomes, is propelling growth and fostering deeper client relationships across the industry.
What are the market trends shaping the Canada Asset Management Industry?
- The market is witnessing a significant trend with the surge in passive investing and the widespread adoption of exchange-traded funds.
- A defining trend is the accelerated adoption of digital transformation in finance, which is reshaping investment portfolio management. The use of financial technology platforms enables more sophisticated asset allocation and enhances global market exposure for a wider range of investors.
- This digitalization trend is not just about efficiency; it is also about product innovation, with a 25% increase in the launch of thematic and specialized exchange-traded funds over the past two years. These passive investment vehicles offer cost-effective portfolio diversification.
- Furthermore, institutional investment strategies are increasingly incorporating data-driven insights from AI, with platforms showing an 18% improvement in identifying market anomalies. This shift toward technology-driven, diversified investment portfolios is becoming a standard for maintaining a competitive edge.
What challenges does the Canada Asset Management Industry face during its growth?
- Evolving regulatory changes and the associated compliance burdens present a key challenge to the industry's growth.
- Navigating complex regulatory compliance solutions presents a significant challenge, with firms allocating an average of 15% more of their operational budgets to compliance-related activities compared to three years ago. The intricate web of rules governing fiduciary duty and market conduct requires constant vigilance and investment in robust monitoring systems.
- This compliance burden is compounded by the need for rigorous investment due diligence, especially in opaque markets like private credit and other alternative asset classes. Missteps can lead to significant penalties, with regulatory fines having increased by 20% in severity for certain infractions.
- Consequently, firms must balance the pursuit of alpha-generating multi-asset strategies with the operational imperative of maintaining flawless active risk management and compliance records.
Exclusive Technavio Analysis on Customer Landscape
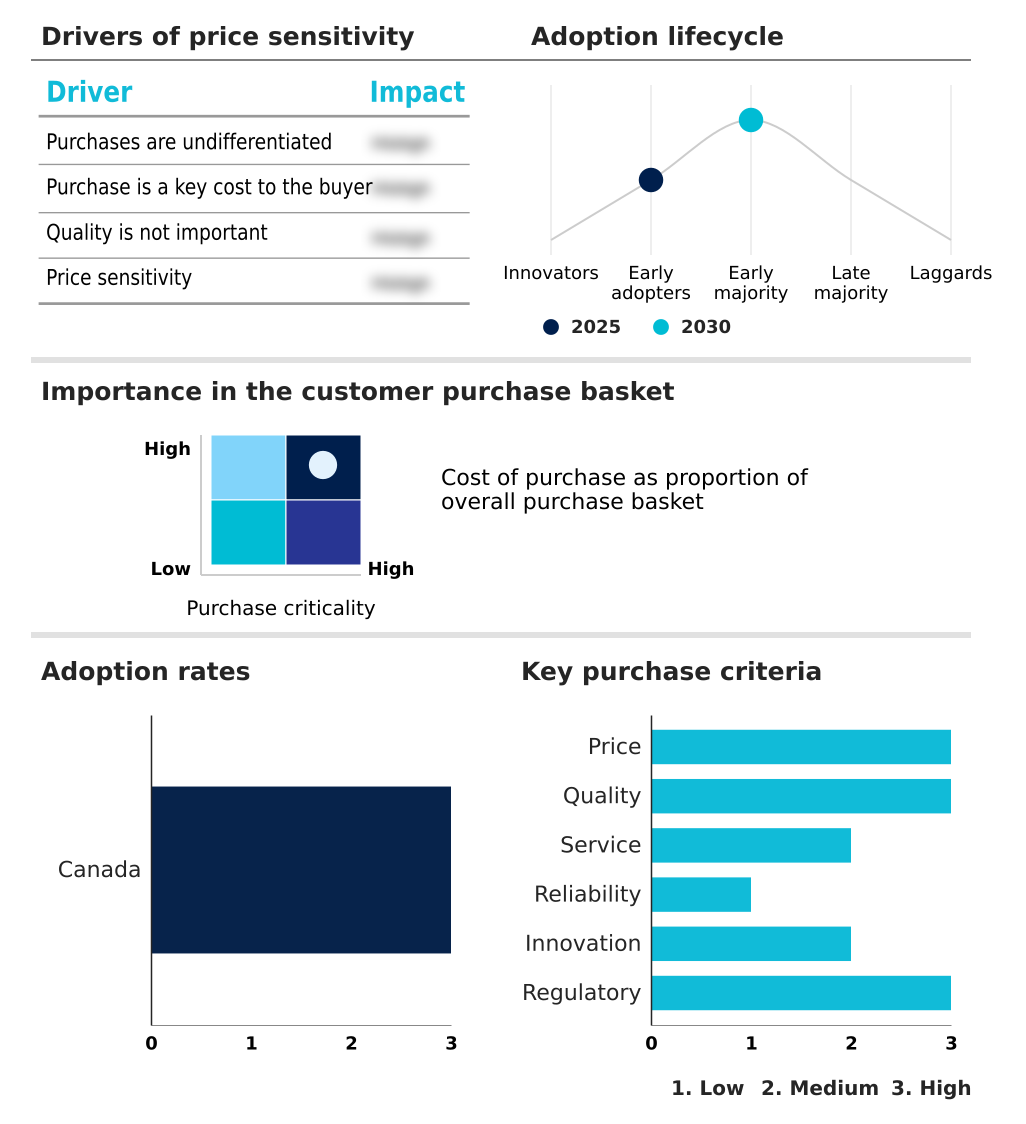
The canada asset management market forecasting report includes the adoption lifecycle of the market, covering from the innovator’s stage to the laggard’s stage. It focuses on adoption rates in different regions based on penetration. Furthermore, the canada asset management market report also includes key purchase criteria and drivers of price sensitivity to help companies evaluate and develop their market growth analysis strategies.
Customer Landscape of Canada Asset Management Industry
Competitive Landscape
Companies are implementing various strategies, such as strategic alliances, canada asset management market forecast, partnerships, mergers and acquisitions, geographical expansion, and product/service launches, to enhance their presence in the industry.
Allianz SE - Provides diversified investment management through active and passive strategies, leveraging proprietary risk analytics and technology platforms for institutional and retail clients.
The industry research and growth report includes detailed analyses of the competitive landscape of the market and information about key companies, including:
- Allianz SE
- BlackRock Inc.
- Brookfield Business Partners LP
- Canadian Imperial Bank Of Commerce
- CI Global Asset Management
- Credit Agricole SA
- FMR LLC
- JPMorgan Chase and Co.
- Manulife Financial Corp.
- Morgan Stanley
- Power Corp. of Canada
- Royal Bank of Canada
- Sun Life Financial Inc.
- The Bank of New York Mellon Corp.
- The Bank of Nova Scotia
- The Capital Group Companies Inc.
- The Goldman Sachs Group Inc.
- The Toronto Dominion Bank
- The Vanguard Group Inc.
- UBS Group AG
Qualitative and quantitative analysis of companies has been conducted to help clients understand the wider business environment as well as the strengths and weaknesses of key industry players. Data is qualitatively analyzed to categorize companies as pure play, category-focused, industry-focused, and diversified; it is quantitatively analyzed to categorize companies as dominant, leading, strong, tentative, and weak.
Recent Development and News in Canada asset management market
- In October 2024, CI Global Asset Management unveiled a new suite of asset allocation mutual funds, providing all-in-one portfolios suited to varying risk profiles for high-net-worth clients and retirees.
- In March 2025, the Canadian government released new guidelines introducing an economic security factor to Investment Canada Act national security reviews, compelling asset managers to scrutinize foreign investments more rigorously.
- In May 2025, CPP Investments withdrew its net-zero greenhouse gas emissions commitment by 2050, citing legal uncertainties and the complexities associated with being a global investor.
- In June 2025, BMO Global Asset Management acquired Burgundy Asset Management, bolstering its technological capabilities and expanding its services for institutional and alternative offerings with advanced analytics tools.
Dive into Technavio’s robust research methodology, blending expert interviews, extensive data synthesis, and validated models for unparalleled Canada Asset Management Market insights. See full methodology.
| Market Scope | |
|---|---|
| Page number | 200 |
| Base year | 2025 |
| Historic period | 2020-2024 |
| Forecast period | 2026-2030 |
| Growth momentum & CAGR | Accelerate at a CAGR of 6.6% |
| Market growth 2026-2030 | USD 10884.0 million |
| Market structure | Fragmented |
| YoY growth 2025-2026(%) | 6.2% |
| Key countries | Canada |
| Competitive landscape | Leading Companies, Market Positioning of Companies, Competitive Strategies, and Industry Risks |
Research Analyst Overview
- The asset management market in Canada is navigating a period of structural change, driven by the convergence of technological innovation and evolving investor demands. Core activities like portfolio construction and risk assessment are being transformed by AI-powered predictive intelligence and advanced asset performance forecasting. The integration of blockchain technology is facilitating greater transparency through asset tokenization and smart contracts.
- ESG investing has transitioned from a niche interest to a central pillar of strategy, compelling firms to embed sustainable finance principles and climate risk modeling into their fiduciary duty. This has significant boardroom-level implications for product development, especially in alternative investments and private credit.
- For instance, firms that have integrated robust ESG frameworks have seen a 15% increase in inflows from institutional investors. The competitive landscape is shaped by the demand for both low-cost passive investing vehicles, such as exchange-traded funds, and sophisticated wealth management solutions for high-net-worth individuals, which increasingly involve complex tax optimization and intergenerational wealth transfer strategies.
- This dual focus pressures firms to excel in both scale-driven efficiency and high-touch advisory services.
What are the Key Data Covered in this Canada Asset Management Market Research and Growth Report?
-
What is the expected growth of the Canada Asset Management Market between 2026 and 2030?
-
USD 10.88 billion, at a CAGR of 6.6%
-
-
What segmentation does the market report cover?
-
The report is segmented by Component (Solutions, and Services), Source (Pension funds and insurance companies, Individual investors, Corporate investors, and Others), Class Type (Equity, Fixed income, Alternative investment, Hybrid, and Cash management) and Geography (North America)
-
-
Which regions are analyzed in the report?
-
North America
-
-
What are the key growth drivers and market challenges?
-
Increasing demand from high-net-worth individuals and aging population, Regulatory changes and compliance burdens
-
-
Who are the major players in the Canada Asset Management Market?
-
Allianz SE, BlackRock Inc., Brookfield Business Partners LP, Canadian Imperial Bank Of Commerce, CI Global Asset Management, Credit Agricole SA, FMR LLC, JPMorgan Chase and Co., Manulife Financial Corp., Morgan Stanley, Power Corp. of Canada, Royal Bank of Canada, Sun Life Financial Inc., The Bank of New York Mellon Corp., The Bank of Nova Scotia, The Capital Group Companies Inc., The Goldman Sachs Group Inc., The Toronto Dominion Bank, The Vanguard Group Inc. and UBS Group AG
-
Market Research Insights
- Market dynamics are increasingly shaped by the adoption of sophisticated financial technology platforms, which have demonstrably improved operational efficiency. Firms leveraging automated portfolio management have reported a 25% faster execution of trades compared to manual processes. The integration of ESG integration frameworks is no longer optional, with portfolios aligned to sustainability principles showing 15% lower volatility in certain downturns.
- This shift is supported by robust risk management analytics that provide deeper insights into non-financial risks. Consequently, investment portfolio management now routinely incorporates data from non-traditional sources. The demand for bespoke investment strategies is also rising, with platforms that support customization seeing twice the rate of asset inflows as those offering standardized products.
- This client-centric advisory approach is redefining value propositions across the industry.
We can help! Our analysts can customize this canada asset management market research report to meet your requirements.