Chinese Takeout Market Size 2025-2029
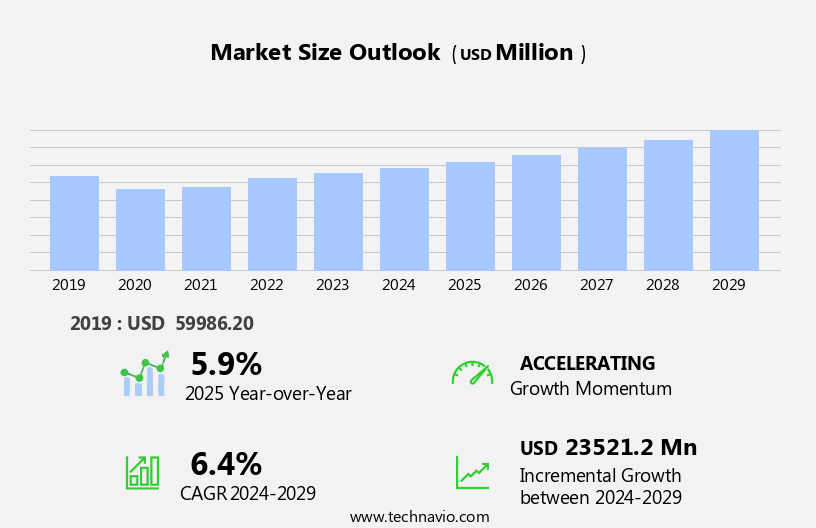
The chinese takeout market size is forecast to increase by USD 23.52 billion, at a CAGR of 6.4% between 2024 and 2029.
- The market is experiencing significant growth, driven by the increasing popularity of Chinese cuisine and the rising adoption of food platform-to-consumer delivery services. This trend is fueled by consumers' growing appreciation for diverse culinary experiences and the convenience of having meals delivered directly to their doors. However, the market faces challenges as well. Rising health concerns related to food service are becoming increasingly important to consumers, leading some to seek healthier alternatives or opt for cooking at home. This presents an opportunity for Chinese takeout businesses to differentiate themselves by offering healthier menu options or innovative delivery solutions.
- To capitalize on this market, companies must stay attuned to consumer preferences and adapt to the evolving landscape, ensuring they provide a unique and health-conscious offering that caters to the modern consumer's desire for convenience and wellness.
What will be the Size of the Chinese Takeout Market during the forecast period?
Explore in-depth regional segment analysis with market size data - historical 2019-2023 and forecasts 2025-2029 - in the full report.
Request Free Sample
The market continues to evolve, with dynamic market trends shaping its landscape. Beef and broccoli, a popular dish, undergoes constant culinary innovations, from cooking techniques to ingredient sourcing. Food safety and customer service remain top priorities, with vegetarian options gaining increasing demand. Moo shu pork and chow mein are staples, while hoisin sauce adds depth to various dishes. Food cost and labor cost are ongoing concerns, requiring effective inventory management and supply chain optimization. Waste management is a critical issue, with restaurants exploring sustainable solutions. Online ordering and delivery services are transforming the industry, influencing food preparation and order fulfillment.
Customer reviews and loyalty programs influence consumer behavior, driving the need for staff training and nutritional information disclosure. Dietary restrictions and allergen information are essential considerations, expanding the market reach. Restaurant management tools, such as kitchen equipment and mobile apps, streamline operations. Continuous improvements in cooking techniques, ingredient sourcing, and customer service ensure the market remains vibrant and evolving. The industry's adaptability to changing consumer preferences and market dynamics underscores its resilience and growth potential.
How is this Chinese Takeout Industry segmented?
The chinese takeout industry research report provides comprehensive data (region-wise segment analysis), with forecasts and estimates in "USD million" for the period 2025-2029, as well as historical data from 2019-2023 for the following segments.
- Type
- Full service restaurants
- Quick service restaurants
- Cafes and bars
- Product
- Non vegetarian
- Vegetarian
- Vegan
- Service Type
- Pickup and delivery only
- Hybrid
- Cloud kitchen
- Geography
- North America
- US
- Canada
- Mexico
- Europe
- France
- Germany
- UK
- APAC
- Australia
- China
- Indonesia
- Malaysia
- Rest of World (ROW)
- North America
By Type Insights
The full service restaurants segment is estimated to witness significant growth during the forecast period.
In the dynamic world of Chinese takeout, full service restaurants cater to a diverse clientele with authentic and contemporary offerings. Traditional establishments highlight regional Chinese cuisine, showcasing an extensive menu that includes dishes like lo mein, kung pao chicken, and beef and broccoli, prepared with ingredients such as soy sauce, water chestnuts, and sesame oil. These restaurants prioritize inventory management and cooking techniques to ensure food safety and consistency. Contemporary Chinese full service restaurants, like Tao Group Hospitality, innovate by combining traditional flavors with modern culinary techniques, offering dishes such as orange chicken and sesame chicken, while maintaining a focus on customer service and order fulfillment through mobile apps and online ordering.
Vegetarian and vegan options, as well as gluten-free and allergen information, are increasingly important, catering to various dietary restrictions. The supply chain is crucial for sourcing ingredients, with ingredient sourcing and delivery services playing a significant role in maintaining profit margins. Prep work and kitchen equipment are essential for efficient operations, while staff training and loyalty programs help retain customers. Nutritional information and cooking techniques are also essential for health-conscious consumers. The market continues to evolve, with trends like cooking techniques, food safety, and customer service shaping the industry. Restaurant management software and kitchen equipment help streamline operations, while food cost and waste management remain critical factors for success.
Overall, the market offers a rich and diverse culinary experience, blending tradition and innovation to cater to the evolving needs and preferences of consumers.
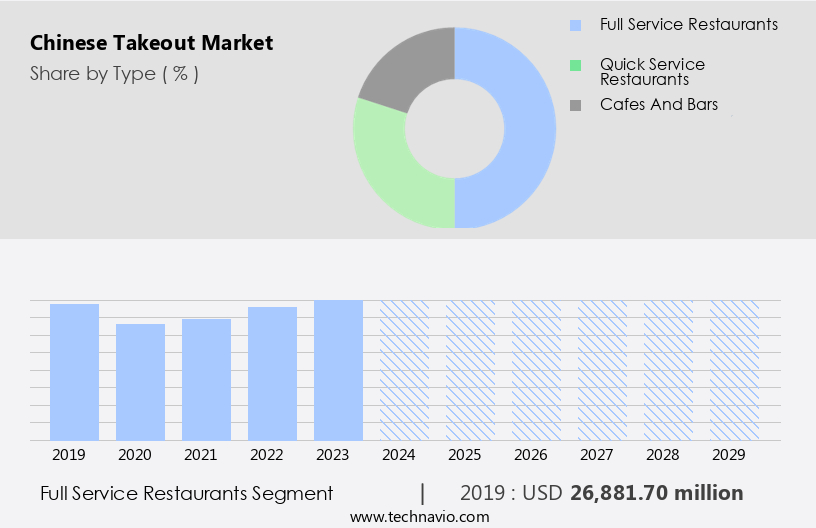
The Full service restaurants segment was valued at USD 26.88 billion in 2019 and showed a gradual increase during the forecast period.
Regional Analysis
APAC is estimated to contribute 39% to the growth of the global market during the forecast period. Technavio's analysts have elaborately explained the regional trends and drivers that shape the market during the forecast period.
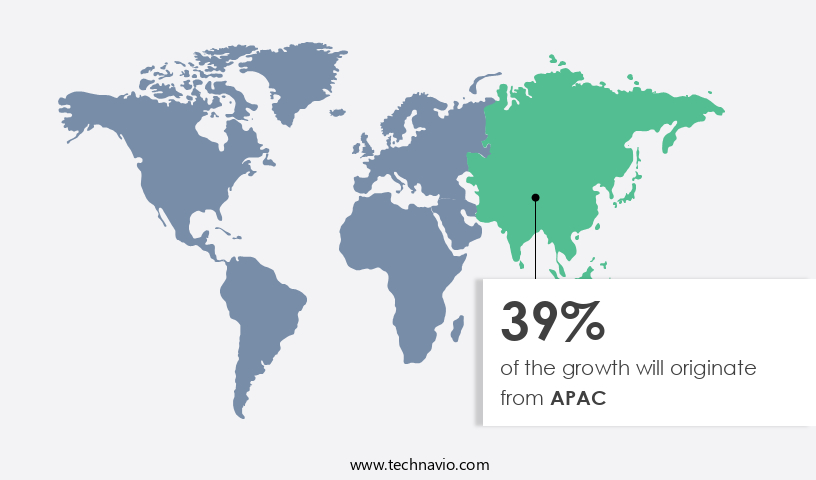
The Asian Pacific region (APAC) significantly shapes The market, marked by substantial growth and influencing industry trends. China, as the origin of Chinese cuisine, holds a prominent position within APAC and globally, fueled by a thriving domestic market and the increasing global appeal of Chinese food. Countries such as Japan, South Korea, Singapore, Thailand, and Malaysia experience rising demand for Chinese takeout, attributable to urbanization, evolving lifestyles, and a growing preference for convenient dining options. Key elements of Chinese takeout, including soy sauce, water chestnuts, sesame oil, vegan options, fried rice, lo mein, kung pao chicken, oyster sauce, orange chicken, and various sauces like chili garlic sauce and hoisin sauce, are integral to this market.
Efficient inventory management, order fulfillment, and customer service are crucial for businesses to maintain profitability and meet the increasing demand. Ingredient sourcing, cooking techniques, and food safety are essential aspects of Chinese takeout, with a focus on maintaining quality and adhering to dietary restrictions, including vegetarian, gluten-free, and allergen information. Delivery services, mobile apps, online ordering, and kitchen equipment streamline operations and cater to the convenience-driven market. Loyalty programs, customer reviews, and nutritional information are essential components of modern Chinese takeout businesses, ensuring customer satisfaction and repeat business. The supply chain, from ingredient sourcing to delivery, plays a vital role in the success of these businesses, necessitating effective management and collaboration among various stakeholders.
Staff training, cooking techniques, and food safety are essential to maintaining a high level of quality and consistency in Chinese takeout. Restaurant management systems help streamline operations, manage labor costs, and minimize waste. The market continues to evolve, with new trends emerging, such as plant-based options and a focus on sustainability.
Market Dynamics
Our researchers analyzed the data with 2024 as the base year, along with the key drivers, trends, and challenges. A holistic analysis of drivers will help companies refine their marketing strategies to gain a competitive advantage.
In the vibrant and diverse world of takeout food, the market stands out as a popular and beloved choice for consumers seeking authentic, savory, and convenient meals. From classic dishes like Kung Pao Chicken and General Tso's Chicken to vegetarian options such as Mapo Tofu and Moo Shu Vegetables, the market caters to various tastes and dietary preferences. Customers appreciate the rich flavors, affordability, and ease of ordering and picking up their meals. The market also offers a range of side dishes, including Fortune Cookies and Egg Rolls, adding to the overall dining experience. With the convenience of online ordering and delivery services, the market continues to thrive, providing a go-to option for busy individuals and families. The market's versatility, from catering to special events to offering meal deals and combos, ensures its enduring appeal and growth.
What are the key market drivers leading to the rise in the adoption of Chinese Takeout Industry?
- The increasing prevalence of Chinese cuisine in global food trends significantly drives the market's growth.
- The market experiences continuous growth due to the increasing popularity and adoption of Chinese cuisine worldwide. Globalization plays a crucial role in this expansion, allowing people from diverse backgrounds to be exposed to Chinese culinary traditions. As individuals travel and explore new cultures, their appreciation for Chinese food deepens, leading to an increased demand for takeout options. Chinese takeout menus offer a vast selection of dishes, catering to various tastes and preferences, including savory stir-fries, spicy Sichuan delicacies, and delicate dim sum. To meet this demand, businesses focus on various aspects of their operations. Prep work and staff training are essential for maintaining high-quality dishes, while delivery services ensure timely order fulfillment.
- Takeout containers, such as those designed for egg rolls and spring rolls, preserve the authenticity and texture of the food during transportation. Supply chain management is another critical factor, ensuring a consistent supply of ingredients and maintaining the freshness of key components, like chili garlic sauce. Loyalty programs are also employed to retain customers and encourage repeat business. These programs offer incentives and rewards for frequent orders, strengthening the relationship between the business and its clientele. Overall, the market continues to thrive due to the diverse appeal of Chinese cuisine and the efforts of businesses to meet the growing demand.
What are the market trends shaping the Chinese Takeout Industry?
- The rising preference for food platform-to-consumer delivery services represents a significant market trend. This trend signifies a shift towards convenience and contactless consumption in today's fast-paced world.
- The market is witnessing a notable growth in the use of food delivery platforms, fueled by the convenience and diverse selection they provide. Consumers can effortlessly order from a vast array of Chinese dishes, with features such as real-time tracking and customized recommendations enhancing the experience. The COVID-19 pandemic has expedited this trend, as contactless dining has become essential. Restaurants are utilizing these platforms to expand their customer base and increase sales, despite commission fees being a challenge. This digital transformation is driving market expansion and fostering innovation, resulting in improved delivery efficiency and heightened customer satisfaction.
- Key Chinese takeout dishes, such as beef and broccoli, moo shu pork, chow mein, and wonton soup, continue to be popular choices. Food safety and vegetarian options are crucial considerations for consumers, with restaurants employing various cooking techniques and using ingredients like hoisin sauce to cater to diverse preferences. Labor cost and waste management are significant factors influencing the market dynamics, with restaurants implementing efficient practices to mitigate these challenges.
What challenges does the Chinese Takeout Industry face during its growth?
- The food service industry faces significant growth challenges due to escalating health concerns, requiring continuous adaptation to maintain consumer trust and compliance with regulatory standards.
- The market faces growing challenges due to increasing health consciousness among consumers. With rising awareness of health issues like obesity, diabetes, and heart disease, there is a greater emphasis on healthier eating habits. Chinese takeout, which is often perceived as high in sodium, MSG, and unhealthy fats, may face scrutiny due to its potential contribution to these health problems. Additionally, the lack of transparency in ingredient sourcing and preparation methods within the Chinese takeout industry can heighten health concerns, as consumers may be uncertain about the nutritional content and quality of the food they are ordering.
- To address these concerns, Chinese takeout businesses can focus on providing nutritional information, dietary restrictions options, and allergen information online for customers. Implementing restaurant management systems that prioritize kitchen equipment upgrades to minimize the use of vegetable oil and offer gluten-free options can also help attract health-conscious consumers. Positive customer reviews highlighting the efforts made by Chinese takeout businesses to address health concerns can help improve brand reputation and sales.
Exclusive Customer Landscape
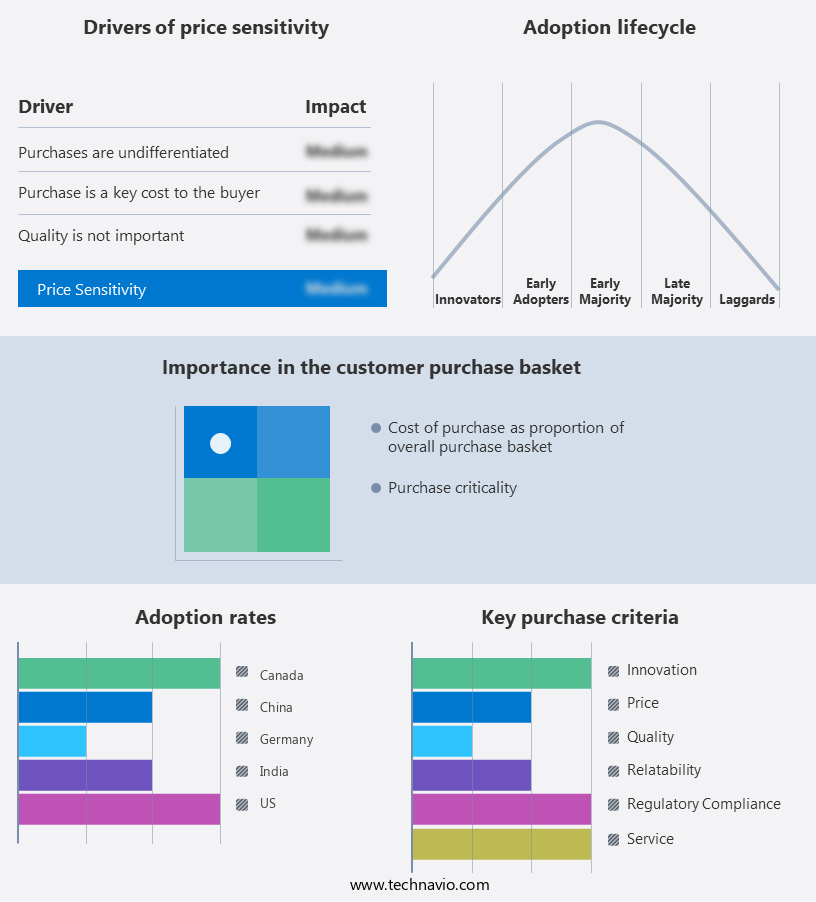
The chinese takeout market forecasting report includes the adoption lifecycle of the market, covering from the innovator's stage to the laggard's stage. It focuses on adoption rates in different regions based on penetration. Furthermore, the chinese takeout market report also includes key purchase criteria and drivers of price sensitivity to help companies evaluate and develop their market growth analysis strategies.
Customer Landscape
Key Companies & Market Insights
Companies are implementing various strategies, such as strategic alliances, chinese takeout market forecast, partnerships, mergers and acquisitions, geographical expansion, and product/service launches, to enhance their presence in the industry.
China Tang - This company specializes in authentic Chinese cuisine, featuring dishes such as Krab Rangoon, Won Tons, Lo Mein, and Orange Chicken in a takeout format.
The industry research and growth report includes detailed analyses of the competitive landscape of the market and information about key companies, including:
- China Tang
- City Wok
- Din Tai Fung USA
- GOUBULI RESTAURANT
- Gourmet Express Chinese Food
- Haidhongda Catering Management Co. Ltd.
- Imperial Treasure Restaurant Group Pte Ltd.
- Lao Sze Chuan
- Leeann Chin Inc.
- MR CHOW
- Mr. Chows
- MTY Food Group Inc.
- Nom Wah
- P.F. Changs China Bistro Inc.
- Park Chinois
- Pei Wei Asian Diner LLC
- Sichuan Impression
- Tao Group Hospitality
- The East
- Xian Famous Foods
Qualitative and quantitative analysis of companies has been conducted to help clients understand the wider business environment as well as the strengths and weaknesses of key industry players. Data is qualitatively analyzed to categorize companies as pure play, category-focused, industry-focused, and diversified; it is quantitatively analyzed to categorize companies as dominant, leading, strong, tentative, and weak.
Recent Development and News in Chinese Takeout Market
- In January 2024, food delivery giant Meituan announced a strategic partnership with several major Chinese takeout restaurants, aiming to expand its delivery network and enhance the user experience (Meituan Press Release, 2024).
- In March 2024, Didi Food, a subsidiary of Didi Chuxing, raised USD300 million in a Series D funding round, fueling its growth in the market (Crunchbase, 2024).
- In April 2024, Ele.Me, Alibaba's food delivery platform, introduced a new feature called "Ele.Me Now," enabling users to order and receive their Chinese takeout within 30 minutes (Alibaba Press Release, 2024).
- In May 2025, the Chinese government issued new regulations to promote the digitalization of the food delivery industry, including takeout services, and strengthen food safety standards (China National News, 2025).
Research Analyst Overview
- The market is experiencing dynamic shifts, with delivery optimization and corporate catering gaining significant traction. Family meals and meal prep are also popular trends, necessitating pricing strategies that balance affordability and quality. Waste reduction strategies, such as recipe standardization and food styling, are crucial for brands seeking to enhance customer satisfaction. Event catering and customer demographics continue to shape market trends, with influencer marketing and social media platforms playing a pivotal role in brand identity and menu design. Sustainability initiatives, taste testing, and employee retention are essential components of successful catering contracts. Technology integration, including online ordering platforms and menu engineering, streamlines operations and enhances the customer experience.
- Frozen food, single-serving options, and menu customization cater to diverse taste preferences and dietary needs. Cultural relevance, community outreach, and public relations are vital for maintaining a strong brand presence. Taste testing, recipe development, and food photography are key elements of innovation and differentiation. Bulk orders, catering contracts, and franchise support ensure operational efficiency and growth. Health and wellness, sustainability, and deep frying are influencing menu engineering and recipe development.
Dive into Technavio's robust research methodology, blending expert interviews, extensive data synthesis, and validated models for unparalleled Chinese Takeout Market insights. See full methodology.
|
Market Scope |
|
|
Report Coverage |
Details |
|
Page number |
203 |
|
Base year |
2024 |
|
Historic period |
2019-2023 |
|
Forecast period |
2025-2029 |
|
Growth momentum & CAGR |
Accelerate at a CAGR of 6.4% |
|
Market growth 2025-2029 |
USD 23521.2 million |
|
Market structure |
Fragmented |
|
YoY growth 2024-2025(%) |
5.9 |
|
Key countries |
China, US, UK, Canada, Australia, Malaysia, Indonesia, France, Mexico, and Germany |
|
Competitive landscape |
Leading Companies, Market Positioning of Companies, Competitive Strategies, and Industry Risks |
What are the Key Data Covered in this Chinese Takeout Market Research and Growth Report?
- CAGR of the Chinese Takeout industry during the forecast period
- Detailed information on factors that will drive the growth and forecasting between 2025 and 2029
- Precise estimation of the size of the market and its contribution of the industry in focus to the parent market
- Accurate predictions about upcoming growth and trends and changes in consumer behaviour
- Growth of the market across APAC, North America, Europe, South America, and Middle East and Africa
- Thorough analysis of the market's competitive landscape and detailed information about companies
- Comprehensive analysis of factors that will challenge the chinese takeout market growth of industry companies
We can help! Our analysts can customize this chinese takeout market research report to meet your requirements.
 RIA -
RIA - 
