Chemical Mechanical Planarization (CMP) Equipment Market Analysis, Size, and Forecast 2026-2030: APAC (China, South Korea, and Japan), North America (US, Canada, and Mexico), Europe (Germany, France, and UK), South America (Brazil and Argentina), Middle East and Africa (Israel, UAE, and Saudi Arabia), and Rest of World (ROW)

Chemical Mechanical Planarization (CMP) Equipment Market Analysis, Size, and Forecast 2026-2030:
APAC (China, South Korea, and Japan), North America (US, Canada, and Mexico), Europe (Germany, France, and UK), South America (Brazil and Argentina), Middle East and Africa (Israel, UAE, and Saudi Arabia), and Rest of World (ROW)

Published: Mar 2026 284 Pages SKU: IRTNTR77030

Market Overview at a Glance

$785.6 Mn
Market Opportunity
5.3%
CAGR 2025 - 2030
39.1%
APAC Growth
$1.67 B
Foundries segment 2024

Chemical Mechanical Planarization (CMP) Equipment Market Size 2026-2030

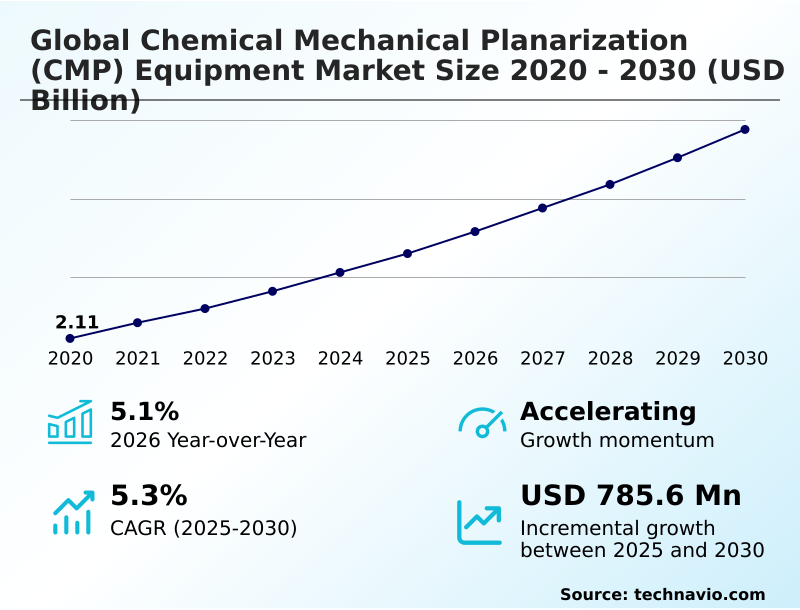
The chemical mechanical planarization (cmp) equipment market size is valued to increase by USD 785.6 million, at a CAGR of 5.3% from 2025 to 2030. Gate-all-around transistor architectures and 2-nanometer node transition will drive the chemical mechanical planarization (cmp) equipment market.

Major Market Trends & Insights

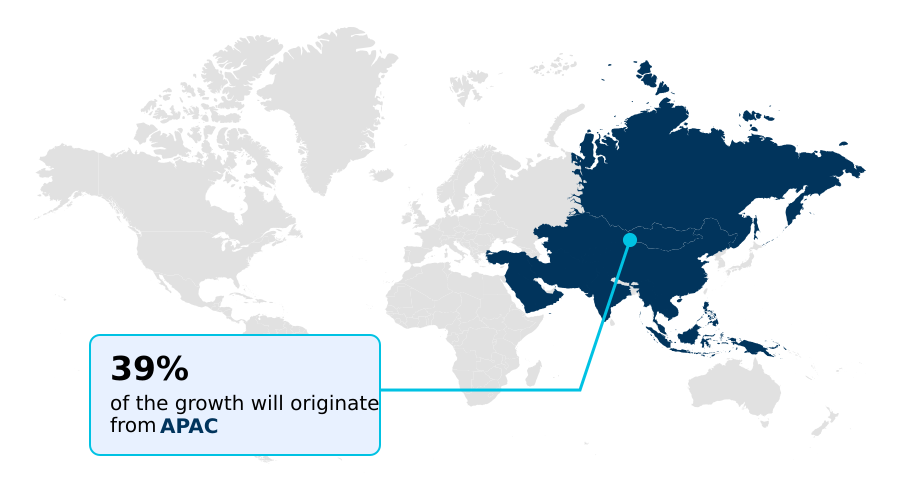
  • APAC dominated the market and accounted for a 39.1% growth during the forecast period.
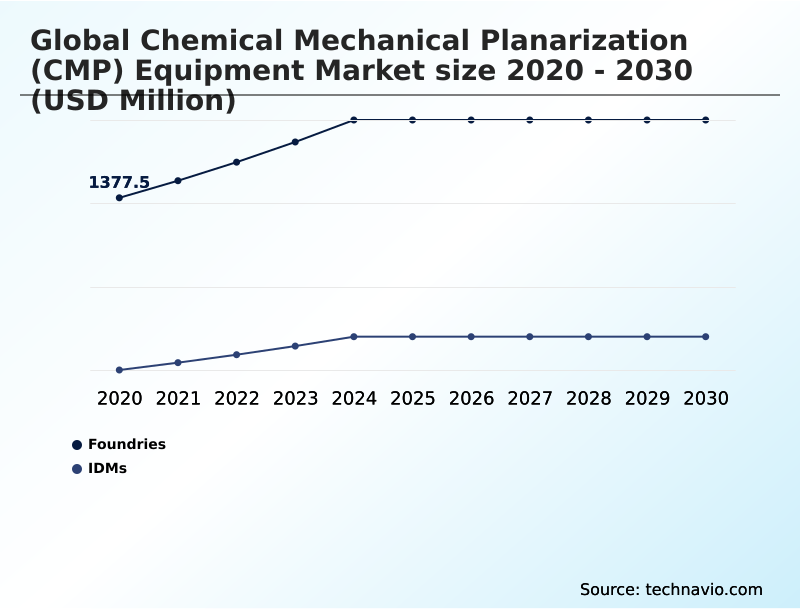
  • By Application - Foundries segment was valued at USD 1.67 billion in 2024
  • By Type - 300mm segment accounted for the largest market revenue share in 2024

Market Size & Forecast

  • Market Opportunities: USD 1.33 billion
  • Market Future Opportunities: USD 785.6 million
  • CAGR from 2025 to 2030 : 5.3%

Market Summary

  • The chemical mechanical planarization (CMP) equipment market is undergoing a critical evolution, driven by the semiconductor industry's relentless push toward smaller, more complex chip architectures. Demand is shaped by the need for atomic-level surface precision in fabricating advanced logic and memory devices. Key applications involve preparing wafer surfaces for multi-layer interconnects and ensuring the flawless construction of 3D device structures.
  • A core trend is the integration of advanced metrology and process control systems directly into polishing platforms, enabling real-time adjustments that significantly reduce defects. For instance, in a high-volume manufacturing environment, integrated platforms can reduce wafer-level defectivity by up to 20% compared to conventional systems, directly improving production yields.
  • This technological pivot from simple mechanical polishing to data-driven surface engineering is fundamental. However, the industry grapples with the technical challenges of planarizing new materials and complex topographies associated with gate-all-around transistors and advanced packaging, demanding continuous innovation in both equipment and consumable technologies like specialized slurries and pads.
  • The market's trajectory is tied to the industry's ability to balance performance advancements with manufacturing cost-efficiency and sustainability mandates.

What will be the Size of the Chemical Mechanical Planarization (CMP) Equipment Market during the forecast period?

Get Key Insights on Market Forecast (PDF) Request Free Sample

How is the Chemical Mechanical Planarization (CMP) Equipment Market Segmented?

The chemical mechanical planarization (cmp) equipment industry research report provides comprehensive data (region-wise segment analysis), with forecasts and estimates in "USD million" for the period 2026-2030, as well as historical data from 2020-2024 for the following segments.

  • Application
    • Foundries
    • IDMs
  • Type
    • 300mm
    • 200mm
    • 150mm
  • Product type
    • CMP equipment
    • CMP consumables
  • Geography
    • APAC
      • China
      • South Korea
      • Japan
    • North America
      • US
      • Canada
      • Mexico
    • Europe
      • Germany
      • France
      • UK
    • South America
      • Brazil
      • Argentina
    • Middle East and Africa
      • Israel
      • UAE
      • Saudi Arabia
    • Rest of World (ROW)

By Application Insights

The foundries segment is estimated to witness significant growth during the forecast period.

The foundries segment is pivotal, driven by fabless semiconductor companies outsourcing chip fabrication. This segment's expansion relies on achieving nanometer-scale planarization for advanced process nodes, where through-silicon via (TSV) technology is crucial.

Operations require multi-platen polishing systems equipped with in situ metrology and real-time endpoint detection to ensure wafer surface uniformity. Effective multi-zone pressure control and the use of advanced colloidal silica slurry are standard for optimizing these processes.

Predictive maintenance protocols are essential, reducing equipment downtime by over 25% and ensuring the necessary chemical etching synergy for complex architectures.

The evolution toward advanced nodes intensifies the need for precise nanoparticle slurry composition to manage shallow trench isolation (STI), cobalt interconnects, and inter-layer dielectric (ILD) polishing, defining the sector’s high-precision manufacturing landscape.

Request Free Sample

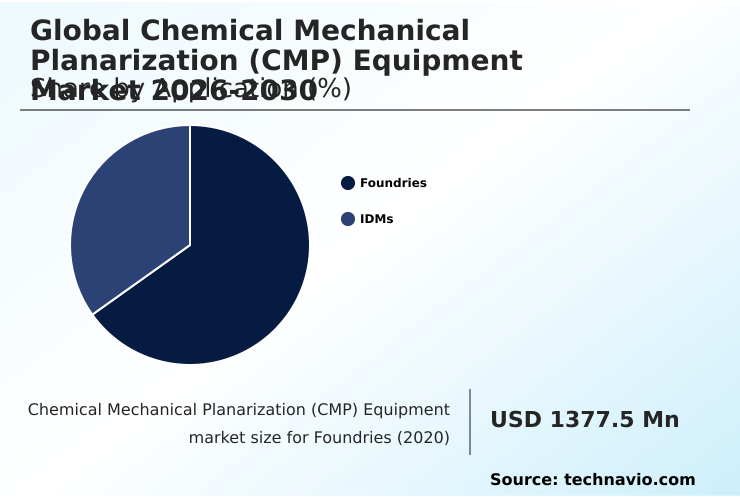
The Foundries segment was valued at USD 1.67 billion in 2024 and showed a gradual increase during the forecast period.

Request Free Sample

Regional Analysis

APAC is estimated to contribute 39.1% to the growth of the global market during the forecast period.Technavio’s analysts have elaborately explained the regional trends and drivers that shape the market during the forecast period.

See How Chemical Mechanical Planarization (CMP) Equipment Market Demand is Rising in APAC Request Free Sample

The APAC region leads the global chemical mechanical planarization (CMP) equipment market, contributing over 39% of the incremental growth, driven by its dense concentration of advanced foundries.

Regional leadership is sustained by the high-volume production of devices requiring sophisticated fan-out wafer-level packaging (FOWLP) and advanced wafer thinning systems.

Key manufacturing hubs in the region are rapidly adopting high-numerical aperture EUV lithography, which demands exceptional atomic-scale flatness and precise copper interconnects, all facilitated by tools with advanced endpoint detection.

In contrast, North America and Europe, which account for a combined 46% of market opportunity, are focusing on government-backed initiatives to onshore critical semiconductor wafer processing. This strategic shift is creating demand for CMP technologies that address ultra-low topography variation.

Advanced semiconductor manufacturing metrology shows that new systems can achieve a 20% tighter tolerance on surface roughness measurement, which is essential for next-generation oxide layer planarization and tungsten CMP processes.

Market Dynamics

Our researchers analyzed the data with 2025 as the base year, along with the key drivers, trends, and challenges. A holistic analysis of drivers will help companies refine their marketing strategies to gain a competitive advantage.

  • Strategic decisions in the semiconductor industry are increasingly influenced by the total cost of ownership for CMP platforms, especially for leading-edge applications. The deployment of CMP equipment for 300mm wafer fabrication remains the industry standard, but the focus is now on optimizing the CMP process for gate-all-around architectures.
  • Innovations in hybrid bonding planarization techniques are critical for advanced packaging, which also drives demand for specialized slurry solutions for silicon carbide polishing. To enhance yield, fabs are implementing real-time monitoring in CMP systems, specifically to address challenges like reducing defects in TSV planarization.
  • Success depends on sophisticated endpoint detection for multi-material stacks and the use of high-selectivity slurry for 3D NAND. As the industry advances, CMP consumables for sub-2nm nodes must meet stringent quality standards, aligning with complex advanced packaging CMP requirements. This has spurred R&D in low-abrasion polishing for advanced nodes and metrology integration in CMP tools.
  • Furthermore, throughput optimization in single-wafer polishers is a key performance indicator. While new equipment is essential, the market for CMP equipment refurbishment and upgrades is also growing. On the sustainability front, the implementation of sustainable slurry recycling systems is becoming a priority, alongside innovations in polishing pad design for ultra-low topography.
  • Ultimately, achieving precise CMP process control for AI accelerators defines competitive advantage, which is significantly more capital-intensive than processes for mature nodes. This landscape also shows how CMP for heterogeneous integration and addressing planarization challenges in FOWLP are shaping future investments.

What are the key market drivers leading to the rise in the adoption of Chemical Mechanical Planarization (CMP) Equipment Industry?

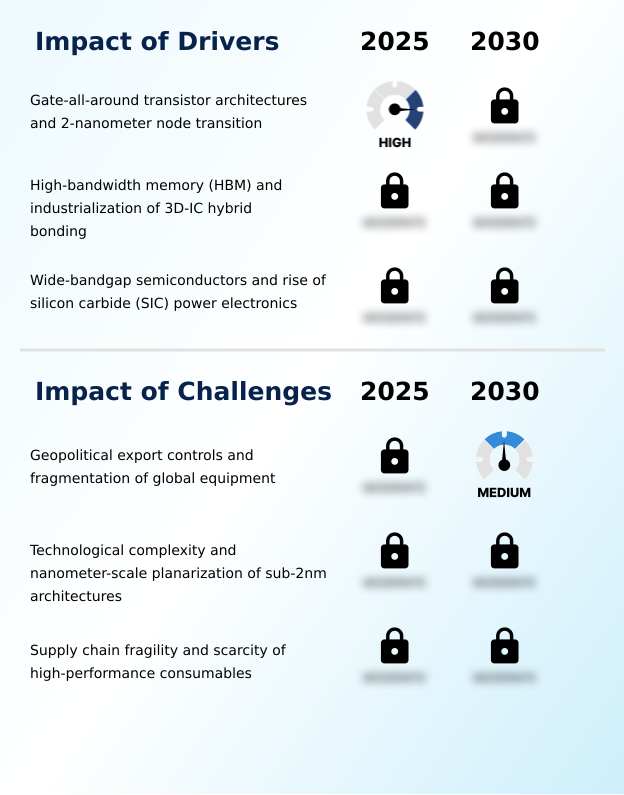
  • The transition to gate-all-around (GAA) transistor architectures and the push toward the 2-nanometer process node are primary market drivers.

  • Market drivers are centered on the industry-wide transition to advanced transistor designs and materials. The adoption of gate-all-around (GAA) transistor technology, characterized by complex nanosheet and nanowire designs, necessitates a higher number of precision polishing steps.
  • This transition has boosted demand for advanced single-wafer polishers capable of handling new sacrificial materials and selective liners with a 20% improvement in material removal rate control. The expansion of high-bandwidth memory (HBM) and 3D NAND structures also fuels demand.
  • Furthermore, the growing use of silicon carbide (SiC) power electronics creates a need for specialized CMP processes.
  • Effective interconnect planarization is managed through sophisticated process control software that enables dynamic polishing pressure optimization and precise edge profile control, improving final device yield by up to 5%.

What are the market trends shaping the Chemical Mechanical Planarization (CMP) Equipment Industry?

  • The market is increasingly shaped by the proliferation of 3D integration and hybrid bonding techniques in advanced packaging nodes. This shift drives demand for CMP solutions capable of delivering atomic-scale surface precision.

  • A primary trend reshaping the chemical mechanical planarization (CMP) equipment market is the move toward heterogeneous 3D integration, which depends on flawless 3D-IC hybrid bonding. This requires sophisticated multi-material polishing techniques to achieve perfect metal-to-metal and dielectric-to-dielectric bonding.
  • Innovations in low-abrasive slurry management and polishing pad conditioners are critical for improving planarization efficiency, with advanced systems demonstrating a 15% reduction in consumable usage. The adoption of automated material handling in back-end-of-line processing has also improved throughput by over 10%.
  • As processes become more complex, managing wafer defectivity is paramount, leading to advancements in post-CMP cleaning and the exploration of new methods like abrasive-free polishing and electro-chemical mechanical deposition to meet stringent surface quality requirements.

What challenges does the Chemical Mechanical Planarization (CMP) Equipment Industry face during its growth?

  • Market growth faces significant headwinds from geopolitical export controls and the resulting fragmentation of the global equipment supply chain.

  • The chemical mechanical planarization (CMP) equipment market faces significant challenges from supply chain complexities and technological hurdles. The dependency on a limited number of suppliers for high-performance consumables and critical wafer fab equipment creates vulnerabilities. For instance, shortages in fixed-abrasive pads have led to production delays of up to four weeks for some manufacturers.
  • Additionally, achieving uniform slurry distribution uniformity across 300mm wafers for sub-2nm architectures is a persistent technical problem. The need for advanced integrated cleaning modules, slurry delivery systems, and energy-intensive dry vacuum pumps and plasma abatement systems adds to the high capital cost.
  • Optimizing consumable lifetime monitoring, wafer carrier design, and platen temperature control remains a key focus to mitigate these operational and financial pressures, which can increase the cost of ownership by 10-15%.

Exclusive Technavio Analysis on Customer Landscape

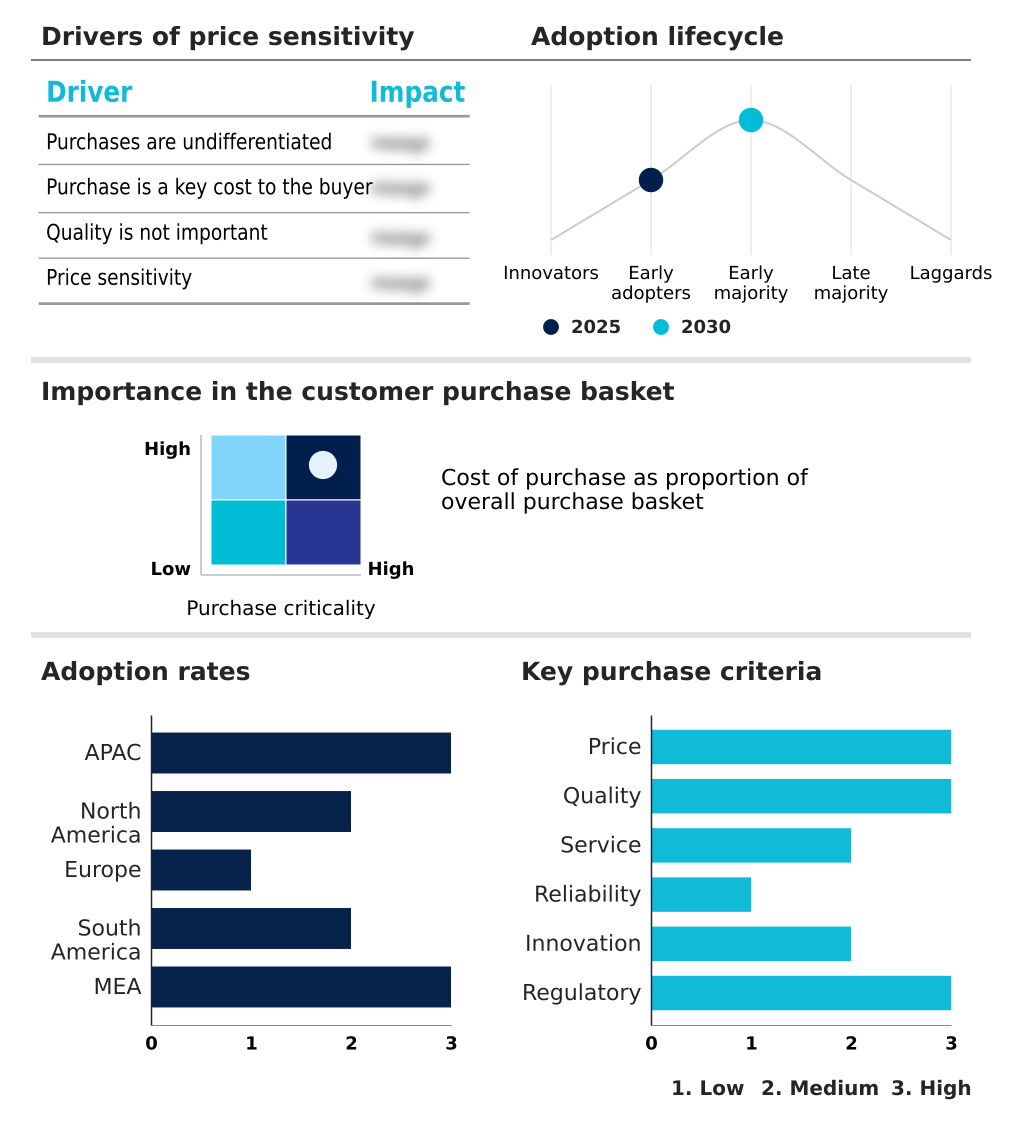
The chemical mechanical planarization (cmp) equipment market forecasting report includes the adoption lifecycle of the market, covering from the innovator’s stage to the laggard’s stage. It focuses on adoption rates in different regions based on penetration. Furthermore, the chemical mechanical planarization (cmp) equipment market report also includes key purchase criteria and drivers of price sensitivity to help companies evaluate and develop their market growth analysis strategies.

Customer Landscape of Chemical Mechanical Planarization (CMP) Equipment Industry

Competitive Landscape

Companies are implementing various strategies, such as strategic alliances, chemical mechanical planarization (cmp) equipment market forecast, partnerships, mergers and acquisitions, geographical expansion, and product/service launches, to enhance their presence in the industry.

3M Co. - Offerings include specialized chemical mechanical planarization (CMP) equipment, encompassing advanced polishing pads, slurries, and consumables tailored for high-precision semiconductor wafer processing.

The industry research and growth report includes detailed analyses of the competitive landscape of the market and information about key companies, including:

  • 3M Co.
  • Alps Alpine Co. Ltd.
  • AP and S International GmbH
  • Applied Materials Inc.
  • Axus Technology
  • BASF SE
  • DISCO Corp.
  • Dow Chemical Co.
  • DuPont de Nemours Inc.
  • Ebara Corp.
  • Entegris Inc.
  • Entrepix Inc.
  • Kemet International Ltd.
  • Lapmaster Wolters
  • Logitech Ltd.
  • Merck KGaA
  • Musashino Denshi Inc.
  • Nachi Fujikoshi Corp.
  • SpeedFam Co. Ltd.
  • Tokyo Seimitsu Co. Ltd.

Qualitative and quantitative analysis of companies has been conducted to help clients understand the wider business environment as well as the strengths and weaknesses of key industry players. Data is qualitatively analyzed to categorize companies as pure play, category-focused, industry-focused, and diversified; it is quantitatively analyzed to categorize companies as dominant, leading, strong, tentative, and weak.

Recent Development and News in Chemical mechanical planarization (cmp) equipment market

  • In October 2024, Ebara Corp. launched its F-REX300XA model, a next-generation CMP system specifically engineered to support high-volume manufacturing of devices using hybrid bonding technology, enhancing throughput for advanced packaging applications.
  • In January 2025, Applied Materials Inc. announced a strategic collaboration with a leading logic foundry to accelerate the development and commercialization of gate-all-around (GAA) process flows for the upcoming 2-nanometer node, focusing on integrated materials solutions.
  • In March 2025, DuPont de Nemours Inc. introduced a new series of high-selectivity slurries designed to address the complex multi-layer stacks in 3D NAND memory, enabling finer defect control and improved planarization efficiency.
  • In May 2025, Entegris Inc. received a key patent for its innovative slurry filtration system that improves particle removal efficiency by 15%, addressing critical microcontamination challenges in sub-3nm semiconductor manufacturing processes.

Dive into Technavio’s robust research methodology, blending expert interviews, extensive data synthesis, and validated models for unparalleled Chemical Mechanical Planarization (CMP) Equipment Market insights. See full methodology.

Market Scope
Page number 284
Base year 2025
Historic period 2020-2024
Forecast period 2026-2030
Growth momentum & CAGR Accelerate at a CAGR of 5.3%
Market growth 2026-2030 USD 785.6 million
Market structure Fragmented
YoY growth 2025-2026(%) 5.1%
Key countries China, South Korea, Japan, India, Australia, Indonesia, US, Canada, Mexico, Germany, France, UK, Italy, Spain, The Netherlands, Brazil, Argentina, Chile, Israel, UAE, Saudi Arabia, South Africa and Turkey
Competitive landscape Leading Companies, Market Positioning of Companies, Competitive Strategies, and Industry Risks

Request Free Sample

Research Analyst Overview

  • The chemical mechanical planarization (CMP) equipment market is fundamentally shaped by the pursuit of atomic-scale flatness, a requirement for manufacturing next-generation semiconductors. The industry's pivot to gate-all-around (GAA) transistor structures and sub-2nm architectures necessitates innovations in nanometer-scale planarization.
  • This shift drives demand for multi-platen polishing systems with integrated cleaning modules, advanced endpoint detection, and in situ metrology for real-time process feedback. Key boardroom decisions now center on investments in technologies that support 3D-IC hybrid bonding and high-bandwidth memory (HBM) production, which depend on flawless metal-to-metal and dielectric-to-dielectric bonding.
  • Consequently, the use of specialized high-performance consumables, including sacrificial materials and selective liners for multi-material polishing, is non-negotiable. Systems supporting through-silicon via (TSV) and fan-out wafer-level packaging (FOWLP) for back-end-of-line processing are critical. The introduction of nanosheet and nanowire designs requires superior multi-zone pressure control and wafer surface uniformity, achieved with advanced colloidal silica slurry and polishing pad conditioners.
  • For instance, adoption of new wafer thinning systems for silicon carbide (SiC) power electronics and 3D NAND structures has been shown to reduce process variability by 30%.
  • This landscape is further defined by high-numerical aperture EUV lithography requirements, a focus on low-abrasive slurry management, and the use of cryogenic cleaning technologies, dry vacuum pumps, and plasma abatement systems to improve sustainability in semiconductor wafer processing.

What are the Key Data Covered in this Chemical Mechanical Planarization (CMP) Equipment Market Research and Growth Report?

  • What is the expected growth of the Chemical Mechanical Planarization (CMP) Equipment Market between 2026 and 2030?

    • USD 785.6 million, at a CAGR of 5.3%

  • What segmentation does the market report cover?

    • The report is segmented by Application (Foundries, and IDMs), Type (300mm, 200mm, and 150mm), Product Type (CMP equipment, and CMP consumables) and Geography (APAC, North America, Europe, South America, Middle East and Africa)

  • Which regions are analyzed in the report?

    • APAC, North America, Europe, South America and Middle East and Africa

  • What are the key growth drivers and market challenges?

    • Gate-all-around transistor architectures and 2-nanometer node transition, Geopolitical export controls and fragmentation of global equipment

  • Who are the major players in the Chemical Mechanical Planarization (CMP) Equipment Market?

    • 3M Co., Alps Alpine Co. Ltd., AP and S International GmbH, Applied Materials Inc., Axus Technology, BASF SE, DISCO Corp., Dow Chemical Co., DuPont de Nemours Inc., Ebara Corp., Entegris Inc., Entrepix Inc., Kemet International Ltd., Lapmaster Wolters, Logitech Ltd., Merck KGaA, Musashino Denshi Inc., Nachi Fujikoshi Corp., SpeedFam Co. Ltd. and Tokyo Seimitsu Co. Ltd.

Market Research Insights

  • The chemical mechanical planarization (CMP) equipment market is defined by a dynamic interplay of technological advancement and operational efficiency. The adoption of single-wafer polishers is accelerating, with facilities reporting a 15% improvement in process uniformity compared to older batch systems. Innovations in process control software are central, enabling real-time adjustments to polishing pressure optimization and material removal rate.
  • This has led to a significant reduction in wafer defectivity, with some fabs achieving a 10% decrease in scrap rate. The focus on interconnect planarization for advanced nodes drives demand for sophisticated edge profile control.
  • As a result, the integration of automated material handling and predictive maintenance protocols is becoming standard, contributing to higher overall equipment effectiveness and supporting the industry's complex manufacturing requirements.

We can help! Our analysts can customize this chemical mechanical planarization (cmp) equipment market research report to meet your requirements.

Get in touch

1. Executive Summary

1.1 Market overview

Executive Summary - Chart on Market Overview
Executive Summary - Data Table on Market Overview
Executive Summary - Chart on Global Market Characteristics
Executive Summary - Chart on Market by Geography
Executive Summary - Chart on Market Segmentation by Application
Executive Summary - Chart on Market Segmentation by Type
Executive Summary - Chart on Market Segmentation by Product Type
Executive Summary - Chart on Incremental Growth
Executive Summary - Data Table on Incremental Growth
Executive Summary - Chart on Company Market Positioning

2. Technavio Analysis

2.1 Analysis of price sensitivity, lifecycle, customer purchase basket, adoption rates, and purchase criteria

2.2 Criticality of inputs and Factors of differentiation

Chart on Overview on criticality of inputs and factors of differentiation

2.3 Factors of disruption

Chart on Overview on factors of disruption

2.4 Impact of drivers and challenges

Chart on Impact of drivers and challenges in 2025 and 2030

3. Market Landscape

3.1 Market ecosystem

Chart on Parent Market
Data Table on - Parent Market

3.2 Market characteristics

Chart on Market characteristics analysis

3.3 Value chain analysis

Chart on Value chain analysis

4. Market Sizing

4.1 Market definition

Data Table on Offerings of companies included in the market definition

4.2 Market segment analysis

Market segments

4.3 Market size 2025

4.4 Market outlook: Forecast for 2025-2030

Chart on Global - Market size and forecast 2025-2030 ($ million)
Data Table on Global - Market size and forecast 2025-2030 ($ million)
Chart on Global Market: Year-over-year growth 2025-2030 (%)
Data Table on Global Market: Year-over-year growth 2025-2030 (%)

5. Historic Market Size

5.1 Global Chemical Mechanical Planarization (CMP) Equipment Market 2020 - 2024

Historic Market Size - Data Table on Global Chemical Mechanical Planarization (CMP) Equipment Market 2020 - 2024 ($ million)

5.2 Application segment analysis 2020 - 2024

Historic Market Size - Application Segment 2020 - 2024 ($ million)

5.3 Type segment analysis 2020 - 2024

Historic Market Size - Type Segment 2020 - 2024 ($ million)

5.4 Product Type segment analysis 2020 - 2024

Historic Market Size - Product Type Segment 2020 - 2024 ($ million)

5.5 Geography segment analysis 2020 - 2024

Historic Market Size - Geography Segment 2020 - 2024 ($ million)

5.6 Country segment analysis 2020 - 2024

Historic Market Size - Country Segment 2020 - 2024 ($ million)

6. Qualitative Analysis

6.1 Impact of AI in global chemical mechanical planarization (CMP) equipment market

7. Five Forces Analysis

7.1 Five forces summary

Five forces analysis - Comparison between 2025 and 2030

7.2 Bargaining power of buyers

Bargaining power of buyers - Impact of key factors 2025 and 2030

7.3 Bargaining power of suppliers

Bargaining power of suppliers - Impact of key factors in 2025 and 2030

7.4 Threat of new entrants

Threat of new entrants - Impact of key factors in 2025 and 2030

7.5 Threat of substitutes

Threat of substitutes - Impact of key factors in 2025 and 2030

7.6 Threat of rivalry

Threat of rivalry - Impact of key factors in 2025 and 2030

7.7 Market condition

Chart on Market condition - Five forces 2025 and 2030

8. Market Segmentation by Application

8.1 Market segments

Chart on Application - Market share 2025-2030 (%)
Data Table on Application - Market share 2025-2030 (%)

8.2 Comparison by Application

Chart on Comparison by Application
Data Table on Comparison by Application

8.3 Foundries - Market size and forecast 2025-2030

Chart on Foundries - Market size and forecast 2025-2030 ($ million)
Data Table on Foundries - Market size and forecast 2025-2030 ($ million)
Chart on Foundries - Year-over-year growth 2025-2030 (%)
Data Table on Foundries - Year-over-year growth 2025-2030 (%)

8.4 IDMs - Market size and forecast 2025-2030

Chart on IDMs - Market size and forecast 2025-2030 ($ million)
Data Table on IDMs - Market size and forecast 2025-2030 ($ million)
Chart on IDMs - Year-over-year growth 2025-2030 (%)
Data Table on IDMs - Year-over-year growth 2025-2030 (%)

8.5 Market opportunity by Application

Market opportunity by Application ($ million)
Data Table on Market opportunity by Application ($ million)

9. Market Segmentation by Type

9.1 Market segments

Chart on Type - Market share 2025-2030 (%)
Data Table on Type - Market share 2025-2030 (%)

9.2 Comparison by Type

Chart on Comparison by Type
Data Table on Comparison by Type

9.3 300mm - Market size and forecast 2025-2030

Chart on 300mm - Market size and forecast 2025-2030 ($ million)
Data Table on 300mm - Market size and forecast 2025-2030 ($ million)
Chart on 300mm - Year-over-year growth 2025-2030 (%)
Data Table on 300mm - Year-over-year growth 2025-2030 (%)

9.4 200mm - Market size and forecast 2025-2030

Chart on 200mm - Market size and forecast 2025-2030 ($ million)
Data Table on 200mm - Market size and forecast 2025-2030 ($ million)
Chart on 200mm - Year-over-year growth 2025-2030 (%)
Data Table on 200mm - Year-over-year growth 2025-2030 (%)

9.5 150mm - Market size and forecast 2025-2030

Chart on 150mm - Market size and forecast 2025-2030 ($ million)
Data Table on 150mm - Market size and forecast 2025-2030 ($ million)
Chart on 150mm - Year-over-year growth 2025-2030 (%)
Data Table on 150mm - Year-over-year growth 2025-2030 (%)

9.6 Market opportunity by Type

Market opportunity by Type ($ million)
Data Table on Market opportunity by Type ($ million)

10. Market Segmentation by Product Type

10.1 Market segments

Chart on Product Type - Market share 2025-2030 (%)
Data Table on Product Type - Market share 2025-2030 (%)

10.2 Comparison by Product Type

Chart on Comparison by Product Type
Data Table on Comparison by Product Type

10.3 CMP equipment - Market size and forecast 2025-2030

Chart on CMP equipment - Market size and forecast 2025-2030 ($ million)
Data Table on CMP equipment - Market size and forecast 2025-2030 ($ million)
Chart on CMP equipment - Year-over-year growth 2025-2030 (%)
Data Table on CMP equipment - Year-over-year growth 2025-2030 (%)

10.4 CMP consumables - Market size and forecast 2025-2030

Chart on CMP consumables - Market size and forecast 2025-2030 ($ million)
Data Table on CMP consumables - Market size and forecast 2025-2030 ($ million)
Chart on CMP consumables - Year-over-year growth 2025-2030 (%)
Data Table on CMP consumables - Year-over-year growth 2025-2030 (%)

10.5 Market opportunity by Product Type

Market opportunity by Product Type ($ million)
Data Table on Market opportunity by Product Type ($ million)

11. Customer Landscape

11.1 Customer landscape overview

Analysis of price sensitivity, lifecycle, customer purchase basket, adoption rates, and purchase criteria

12. Geographic Landscape

12.1 Geographic segmentation

Chart on Market share by geography 2025-2030 (%)
Data Table on Market share by geography 2025-2030 (%)

12.2 Geographic comparison

Chart on Geographic comparison
Data Table on Geographic comparison

12.3 APAC - Market size and forecast 2025-2030

Chart on APAC - Market size and forecast 2025-2030 ($ million)
Data Table on APAC - Market size and forecast 2025-2030 ($ million)
Chart on APAC - Year-over-year growth 2025-2030 (%)
Data Table on APAC - Year-over-year growth 2025-2030 (%)
Chart on Regional Comparison - APAC
Data Table on Regional Comparison - APAC

12.3.1 China - Market size and forecast 2025-2030

Chart on China - Market size and forecast 2025-2030 ($ million)
Data Table on China - Market size and forecast 2025-2030 ($ million)
Chart on China - Year-over-year growth 2025-2030 (%)
Data Table on China - Year-over-year growth 2025-2030 (%)

12.3.2 South Korea - Market size and forecast 2025-2030

Chart on South Korea - Market size and forecast 2025-2030 ($ million)
Data Table on South Korea - Market size and forecast 2025-2030 ($ million)
Chart on South Korea - Year-over-year growth 2025-2030 (%)
Data Table on South Korea - Year-over-year growth 2025-2030 (%)

12.3.3 Japan - Market size and forecast 2025-2030

Chart on Japan - Market size and forecast 2025-2030 ($ million)
Data Table on Japan - Market size and forecast 2025-2030 ($ million)
Chart on Japan - Year-over-year growth 2025-2030 (%)
Data Table on Japan - Year-over-year growth 2025-2030 (%)

12.3.4 India - Market size and forecast 2025-2030

Chart on India - Market size and forecast 2025-2030 ($ million)
Data Table on India - Market size and forecast 2025-2030 ($ million)
Chart on India - Year-over-year growth 2025-2030 (%)
Data Table on India - Year-over-year growth 2025-2030 (%)

12.3.5 Australia - Market size and forecast 2025-2030

Chart on Australia - Market size and forecast 2025-2030 ($ million)
Data Table on Australia - Market size and forecast 2025-2030 ($ million)
Chart on Australia - Year-over-year growth 2025-2030 (%)
Data Table on Australia - Year-over-year growth 2025-2030 (%)

12.3.6 Indonesia - Market size and forecast 2025-2030

Chart on Indonesia - Market size and forecast 2025-2030 ($ million)
Data Table on Indonesia - Market size and forecast 2025-2030 ($ million)
Chart on Indonesia - Year-over-year growth 2025-2030 (%)
Data Table on Indonesia - Year-over-year growth 2025-2030 (%)

12.4 North America - Market size and forecast 2025-2030

Chart on North America - Market size and forecast 2025-2030 ($ million)
Data Table on North America - Market size and forecast 2025-2030 ($ million)
Chart on North America - Year-over-year growth 2025-2030 (%)
Data Table on North America - Year-over-year growth 2025-2030 (%)
Chart on Regional Comparison - North America
Data Table on Regional Comparison - North America

12.4.1 US - Market size and forecast 2025-2030

Chart on US - Market size and forecast 2025-2030 ($ million)
Data Table on US - Market size and forecast 2025-2030 ($ million)
Chart on US - Year-over-year growth 2025-2030 (%)
Data Table on US - Year-over-year growth 2025-2030 (%)

12.4.2 Canada - Market size and forecast 2025-2030

Chart on Canada - Market size and forecast 2025-2030 ($ million)
Data Table on Canada - Market size and forecast 2025-2030 ($ million)
Chart on Canada - Year-over-year growth 2025-2030 (%)
Data Table on Canada - Year-over-year growth 2025-2030 (%)

12.4.3 Mexico - Market size and forecast 2025-2030

Chart on Mexico - Market size and forecast 2025-2030 ($ million)
Data Table on Mexico - Market size and forecast 2025-2030 ($ million)
Chart on Mexico - Year-over-year growth 2025-2030 (%)
Data Table on Mexico - Year-over-year growth 2025-2030 (%)

12.5 Europe - Market size and forecast 2025-2030

Chart on Europe - Market size and forecast 2025-2030 ($ million)
Data Table on Europe - Market size and forecast 2025-2030 ($ million)
Chart on Europe - Year-over-year growth 2025-2030 (%)
Data Table on Europe - Year-over-year growth 2025-2030 (%)
Chart on Regional Comparison - Europe
Data Table on Regional Comparison - Europe

12.5.1 Germany - Market size and forecast 2025-2030

Chart on Germany - Market size and forecast 2025-2030 ($ million)
Data Table on Germany - Market size and forecast 2025-2030 ($ million)
Chart on Germany - Year-over-year growth 2025-2030 (%)
Data Table on Germany - Year-over-year growth 2025-2030 (%)

12.5.2 France - Market size and forecast 2025-2030

Chart on France - Market size and forecast 2025-2030 ($ million)
Data Table on France - Market size and forecast 2025-2030 ($ million)
Chart on France - Year-over-year growth 2025-2030 (%)
Data Table on France - Year-over-year growth 2025-2030 (%)

12.5.3 UK - Market size and forecast 2025-2030

Chart on UK - Market size and forecast 2025-2030 ($ million)
Data Table on UK - Market size and forecast 2025-2030 ($ million)
Chart on UK - Year-over-year growth 2025-2030 (%)
Data Table on UK - Year-over-year growth 2025-2030 (%)

12.5.4 Italy - Market size and forecast 2025-2030

Chart on Italy - Market size and forecast 2025-2030 ($ million)
Data Table on Italy - Market size and forecast 2025-2030 ($ million)
Chart on Italy - Year-over-year growth 2025-2030 (%)
Data Table on Italy - Year-over-year growth 2025-2030 (%)

12.5.5 Spain - Market size and forecast 2025-2030

Chart on Spain - Market size and forecast 2025-2030 ($ million)
Data Table on Spain - Market size and forecast 2025-2030 ($ million)
Chart on Spain - Year-over-year growth 2025-2030 (%)
Data Table on Spain - Year-over-year growth 2025-2030 (%)

12.5.6 The Netherlands - Market size and forecast 2025-2030

Chart on The Netherlands - Market size and forecast 2025-2030 ($ million)
Data Table on The Netherlands - Market size and forecast 2025-2030 ($ million)
Chart on The Netherlands - Year-over-year growth 2025-2030 (%)
Data Table on The Netherlands - Year-over-year growth 2025-2030 (%)

12.6 South America - Market size and forecast 2025-2030

Chart on South America - Market size and forecast 2025-2030 ($ million)
Data Table on South America - Market size and forecast 2025-2030 ($ million)
Chart on South America - Year-over-year growth 2025-2030 (%)
Data Table on South America - Year-over-year growth 2025-2030 (%)
Chart on Regional Comparison - South America
Data Table on Regional Comparison - South America

12.6.1 Brazil - Market size and forecast 2025-2030

Chart on Brazil - Market size and forecast 2025-2030 ($ million)
Data Table on Brazil - Market size and forecast 2025-2030 ($ million)
Chart on Brazil - Year-over-year growth 2025-2030 (%)
Data Table on Brazil - Year-over-year growth 2025-2030 (%)

12.6.2 Argentina - Market size and forecast 2025-2030

Chart on Argentina - Market size and forecast 2025-2030 ($ million)
Data Table on Argentina - Market size and forecast 2025-2030 ($ million)
Chart on Argentina - Year-over-year growth 2025-2030 (%)
Data Table on Argentina - Year-over-year growth 2025-2030 (%)

12.6.3 Chile - Market size and forecast 2025-2030

Chart on Chile - Market size and forecast 2025-2030 ($ million)
Data Table on Chile - Market size and forecast 2025-2030 ($ million)
Chart on Chile - Year-over-year growth 2025-2030 (%)
Data Table on Chile - Year-over-year growth 2025-2030 (%)

12.7 Middle East and Africa - Market size and forecast 2025-2030

Chart on Middle East and Africa - Market size and forecast 2025-2030 ($ million)
Data Table on Middle East and Africa - Market size and forecast 2025-2030 ($ million)
Chart on Middle East and Africa - Year-over-year growth 2025-2030 (%)
Data Table on Middle East and Africa - Year-over-year growth 2025-2030 (%)
Chart on Regional Comparison - Middle East and Africa
Data Table on Regional Comparison - Middle East and Africa

12.7.1 Israel - Market size and forecast 2025-2030

Chart on Israel - Market size and forecast 2025-2030 ($ million)
Data Table on Israel - Market size and forecast 2025-2030 ($ million)
Chart on Israel - Year-over-year growth 2025-2030 (%)
Data Table on Israel - Year-over-year growth 2025-2030 (%)

12.7.2 UAE - Market size and forecast 2025-2030

Chart on UAE - Market size and forecast 2025-2030 ($ million)
Data Table on UAE - Market size and forecast 2025-2030 ($ million)
Chart on UAE - Year-over-year growth 2025-2030 (%)
Data Table on UAE - Year-over-year growth 2025-2030 (%)

12.7.3 Saudi Arabia - Market size and forecast 2025-2030

Chart on Saudi Arabia - Market size and forecast 2025-2030 ($ million)
Data Table on Saudi Arabia - Market size and forecast 2025-2030 ($ million)
Chart on Saudi Arabia - Year-over-year growth 2025-2030 (%)
Data Table on Saudi Arabia - Year-over-year growth 2025-2030 (%)

12.7.4 South Africa - Market size and forecast 2025-2030

Chart on South Africa - Market size and forecast 2025-2030 ($ million)
Data Table on South Africa - Market size and forecast 2025-2030 ($ million)
Chart on South Africa - Year-over-year growth 2025-2030 (%)
Data Table on South Africa - Year-over-year growth 2025-2030 (%)

12.7.5 Turkey - Market size and forecast 2025-2030

Chart on Turkey - Market size and forecast 2025-2030 ($ million)
Data Table on Turkey - Market size and forecast 2025-2030 ($ million)
Chart on Turkey - Year-over-year growth 2025-2030 (%)
Data Table on Turkey - Year-over-year growth 2025-2030 (%)

12.8 Market opportunity by geography

Market opportunity by geography ($ million)
Data Tables on Market opportunity by geography ($ million)

13. Drivers, Challenges, and Opportunity

13.1 Market drivers

Gate-all-around transistor architectures and 2-nanometer node transition
High-bandwidth memory (HBM) and industrialization of 3D-IC hybrid bonding
Wide-bandgap semiconductors and rise of silicon carbide (SIC) power electronics

13.2 Market challenges

Geopolitical export controls and fragmentation of global equipment
Technological complexity and nanometer-scale planarization of sub-2nm architectures
Supply chain fragility and scarcity of high-performance consumables

13.3 Impact of drivers and challenges

Impact of drivers and challenges in 2025 and 2030

13.4 Market opportunities

Proliferation of 3D integration and hybrid bonding in advanced packaging nodes
Institutionalization of AI and real-time algorithmic process control
Sustainability protocols and rise of low-abrasive slurry management

14. Competitive Landscape

14.1 Overview

14.2

Overview on criticality of inputs and factors of differentiation

14.3 Landscape disruption

Overview on factors of disruption

14.4 Industry risks

Impact of key risks on business

15. Competitive Analysis

15.1 Companies profiled

Companies covered

15.2 Company ranking index

15.3 Market positioning of companies

Matrix on companies position and classification

15.4 3M Co.

3M Co. - Overview
3M Co. - Business segments
3M Co. - Key news
3M Co. - Key offerings
3M Co. - Segment focus
SWOT

15.5 Alps Alpine Co. Ltd.

Alps Alpine Co. Ltd. - Overview
Alps Alpine Co. Ltd. - Business segments
Alps Alpine Co. Ltd. - Key news
Alps Alpine Co. Ltd. - Key offerings
Alps Alpine Co. Ltd. - Segment focus
SWOT

15.6 AP and S International GmbH

AP and S International GmbH - Overview
AP and S International GmbH - Product / Service
AP and S International GmbH - Key offerings
SWOT

15.7 Applied Materials Inc.

Applied Materials Inc. - Overview
Applied Materials Inc. - Business segments
Applied Materials Inc. - Key offerings
Applied Materials Inc. - Segment focus
SWOT

15.8 BASF SE

BASF SE - Overview
BASF SE - Business segments
BASF SE - Key news
BASF SE - Key offerings
BASF SE - Segment focus
SWOT

15.9 DISCO Corp.

DISCO Corp. - Overview
DISCO Corp. - Business segments
DISCO Corp. - Key offerings
DISCO Corp. - Segment focus
SWOT

15.10 Dow Chemical Co.

Dow Chemical Co. - Overview
Dow Chemical Co. - Business segments
Dow Chemical Co. - Key news
Dow Chemical Co. - Key offerings
Dow Chemical Co. - Segment focus
SWOT

15.11 DuPont de Nemours Inc.

DuPont de Nemours Inc. - Overview
DuPont de Nemours Inc. - Business segments
DuPont de Nemours Inc. - Key news
DuPont de Nemours Inc. - Key offerings
DuPont de Nemours Inc. - Segment focus
SWOT

15.12 Ebara Corp.

Ebara Corp. - Overview
Ebara Corp. - Business segments
Ebara Corp. - Key offerings
Ebara Corp. - Segment focus
SWOT

15.13 Entegris Inc.

Entegris Inc. - Overview
Entegris Inc. - Business segments
Entegris Inc. - Key offerings
Entegris Inc. - Segment focus
SWOT

15.14 Entrepix Inc.

Entrepix Inc. - Overview
Entrepix Inc. - Product / Service
Entrepix Inc. - Key offerings
SWOT

15.15 Merck KGaA

Merck KGaA - Overview
Merck KGaA - Business segments
Merck KGaA - Key news
Merck KGaA - Key offerings
Merck KGaA - Segment focus
SWOT

15.16 Nachi Fujikoshi Corp.

Nachi Fujikoshi Corp. - Overview
Nachi Fujikoshi Corp. - Business segments
Nachi Fujikoshi Corp. - Key news
Nachi Fujikoshi Corp. - Key offerings
Nachi Fujikoshi Corp. - Segment focus
SWOT

15.17 SpeedFam Co. Ltd.

SpeedFam Co. Ltd. - Overview
SpeedFam Co. Ltd. - Product / Service
SpeedFam Co. Ltd. - Key offerings
SWOT

15.18 Tokyo Seimitsu Co. Ltd.

Tokyo Seimitsu Co. Ltd. - Overview
Tokyo Seimitsu Co. Ltd. - Business segments
Tokyo Seimitsu Co. Ltd. - Key offerings
Tokyo Seimitsu Co. Ltd. - Segment focus
SWOT

16. Appendix

16.1 Scope of the report

Market definition
Objectives
Notes and caveats

16.2 Inclusions and exclusions checklist

Inclusions checklist
Exclusions checklist

16.3 Currency conversion rates for US$

16.4 Research methodology

16.5 Data procurement

Information sources

16.6 Data validation

16.7 Validation techniques employed for market sizing

16.8 Data synthesis

16.9 360 degree market analysis

16.10 List of abbreviations

Research Methodology

Technavio presents a detailed picture of the market by way of study, synthesis, and summation of data from multiple sources. The analysts have presented the various facets of the market with a particular focus on identifying the key industry influencers. The data thus presented is comprehensive, reliable, and the result of extensive research, both primary and secondary.

INFORMATION SOURCES

Primary sources

  • Manufacturers and suppliers
  • Channel partners
  • Industry experts
  • Strategic decision makers

Secondary sources

  • Industry journals and periodicals
  • Government data
  • Financial reports of key industry players
  • Historical data
  • Press releases

DATA ANALYSIS

Data Synthesis

  • Collation of data
  • Estimation of key figures
  • Analysis of derived insights

Data Validation

  • Triangulation with data models
  • Reference against proprietary databases
  • Corroboration with industry experts

REPORT WRITING

Qualitative

  • Market drivers
  • Market challenges
  • Market trends
  • Five forces analysis

Quantitative

  • Market size and forecast
  • Market segmentation
  • Geographical insights
  • Competitive landscape

Interested in this report?

Get your sample now to see our research methodology and insights!

Download Now

Frequently Asked Questions

Chemical Mechanical Planarization (CMP) Equipment market growth will increase by USD 785.6 million during 2026-2030.

The Chemical Mechanical Planarization (CMP) Equipment market is expected to grow at a CAGR of 5.3% during 2026-2030.

Chemical Mechanical Planarization (CMP) Equipment market is segmented by Application (Foundries, IDMs) Type (300mm, 200mm, 150mm) Product type (CMP equipment, CMP consumables)

3M Co., Alps Alpine Co. Ltd., AP and S International GmbH, Applied Materials Inc., Axus Technology, BASF SE, DISCO Corp., Dow Chemical Co., DuPont de Nemours Inc., Ebara Corp., Entegris Inc., Entrepix Inc., Kemet International Ltd., Lapmaster Wolters, Logitech Ltd., Merck KGaA, Musashino Denshi Inc., Nachi Fujikoshi Corp., SpeedFam Co. Ltd., Tokyo Seimitsu Co. Ltd. are a few of the key vendors in the Chemical Mechanical Planarization (CMP) Equipment market.

APAC will register the highest growth rate of 39.1% among the other regions. Therefore, the Chemical Mechanical Planarization (CMP) Equipment market in APAC is expected to garner significant business opportunities for the vendors during the forecast period.

China, South Korea, Japan, India, Australia, Indonesia, US, Canada, Mexico, Germany, France, UK, Italy, Spain, The Netherlands, Brazil, Argentina, Chile, Israel, UAE, Saudi Arabia, South Africa, Turkey

  • Gate-all-around transistor architectures and 2-nanometer node transition is the driving factor this market.

The Chemical Mechanical Planarization (CMP) Equipment market vendors should focus on grabbing business opportunities from the Application segment as it accounted for the largest market share in the base year.