Colorants Market Analysis, Size, and Forecast 2026-2030: APAC (China, India, and Japan), North America (US, Canada, and Mexico), Europe (Germany, France, and Italy), South America (Brazil and Argentina), Middle East and Africa (Saudi Arabia, UAE, and South Africa), and Rest of World (ROW)

Colorants Market Analysis, Size, and Forecast 2026-2030:
APAC (China, India, and Japan), North America (US, Canada, and Mexico), Europe (Germany, France, and Italy), South America (Brazil and Argentina), Middle East and Africa (Saudi Arabia, UAE, and South Africa), and Rest of World (ROW)

Published: Mar 2026 334 Pages SKU: IRTNTR72831

Market Overview at a Glance

$26.77 B
Market Opportunity
6.3%
CAGR 2025 - 2030
39.2%
APAC Growth
$31.12 B
Pigment segment 2024

Colorants Market Size 2026-2030

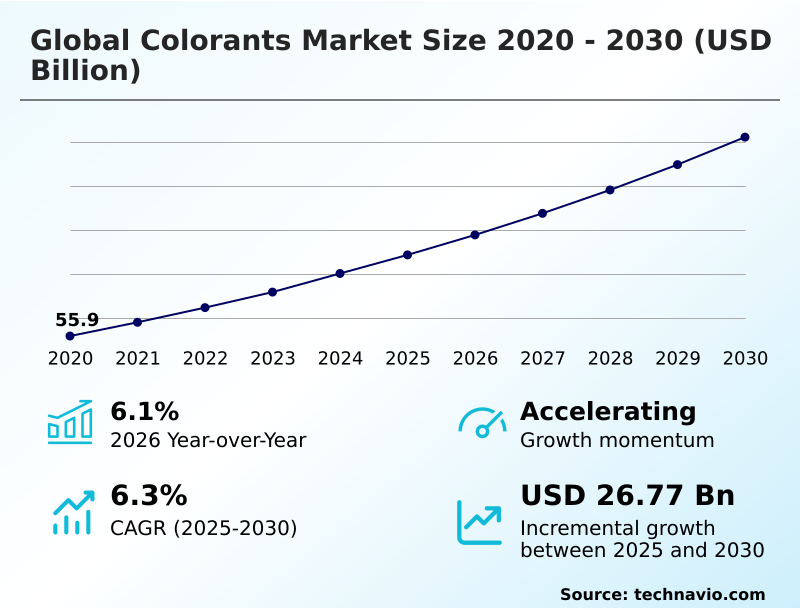
The colorants market size is valued to increase by USD 26.77 billion, at a CAGR of 6.3% from 2025 to 2030. Robust expansion in global packaging sector will drive the colorants market.

Major Market Trends & Insights

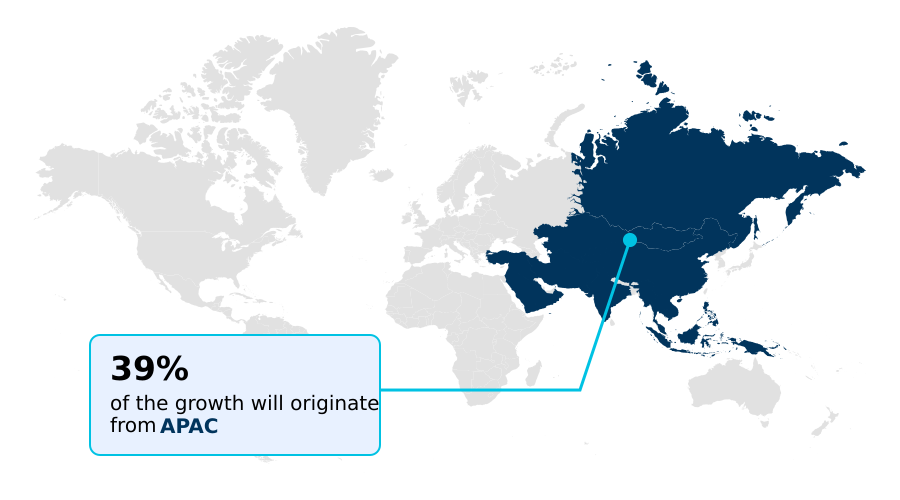
  • APAC dominated the market and accounted for a 39.2% growth during the forecast period.
  • By Type - Pigment segment was valued at USD 31.12 billion in 2024
  • By End-user - Paints and coatings segment accounted for the largest market revenue share in 2024

Market Size & Forecast

  • Market Opportunities: USD 45.21 billion
  • Market Future Opportunities: USD 26.77 billion
  • CAGR from 2025 to 2030 : 6.3%

Market Summary

  • The colorants market is a dynamic and essential industry, providing the foundational materials for visual appeal and functional properties across countless sectors. Growth is driven by expanding end-use markets like packaging and construction, where color is critical for branding, safety, and aesthetics. Key trends are reshaping the competitive landscape, most notably the significant pivot towards sustainability.
  • This shift promotes the adoption of natural colorants and bio-based colorants over traditional synthetic options, particularly in food and cosmetics. Simultaneously, technological advancement continues to push performance boundaries with the development of high performance pigments and specialty dyes that offer superior durability and unique visual effects.
  • For instance, an automotive supplier must navigate these dual pressures by investing in R&D for a new line of water-borne colorants. The goal is to develop a colorant formulation that provides the brilliant finish of legacy solvent-borne colorants while complying with stringent VOC emission standards.
  • This requires balancing performance attributes like lightfastness and weather resistance with the technical challenges of pigment dispersion in aqueous systems. Intense market competition and raw material price volatility add further complexity, compelling manufacturers to focus on innovation and operational efficiency to maintain margins.

What will be the Size of the Colorants Market during the forecast period?

Get Key Insights on Market Forecast (PDF) Request Free Sample

How is the Colorants Market Segmented?

The colorants industry research report provides comprehensive data (region-wise segment analysis), with forecasts and estimates in "USD million" for the period 2026-2030, as well as historical data from 2020-2024 for the following segments.
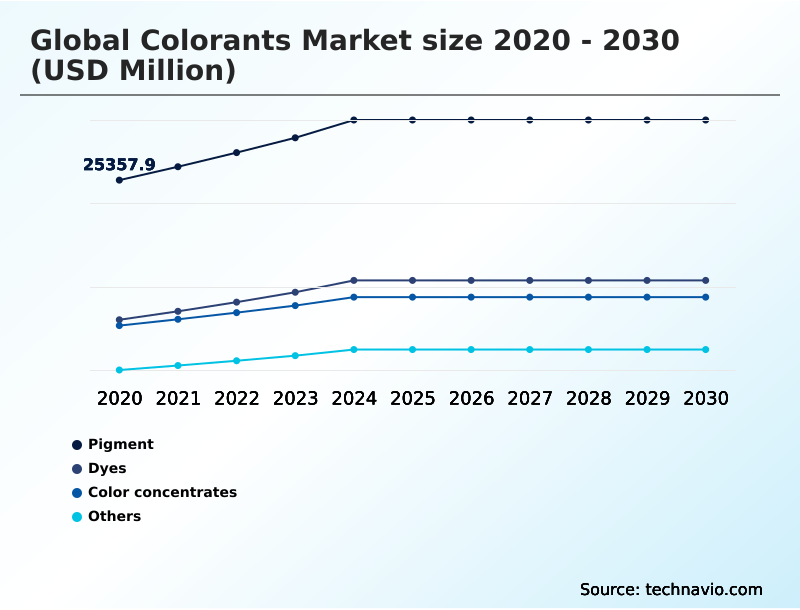
  • Type
    • Pigment
    • Dyes
    • Color concentrates
    • Others
  • End-user
    • Paints and coatings
    • Textile
    • Personal care
    • Food
    • Others
  • Product type
    • Solvent‑borne colorants
    • Water‑borne colorants
    • Natural and bio‑based colorants
  • Geography
    • APAC
      • China
      • India
      • Japan
    • North America
      • US
      • Canada
      • Mexico
    • Europe
      • Germany
      • France
      • Italy
    • South America
      • Brazil
      • Argentina
    • Middle East and Africa
      • Saudi Arabia
      • UAE
      • South Africa
    • Rest of World (ROW)

By Type Insights

The pigment segment is estimated to witness significant growth during the forecast period.

The pigment segment is defined by materials that provide color through insoluble particulate matter. These materials, including both organic pigments and inorganic options like titanium dioxide pigments, are foundational to achieving desired aesthetics and functionality.

Success depends on achieving optimal pigment dispersion within a medium to ensure consistent chromaticity and opacity. The market also includes advanced forms like color concentrates and functional pyrogenic materials that modify surface properties.

High standards for performance, such as lightfastness and color fastness, are critical, with advanced color matching technologies ensuring that over 98% of production batches meet precise specifications.

This focus on quality and performance underscores the segment's role in delivering value beyond basic coloration.

Request Free Sample

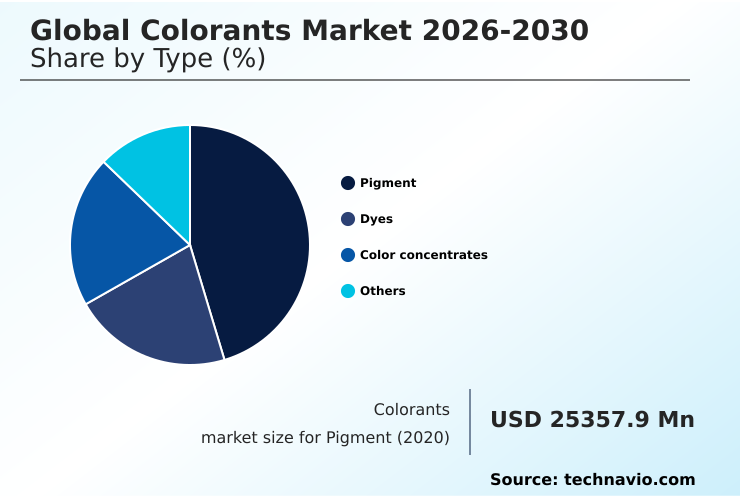
The Pigment segment was valued at USD 31.12 billion in 2024 and showed a gradual increase during the forecast period.

Request Free Sample

Regional Analysis

APAC is estimated to contribute 39.2% to the growth of the global market during the forecast period.Technavio’s analysts have elaborately explained the regional trends and drivers that shape the market during the forecast period.

See How Colorants Market Demand is Rising in APAC Request Free Sample

The geographic landscape of the colorants market is defined by regional specialization and regulatory divergence. APAC leads in production volume, contributing over 39% of incremental growth, driven by its manufacturing prowess in textiles and plastics.

Europe remains a hub for innovation in high-value products like pearlescent pigments and metallic effect pigments for industrial coatings, governed by stringent REACH regulations that increase colorant formulation complexity.

North America demonstrates strong demand for specialty applications, including FDA-approved food grade colorants and cosmetic colorants, where compliance can represent up to 15% of development costs.

South America is emerging as a key source for natural colorants, capitalizing on its biodiversity to serve global clean-label trends.

Market Dynamics

Our researchers analyzed the data with 2025 as the base year, along with the key drivers, trends, and challenges. A holistic analysis of drivers will help companies refine their marketing strategies to gain a competitive advantage.

  • The modern colorants market is defined by specialization, with manufacturers developing highly tailored solutions for specific industrial needs. The demand for high performance pigments for automotive coatings continues to push innovation toward materials offering superior durability and complex finishes. Simultaneously, consumer-facing industries are driving change.
  • The widespread call for clean-label products fuels the development of natural colorants for food and beverage applications, while the fashion industry seeks eco-friendly dyes for the textile industry to meet sustainability mandates. Navigating regulatory compliance for cosmetic pigments remains a critical and resource-intensive activity for suppliers in the personal care space.
  • In packaging, there is a strong focus on both aesthetics and circularity, leading to advanced masterbatch solutions for plastic packaging and bio-based colorants for sustainable packaging. The construction sector demands robust products, such as uv stable pigments for architectural coatings and infrared reflective pigments for cool roofing, which enhance building longevity and energy efficiency.
  • Formulators of water-borne dispersions for printing inks are focused on achieving performance parity with traditional systems. This contrasts with legacy applications like solvent-borne dyes for leather finishing, where performance often still outweighs environmental concerns. The push to eliminate harmful substances is evident in the creation of heavy metal free inorganic pigments.
  • For advanced manufacturing, thermally stable pigments for polymer processing and color concentrates for engineering plastics are essential. The market also sees innovation in lightfast dyes for technical textiles, low-voc colorants for industrial coatings, and food contact compliant masterbatches. Technology-driven applications require high purity pigments for electronic displays and special effect pigments for consumer electronics.
  • The evolution toward a circular economy is further supported by new digital textile printing dye formulations that reduce waste and research into biodegradable colorants for single-use plastics, where adoption of such solutions can reduce landfill contributions from packaging by over 30% compared to non-degradable alternatives.

What are the key market drivers leading to the rise in the adoption of Colorants Industry?

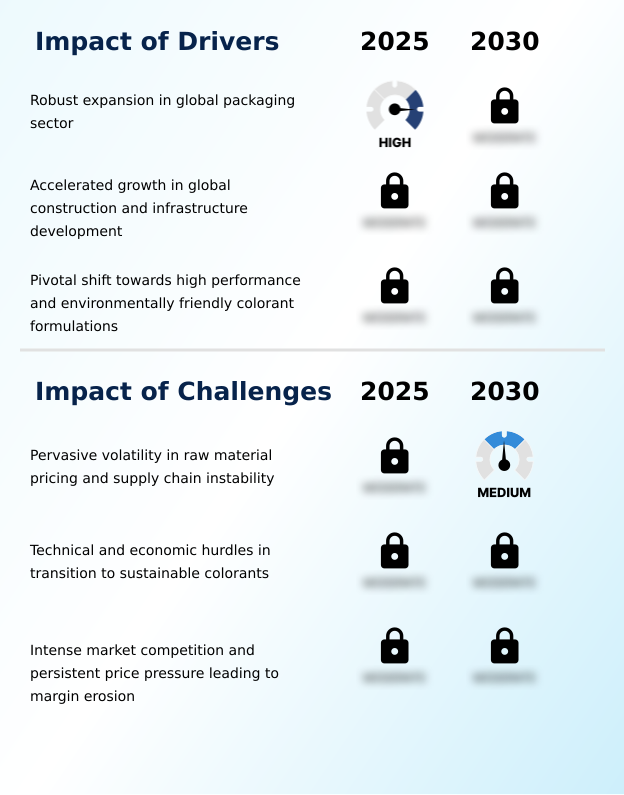
  • The robust expansion of the global packaging sector serves as a primary driver for market growth, fueling demand for a diverse palette of colorants used for branding and product differentiation.

  • Growth in the market is propelled by robust expansion in end-use industries. The global construction boom fuels demand for architectural coatings, where durable iron oxide pigments and carbon black pigments are essential.
  • The automotive sector's demand for finishes with complex effects and superior durability drives innovation in high performance pigments with controlled pigment particle size for flawless automotive coatings.
  • The plastics industry relies heavily on masterbatches for efficient and consistent coloration, with formulations engineered for high thermal stability during processing.
  • In textiles, reactive dyes remain crucial for achieving vibrant, lasting colors on natural fibers, with advancements improving substrate adhesion rates by over 15%, thereby reducing processing waste and cost.

What are the market trends shaping the Colorants Industry?

  • The ascendancy of natural colorants represents a significant market trend. This structural shift is driven by increasing consumer demand for sustainable and clean-label products across multiple industries.

  • The global colorants market is increasingly shaped by the push for sustainability and technological innovation. The adoption of natural colorants and bio-based colorants is accelerating, particularly in consumer-facing sectors, with some formulations achieving a 25% improvement in uv stability through advanced microencapsulation.
  • Concurrently, demand for high-performance materials drives the development of specialty dyes and nano colorants that offer superior tinting strength and unique properties. The shift from solvent-based systems to water-borne colorants now accounts for a majority of the architectural coatings market.
  • This evolution is also seen in textile dyeing and the formulation of digital printing inks, where technologies that reduce water usage by up to 90% are gaining traction, enhancing both efficiency and weather resistance.

What challenges does the Colorants Industry face during its growth?

  • Pervasive volatility in raw material pricing and persistent supply chain instability present a key challenge to the industry's growth trajectory and profitability.

  • Navigating the market involves significant challenges, primarily related to regulatory compliance and operational costs. The use of certain azo dyes is increasingly restricted, forcing reformulation efforts that can increase R&D expenses by 20-30%. In the textile industry, the application of disperse dyes, vat dyes, and acid dyes generates significant wastewater, making effluent treatment a major operational cost.
  • The persistence of solvent-borne colorants in niche applications poses ongoing environmental concerns. Technical hurdles include managing dye solubility and preventing color migration in complex applications, which requires sophisticated color management systems and quality control, adding layers of complexity to production processes for many manufacturers.

Exclusive Technavio Analysis on Customer Landscape

The colorants market forecasting report includes the adoption lifecycle of the market, covering from the innovator’s stage to the laggard’s stage. It focuses on adoption rates in different regions based on penetration. Furthermore, the colorants market report also includes key purchase criteria and drivers of price sensitivity to help companies evaluate and develop their market growth analysis strategies.

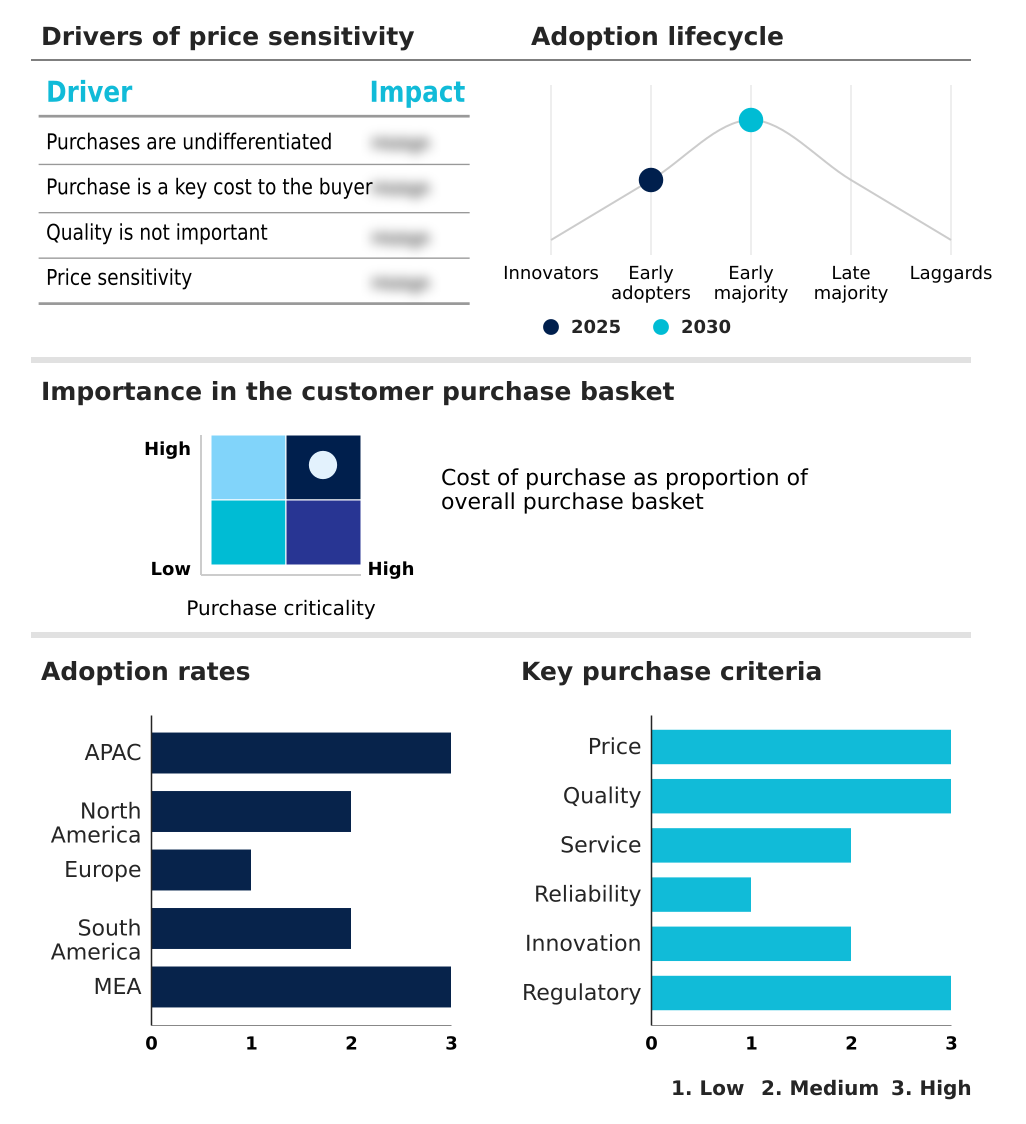
Customer Landscape of Colorants Industry

Competitive Landscape

Companies are implementing various strategies, such as strategic alliances, colorants market forecast, partnerships, mergers and acquisitions, geographical expansion, and product/service launches, to enhance their presence in the industry.

Ampacet Corp. - The market provides advanced color solutions, from high-performance pigments to specialty dyes, enabling product differentiation and functional enhancement across diverse industrial applications.

The industry research and growth report includes detailed analyses of the competitive landscape of the market and information about key companies, including:

  • Ampacet Corp.
  • Archroma Management
  • Atul Ltd.
  • Avient Corp.
  • BASF SE
  • Cabot Corp.
  • ChromaScape LLC
  • DIC Corp.
  • DuPont de Nemours Inc.
  • DyStar Group
  • Flint Group
  • Heubach Group
  • Holland Colours NV
  • Kiri Industries Ltd.
  • Kronos Worldwide Inc.
  • Lanxess AG
  • LyondellBasell Industries NV
  • Sensient Technologies Corp.
  • Sudarshan Chemical Industries
  • Vibrantz Technologies

Qualitative and quantitative analysis of companies has been conducted to help clients understand the wider business environment as well as the strengths and weaknesses of key industry players. Data is qualitatively analyzed to categorize companies as pure play, category-focused, industry-focused, and diversified; it is quantitatively analyzed to categorize companies as dominant, leading, strong, tentative, and weak.

Recent Development and News in Colorants market

  • In October 2024, Avient Corp. launched its Colorant Chromatics Metallic Effect Pre-Colored Sulfone Formulations, developed with BASF to offer a sustainable alternative to painting high-performance polymers.
  • In November 2024, Avient Corp. introduced its Colorant Chromatics Transcend Biocompatible PEEK Pre-Colored Compounds and Colorants, designed specifically for the rigorous demands of healthcare and medical applications.
  • In February 2025, Sudarshan Chemical Industries Ltd. launched a new range of high-performance organic pigments for the coatings, plastics, and inks sectors, engineered for enhanced color strength and weather resistance.
  • In March 2025, Dohler North America acquired Premier Juices to strengthen its portfolio of natural, fruit-based ingredients and colorants for the clean-label food and beverage market.

Dive into Technavio’s robust research methodology, blending expert interviews, extensive data synthesis, and validated models for unparalleled Colorants Market insights. See full methodology.

Market Scope
Page number 334
Base year 2025
Historic period 2020-2024
Forecast period 2026-2030
Growth momentum & CAGR Accelerate at a CAGR of 6.3%
Market growth 2026-2030 USD 26774.0 million
Market structure Fragmented
YoY growth 2025-2026(%) 6.1%
Key countries China, India, Japan, South Korea, Australia, Indonesia, US, Canada, Mexico, Germany, France, Italy, UK, Spain, The Netherlands, Brazil, Argentina, Chile, Saudi Arabia, UAE, South Africa, Egypt and Nigeria
Competitive landscape Leading Companies, Market Positioning of Companies, Competitive Strategies, and Industry Risks

Request Free Sample

Research Analyst Overview

  • The colorants market is evolving beyond simple coloration toward providing functional and sustainable material solutions. Boardroom-level strategy is now heavily influenced by the need to balance performance with stringent global regulations.
  • The development of high performance pigments and specialty dyes is critical for penetrating high-value sectors, while the shift to water-borne colorants and bio-based colorants is a direct response to environmental pressures. Manufacturers must master complex colorant formulation techniques involving organic pigments, inorganic pigments, and even nano colorants to meet diverse application needs.
  • The efficient use of masterbatches and color concentrates is key to operational excellence in plastics, where companies that optimize these systems see an average 15% reduction in material waste. The portfolio spans from commodity iron oxide pigments and carbon black pigments to advanced pearlescent pigments.
  • It includes various dye classes like reactive dyes and disperse dyes, with pressure to replace certain azo dyes. This complex landscape requires continuous investment in technology, from pigment dispersion methods to the creation of novel metallic effect pigments and the use of pyrogenic materials.

What are the Key Data Covered in this Colorants Market Research and Growth Report?

  • What is the expected growth of the Colorants Market between 2026 and 2030?

    • USD 26.77 billion, at a CAGR of 6.3%

  • What segmentation does the market report cover?

    • The report is segmented by Type (Pigment, Dyes, Color concentrates, and Others), End-user (Paints and coatings, Textile, Personal care, Food, and Others), Product Type (Solvent‑borne colorants, Water‑borne colorants, and Natural and bio‑based colorants) and Geography (APAC, North America, Europe, South America, Middle East and Africa)

  • Which regions are analyzed in the report?

    • APAC, North America, Europe, South America and Middle East and Africa

  • What are the key growth drivers and market challenges?

    • Robust expansion in global packaging sector, Pervasive volatility in raw material pricing and supply chain instability

  • Who are the major players in the Colorants Market?

    • Ampacet Corp., Archroma Management, Atul Ltd., Avient Corp., BASF SE, Cabot Corp., ChromaScape LLC, DIC Corp., DuPont de Nemours Inc., DyStar Group, Flint Group, Heubach Group, Holland Colours NV, Kiri Industries Ltd., Kronos Worldwide Inc., Lanxess AG, LyondellBasell Industries NV, Sensient Technologies Corp., Sudarshan Chemical Industries and Vibrantz Technologies

Market Research Insights

  • Market dynamics are increasingly shaped by performance requirements and regional manufacturing trends. Buyers prioritize quality, with purchasing decisions only neutrally sensitive to price, focusing instead on attributes like lightfastness and substrate adhesion. The push for sustainable solutions drives innovation in effluent treatment processes, where advanced systems can reduce water contamination by over 85%.
  • In plastics, achieving high thermal stability during processing is a critical differentiator. Geographically, companies aligning with APAC demand see a 40% higher growth potential compared to those focused on mature markets. This reflects the region's dominance in textile dyeing and plastics coloration.
  • Advanced color management systems are crucial for maintaining brand consistency across these global supply chains, ensuring precise color matching for everything from architectural coatings to cosmetic colorants.

We can help! Our analysts can customize this colorants market research report to meet your requirements.

Get in touch

1. Executive Summary

1.1 Market overview

Executive Summary - Chart on Market Overview
Executive Summary - Data Table on Market Overview
Executive Summary - Chart on Global Market Characteristics
Executive Summary - Chart on Market by Geography
Executive Summary - Chart on Market Segmentation by Type
Executive Summary - Chart on Market Segmentation by End-user
Executive Summary - Chart on Market Segmentation by Product Type
Executive Summary - Chart on Incremental Growth
Executive Summary - Data Table on Incremental Growth
Executive Summary - Chart on Company Market Positioning

2. Technavio Analysis

2.1 Analysis of price sensitivity, lifecycle, customer purchase basket, adoption rates, and purchase criteria

2.2 Criticality of inputs and Factors of differentiation

Chart on Overview on criticality of inputs and factors of differentiation

2.3 Factors of disruption

Chart on Overview on factors of disruption

2.4 Impact of drivers and challenges

Chart on Impact of drivers and challenges in 2025 and 2030

3. Market Landscape

3.1 Market ecosystem

Chart on Parent Market
Data Table on - Parent Market

3.2 Market characteristics

Chart on Market characteristics analysis

3.3 Value chain analysis

Chart on Value chain analysis

4. Market Sizing

4.1 Market definition

Data Table on Offerings of companies included in the market definition

4.2 Market segment analysis

Market segments

4.3 Market size 2025

4.4 Market outlook: Forecast for 2025-2030

Chart on Global - Market size and forecast 2025-2030 ($ million)
Data Table on Global - Market size and forecast 2025-2030 ($ million)
Chart on Global Market: Year-over-year growth 2025-2030 (%)
Data Table on Global Market: Year-over-year growth 2025-2030 (%)

5. Historic Market Size

5.1 Global Colorants Market 2020 - 2024

Historic Market Size - Data Table on Global Colorants Market 2020 - 2024 ($ million)

5.2 Type segment analysis 2020 - 2024

Historic Market Size - Type Segment 2020 - 2024 ($ million)

5.3 End-user segment analysis 2020 - 2024

Historic Market Size - End-user Segment 2020 - 2024 ($ million)

5.4 Product Type segment analysis 2020 - 2024

Historic Market Size - Product Type Segment 2020 - 2024 ($ million)

5.5 Geography segment analysis 2020 - 2024

Historic Market Size - Geography Segment 2020 - 2024 ($ million)

5.6 Country segment analysis 2020 - 2024

Historic Market Size - Country Segment 2020 - 2024 ($ million)

6. Qualitative Analysis

6.1 The impact of AI on global colorants market

7. Five Forces Analysis

7.1 Five forces summary

Five forces analysis - Comparison between 2025 and 2030

7.2 Bargaining power of buyers

Bargaining power of buyers - Impact of key factors 2025 and 2030

7.3 Bargaining power of suppliers

Bargaining power of suppliers - Impact of key factors in 2025 and 2030

7.4 Threat of new entrants

Threat of new entrants - Impact of key factors in 2025 and 2030

7.5 Threat of substitutes

Threat of substitutes - Impact of key factors in 2025 and 2030

7.6 Threat of rivalry

Threat of rivalry - Impact of key factors in 2025 and 2030

7.7 Market condition

Chart on Market condition - Five forces 2025 and 2030

8. Market Segmentation by Type

8.1 Market segments

Chart on Type - Market share 2025-2030 (%)
Data Table on Type - Market share 2025-2030 (%)

8.2 Comparison by Type

Chart on Comparison by Type
Data Table on Comparison by Type

8.3 Pigment - Market size and forecast 2025-2030

Chart on Pigment - Market size and forecast 2025-2030 ($ million)
Data Table on Pigment - Market size and forecast 2025-2030 ($ million)
Chart on Pigment - Year-over-year growth 2025-2030 (%)
Data Table on Pigment - Year-over-year growth 2025-2030 (%)

8.4 Dyes - Market size and forecast 2025-2030

Chart on Dyes - Market size and forecast 2025-2030 ($ million)
Data Table on Dyes - Market size and forecast 2025-2030 ($ million)
Chart on Dyes - Year-over-year growth 2025-2030 (%)
Data Table on Dyes - Year-over-year growth 2025-2030 (%)

8.5 Color concentrates - Market size and forecast 2025-2030

Chart on Color concentrates - Market size and forecast 2025-2030 ($ million)
Data Table on Color concentrates - Market size and forecast 2025-2030 ($ million)
Chart on Color concentrates - Year-over-year growth 2025-2030 (%)
Data Table on Color concentrates - Year-over-year growth 2025-2030 (%)

8.6 Others - Market size and forecast 2025-2030

Chart on Others - Market size and forecast 2025-2030 ($ million)
Data Table on Others - Market size and forecast 2025-2030 ($ million)
Chart on Others - Year-over-year growth 2025-2030 (%)
Data Table on Others - Year-over-year growth 2025-2030 (%)

8.7 Market opportunity by Type

Market opportunity by Type ($ million)
Data Table on Market opportunity by Type ($ million)

9. Market Segmentation by End-user

9.1 Market segments

Chart on End-user - Market share 2025-2030 (%)
Data Table on End-user - Market share 2025-2030 (%)

9.2 Comparison by End-user

Chart on Comparison by End-user
Data Table on Comparison by End-user

9.3 Paints and coatings - Market size and forecast 2025-2030

Chart on Paints and coatings - Market size and forecast 2025-2030 ($ million)
Data Table on Paints and coatings - Market size and forecast 2025-2030 ($ million)
Chart on Paints and coatings - Year-over-year growth 2025-2030 (%)
Data Table on Paints and coatings - Year-over-year growth 2025-2030 (%)

9.4 Textile - Market size and forecast 2025-2030

Chart on Textile - Market size and forecast 2025-2030 ($ million)
Data Table on Textile - Market size and forecast 2025-2030 ($ million)
Chart on Textile - Year-over-year growth 2025-2030 (%)
Data Table on Textile - Year-over-year growth 2025-2030 (%)

9.5 Personal care - Market size and forecast 2025-2030

Chart on Personal care - Market size and forecast 2025-2030 ($ million)
Data Table on Personal care - Market size and forecast 2025-2030 ($ million)
Chart on Personal care - Year-over-year growth 2025-2030 (%)
Data Table on Personal care - Year-over-year growth 2025-2030 (%)

9.6 Food - Market size and forecast 2025-2030

Chart on Food - Market size and forecast 2025-2030 ($ million)
Data Table on Food - Market size and forecast 2025-2030 ($ million)
Chart on Food - Year-over-year growth 2025-2030 (%)
Data Table on Food - Year-over-year growth 2025-2030 (%)

9.7 Others - Market size and forecast 2025-2030

Chart on Others - Market size and forecast 2025-2030 ($ million)
Data Table on Others - Market size and forecast 2025-2030 ($ million)
Chart on Others - Year-over-year growth 2025-2030 (%)
Data Table on Others - Year-over-year growth 2025-2030 (%)

9.8 Market opportunity by End-user

Market opportunity by End-user ($ million)
Data Table on Market opportunity by End-user ($ million)

10. Market Segmentation by Product Type

10.1 Market segments

Chart on Product Type - Market share 2025-2030 (%)
Data Table on Product Type - Market share 2025-2030 (%)

10.2 Comparison by Product Type

Chart on Comparison by Product Type
Data Table on Comparison by Product Type

10.3 Solvent‑borne colorants - Market size and forecast 2025-2030

Chart on Solvent‑borne colorants - Market size and forecast 2025-2030 ($ million)
Data Table on Solvent‑borne colorants - Market size and forecast 2025-2030 ($ million)
Chart on Solvent‑borne colorants - Year-over-year growth 2025-2030 (%)
Data Table on Solvent‑borne colorants - Year-over-year growth 2025-2030 (%)

10.4 Water‑borne colorants - Market size and forecast 2025-2030

Chart on Water‑borne colorants - Market size and forecast 2025-2030 ($ million)
Data Table on Water‑borne colorants - Market size and forecast 2025-2030 ($ million)
Chart on Water‑borne colorants - Year-over-year growth 2025-2030 (%)
Data Table on Water‑borne colorants - Year-over-year growth 2025-2030 (%)

10.5 Natural and bio‑based colorants - Market size and forecast 2025-2030

Chart on Natural and bio‑based colorants - Market size and forecast 2025-2030 ($ million)
Data Table on Natural and bio‑based colorants - Market size and forecast 2025-2030 ($ million)
Chart on Natural and bio‑based colorants - Year-over-year growth 2025-2030 (%)
Data Table on Natural and bio‑based colorants - Year-over-year growth 2025-2030 (%)

10.6 Market opportunity by Product Type

Market opportunity by Product Type ($ million)
Data Table on Market opportunity by Product Type ($ million)

11. Customer Landscape

11.1 Customer landscape overview

Analysis of price sensitivity, lifecycle, customer purchase basket, adoption rates, and purchase criteria

12. Geographic Landscape

12.1 Geographic segmentation

Chart on Market share by geography 2025-2030 (%)
Data Table on Market share by geography 2025-2030 (%)

12.2 Geographic comparison

Chart on Geographic comparison
Data Table on Geographic comparison

12.3 APAC - Market size and forecast 2025-2030

Chart on APAC - Market size and forecast 2025-2030 ($ million)
Data Table on APAC - Market size and forecast 2025-2030 ($ million)
Chart on APAC - Year-over-year growth 2025-2030 (%)
Data Table on APAC - Year-over-year growth 2025-2030 (%)
Chart on Regional Comparison - APAC
Data Table on Regional Comparison - APAC

12.3.1 China - Market size and forecast 2025-2030

Chart on China - Market size and forecast 2025-2030 ($ million)
Data Table on China - Market size and forecast 2025-2030 ($ million)
Chart on China - Year-over-year growth 2025-2030 (%)
Data Table on China - Year-over-year growth 2025-2030 (%)

12.3.2 India - Market size and forecast 2025-2030

Chart on India - Market size and forecast 2025-2030 ($ million)
Data Table on India - Market size and forecast 2025-2030 ($ million)
Chart on India - Year-over-year growth 2025-2030 (%)
Data Table on India - Year-over-year growth 2025-2030 (%)

12.3.3 Japan - Market size and forecast 2025-2030

Chart on Japan - Market size and forecast 2025-2030 ($ million)
Data Table on Japan - Market size and forecast 2025-2030 ($ million)
Chart on Japan - Year-over-year growth 2025-2030 (%)
Data Table on Japan - Year-over-year growth 2025-2030 (%)

12.3.4 South Korea - Market size and forecast 2025-2030

Chart on South Korea - Market size and forecast 2025-2030 ($ million)
Data Table on South Korea - Market size and forecast 2025-2030 ($ million)
Chart on South Korea - Year-over-year growth 2025-2030 (%)
Data Table on South Korea - Year-over-year growth 2025-2030 (%)

12.3.5 Australia - Market size and forecast 2025-2030

Chart on Australia - Market size and forecast 2025-2030 ($ million)
Data Table on Australia - Market size and forecast 2025-2030 ($ million)
Chart on Australia - Year-over-year growth 2025-2030 (%)
Data Table on Australia - Year-over-year growth 2025-2030 (%)

12.3.6 Indonesia - Market size and forecast 2025-2030

Chart on Indonesia - Market size and forecast 2025-2030 ($ million)
Data Table on Indonesia - Market size and forecast 2025-2030 ($ million)
Chart on Indonesia - Year-over-year growth 2025-2030 (%)
Data Table on Indonesia - Year-over-year growth 2025-2030 (%)

12.4 North America - Market size and forecast 2025-2030

Chart on North America - Market size and forecast 2025-2030 ($ million)
Data Table on North America - Market size and forecast 2025-2030 ($ million)
Chart on North America - Year-over-year growth 2025-2030 (%)
Data Table on North America - Year-over-year growth 2025-2030 (%)
Chart on Regional Comparison - North America
Data Table on Regional Comparison - North America

12.4.1 US - Market size and forecast 2025-2030

Chart on US - Market size and forecast 2025-2030 ($ million)
Data Table on US - Market size and forecast 2025-2030 ($ million)
Chart on US - Year-over-year growth 2025-2030 (%)
Data Table on US - Year-over-year growth 2025-2030 (%)

12.4.2 Canada - Market size and forecast 2025-2030

Chart on Canada - Market size and forecast 2025-2030 ($ million)
Data Table on Canada - Market size and forecast 2025-2030 ($ million)
Chart on Canada - Year-over-year growth 2025-2030 (%)
Data Table on Canada - Year-over-year growth 2025-2030 (%)

12.4.3 Mexico - Market size and forecast 2025-2030

Chart on Mexico - Market size and forecast 2025-2030 ($ million)
Data Table on Mexico - Market size and forecast 2025-2030 ($ million)
Chart on Mexico - Year-over-year growth 2025-2030 (%)
Data Table on Mexico - Year-over-year growth 2025-2030 (%)

12.5 Europe - Market size and forecast 2025-2030

Chart on Europe - Market size and forecast 2025-2030 ($ million)
Data Table on Europe - Market size and forecast 2025-2030 ($ million)
Chart on Europe - Year-over-year growth 2025-2030 (%)
Data Table on Europe - Year-over-year growth 2025-2030 (%)
Chart on Regional Comparison - Europe
Data Table on Regional Comparison - Europe

12.5.1 Germany - Market size and forecast 2025-2030

Chart on Germany - Market size and forecast 2025-2030 ($ million)
Data Table on Germany - Market size and forecast 2025-2030 ($ million)
Chart on Germany - Year-over-year growth 2025-2030 (%)
Data Table on Germany - Year-over-year growth 2025-2030 (%)

12.5.2 France - Market size and forecast 2025-2030

Chart on France - Market size and forecast 2025-2030 ($ million)
Data Table on France - Market size and forecast 2025-2030 ($ million)
Chart on France - Year-over-year growth 2025-2030 (%)
Data Table on France - Year-over-year growth 2025-2030 (%)

12.5.3 Italy - Market size and forecast 2025-2030

Chart on Italy - Market size and forecast 2025-2030 ($ million)
Data Table on Italy - Market size and forecast 2025-2030 ($ million)
Chart on Italy - Year-over-year growth 2025-2030 (%)
Data Table on Italy - Year-over-year growth 2025-2030 (%)

12.5.4 UK - Market size and forecast 2025-2030

Chart on UK - Market size and forecast 2025-2030 ($ million)
Data Table on UK - Market size and forecast 2025-2030 ($ million)
Chart on UK - Year-over-year growth 2025-2030 (%)
Data Table on UK - Year-over-year growth 2025-2030 (%)

12.5.5 Spain - Market size and forecast 2025-2030

Chart on Spain - Market size and forecast 2025-2030 ($ million)
Data Table on Spain - Market size and forecast 2025-2030 ($ million)
Chart on Spain - Year-over-year growth 2025-2030 (%)
Data Table on Spain - Year-over-year growth 2025-2030 (%)

12.5.6 The Netherlands - Market size and forecast 2025-2030

Chart on The Netherlands - Market size and forecast 2025-2030 ($ million)
Data Table on The Netherlands - Market size and forecast 2025-2030 ($ million)
Chart on The Netherlands - Year-over-year growth 2025-2030 (%)
Data Table on The Netherlands - Year-over-year growth 2025-2030 (%)

12.6 South America - Market size and forecast 2025-2030

Chart on South America - Market size and forecast 2025-2030 ($ million)
Data Table on South America - Market size and forecast 2025-2030 ($ million)
Chart on South America - Year-over-year growth 2025-2030 (%)
Data Table on South America - Year-over-year growth 2025-2030 (%)
Chart on Regional Comparison - South America
Data Table on Regional Comparison - South America

12.6.1 Brazil - Market size and forecast 2025-2030

Chart on Brazil - Market size and forecast 2025-2030 ($ million)
Data Table on Brazil - Market size and forecast 2025-2030 ($ million)
Chart on Brazil - Year-over-year growth 2025-2030 (%)
Data Table on Brazil - Year-over-year growth 2025-2030 (%)

12.6.2 Argentina - Market size and forecast 2025-2030

Chart on Argentina - Market size and forecast 2025-2030 ($ million)
Data Table on Argentina - Market size and forecast 2025-2030 ($ million)
Chart on Argentina - Year-over-year growth 2025-2030 (%)
Data Table on Argentina - Year-over-year growth 2025-2030 (%)

12.6.3 Chile - Market size and forecast 2025-2030

Chart on Chile - Market size and forecast 2025-2030 ($ million)
Data Table on Chile - Market size and forecast 2025-2030 ($ million)
Chart on Chile - Year-over-year growth 2025-2030 (%)
Data Table on Chile - Year-over-year growth 2025-2030 (%)

12.7 Middle East and Africa - Market size and forecast 2025-2030

Chart on Middle East and Africa - Market size and forecast 2025-2030 ($ million)
Data Table on Middle East and Africa - Market size and forecast 2025-2030 ($ million)
Chart on Middle East and Africa - Year-over-year growth 2025-2030 (%)
Data Table on Middle East and Africa - Year-over-year growth 2025-2030 (%)
Chart on Regional Comparison - Middle East and Africa
Data Table on Regional Comparison - Middle East and Africa

12.7.1 Saudi Arabia - Market size and forecast 2025-2030

Chart on Saudi Arabia - Market size and forecast 2025-2030 ($ million)
Data Table on Saudi Arabia - Market size and forecast 2025-2030 ($ million)
Chart on Saudi Arabia - Year-over-year growth 2025-2030 (%)
Data Table on Saudi Arabia - Year-over-year growth 2025-2030 (%)

12.7.2 UAE - Market size and forecast 2025-2030

Chart on UAE - Market size and forecast 2025-2030 ($ million)
Data Table on UAE - Market size and forecast 2025-2030 ($ million)
Chart on UAE - Year-over-year growth 2025-2030 (%)
Data Table on UAE - Year-over-year growth 2025-2030 (%)

12.7.3 South Africa - Market size and forecast 2025-2030

Chart on South Africa - Market size and forecast 2025-2030 ($ million)
Data Table on South Africa - Market size and forecast 2025-2030 ($ million)
Chart on South Africa - Year-over-year growth 2025-2030 (%)
Data Table on South Africa - Year-over-year growth 2025-2030 (%)

12.7.4 Egypt - Market size and forecast 2025-2030

Chart on Egypt - Market size and forecast 2025-2030 ($ million)
Data Table on Egypt - Market size and forecast 2025-2030 ($ million)
Chart on Egypt - Year-over-year growth 2025-2030 (%)
Data Table on Egypt - Year-over-year growth 2025-2030 (%)

12.7.5 Nigeria - Market size and forecast 2025-2030

Chart on Nigeria - Market size and forecast 2025-2030 ($ million)
Data Table on Nigeria - Market size and forecast 2025-2030 ($ million)
Chart on Nigeria - Year-over-year growth 2025-2030 (%)
Data Table on Nigeria - Year-over-year growth 2025-2030 (%)

12.8 Market opportunity by geography

Market opportunity by geography ($ million)
Data Tables on Market opportunity by geography ($ million)

13. Drivers, Challenges, and Opportunity

13.1 Market drivers

Robust expansion in global packaging sector
Accelerated growth in global construction and infrastructure development
Pivotal shift towards high performance and environmentally friendly colorant formulations

13.2 Market challenges

Pervasive volatility in raw material pricing and supply chain instability
Technical and economic hurdles in transition to sustainable colorants
Intense market competition and persistent price pressure leading to margin erosion

13.3 Impact of drivers and challenges

Impact of drivers and challenges in 2025 and 2030

13.4 Market opportunities

Ascendancy of natural colorants
Pervasive influence of technological advancement and product innovation
Intensification of regulatory scrutiny and compliance mandates

14. Competitive Landscape

14.1 Overview

14.2

Overview on criticality of inputs and factors of differentiation

14.3 Landscape disruption

Overview on factors of disruption

14.4 Industry risks

Impact of key risks on business

15. Competitive Analysis

15.1 Companies profiled

Companies covered

15.2 Company ranking index

15.3 Market positioning of companies

Matrix on companies position and classification

15.4 Ampacet Corp.

Ampacet Corp. - Overview
Ampacet Corp. - Product / Service
Ampacet Corp. - Key offerings
SWOT

15.5 Atul Ltd.

Atul Ltd. - Overview
Atul Ltd. - Business segments
Atul Ltd. - Key offerings
Atul Ltd. - Segment focus
SWOT

15.6 Avient Corp.

Avient Corp. - Overview
Avient Corp. - Business segments
Avient Corp. - Key offerings
Avient Corp. - Segment focus
SWOT

15.7 BASF SE

BASF SE - Overview
BASF SE - Business segments
BASF SE - Key news
BASF SE - Key offerings
BASF SE - Segment focus
SWOT

15.8 Cabot Corp.

Cabot Corp. - Overview
Cabot Corp. - Business segments
Cabot Corp. - Key news
Cabot Corp. - Key offerings
Cabot Corp. - Segment focus
SWOT

15.9 DIC Corp.

DIC Corp. - Overview
DIC Corp. - Business segments
DIC Corp. - Key news
DIC Corp. - Key offerings
DIC Corp. - Segment focus
SWOT

15.10 DuPont de Nemours Inc.

DuPont de Nemours Inc. - Overview
DuPont de Nemours Inc. - Business segments
DuPont de Nemours Inc. - Key news
DuPont de Nemours Inc. - Key offerings
DuPont de Nemours Inc. - Segment focus
SWOT

15.11 Holland Colours NV

Holland Colours NV - Overview
Holland Colours NV - Business segments
Holland Colours NV - Key offerings
Holland Colours NV - Segment focus
SWOT

15.12 Kiri Industries Ltd.

Kiri Industries Ltd. - Overview
Kiri Industries Ltd. - Business segments
Kiri Industries Ltd. - Key offerings
Kiri Industries Ltd. - Segment focus
SWOT

15.13 Kronos Worldwide Inc.

Kronos Worldwide Inc. - Overview
Kronos Worldwide Inc. - Product / Service
Kronos Worldwide Inc. - Key offerings
SWOT

15.14 Lanxess AG

Lanxess AG - Overview
Lanxess AG - Business segments
Lanxess AG - Key news
Lanxess AG - Key offerings
Lanxess AG - Segment focus
SWOT

15.15 LyondellBasell Industries NV

LyondellBasell Industries NV - Overview
LyondellBasell Industries NV - Business segments
LyondellBasell Industries NV - Key news
LyondellBasell Industries NV - Key offerings
LyondellBasell Industries NV - Segment focus
SWOT

15.16 Sensient Technologies Corp.

Sensient Technologies Corp. - Overview
Sensient Technologies Corp. - Business segments
Sensient Technologies Corp. - Key offerings
Sensient Technologies Corp. - Segment focus
SWOT

15.17 Sudarshan Chemical Industries

Sudarshan Chemical Industries - Overview
Sudarshan Chemical Industries - Business segments
Sudarshan Chemical Industries - Key offerings
Sudarshan Chemical Industries - Segment focus
SWOT

15.18 Vibrantz Technologies

Vibrantz Technologies - Overview
Vibrantz Technologies - Product / Service
Vibrantz Technologies - Key offerings
SWOT

16. Appendix

16.1 Scope of the report

Market definition
Objectives
Notes and caveats

16.2 Inclusions and exclusions checklist

Inclusions checklist
Exclusions checklist

16.3 Currency conversion rates for US$

16.4 Research methodology

16.5 Data procurement

Information sources

16.6 Data validation

16.7 Validation techniques employed for market sizing

16.8 Data synthesis

16.9 360 degree market analysis

16.10 List of abbreviations

Research Methodology

Technavio presents a detailed picture of the market by way of study, synthesis, and summation of data from multiple sources. The analysts have presented the various facets of the market with a particular focus on identifying the key industry influencers. The data thus presented is comprehensive, reliable, and the result of extensive research, both primary and secondary.

INFORMATION SOURCES

Primary sources

  • Manufacturers and suppliers
  • Channel partners
  • Industry experts
  • Strategic decision makers

Secondary sources

  • Industry journals and periodicals
  • Government data
  • Financial reports of key industry players
  • Historical data
  • Press releases

DATA ANALYSIS

Data Synthesis

  • Collation of data
  • Estimation of key figures
  • Analysis of derived insights

Data Validation

  • Triangulation with data models
  • Reference against proprietary databases
  • Corroboration with industry experts

REPORT WRITING

Qualitative

  • Market drivers
  • Market challenges
  • Market trends
  • Five forces analysis

Quantitative

  • Market size and forecast
  • Market segmentation
  • Geographical insights
  • Competitive landscape

Interested in this report?

Get your sample now to see our research methodology and insights!

Download Now

Frequently Asked Questions

Colorants market growth will increase by USD 26774.0 million during 2026-2030.

The Colorants market is expected to grow at a CAGR of 6.3% during 2026-2030.

Colorants market is segmented by Type (Pigment, Dyes, Color concentrates, Others) End-user (Paints and coatings, Textile, Personal care, Food, Others) Product type (Solvent‑borne colorants, Water‑borne colorants, Natural and bio‑based colorants)

Ampacet Corp., Archroma Management, Atul Ltd., Avient Corp., BASF SE, Cabot Corp., ChromaScape LLC, DIC Corp., DuPont de Nemours Inc., DyStar Group, Flint Group, Heubach Group, Holland Colours NV, Kiri Industries Ltd., Kronos Worldwide Inc., Lanxess AG, LyondellBasell Industries NV, Sensient Technologies Corp., Sudarshan Chemical Industries, Vibrantz Technologies are a few of the key vendors in the Colorants market.

APAC will register the highest growth rate of 39.2% among the other regions. Therefore, the Colorants market in APAC is expected to garner significant business opportunities for the vendors during the forecast period.

China, India, Japan, South Korea, Australia, Indonesia, US, Canada, Mexico, Germany, France, Italy, UK, Spain, The Netherlands, Brazil, Argentina, Chile, Saudi Arabia, UAE, South Africa, Egypt, Nigeria

  • Robust expansion in global packaging sector is the driving factor this market.

The Colorants market vendors should focus on grabbing business opportunities from the Type segment as it accounted for the largest market share in the base year.