
Commercial Printing Market Size 2025-2029
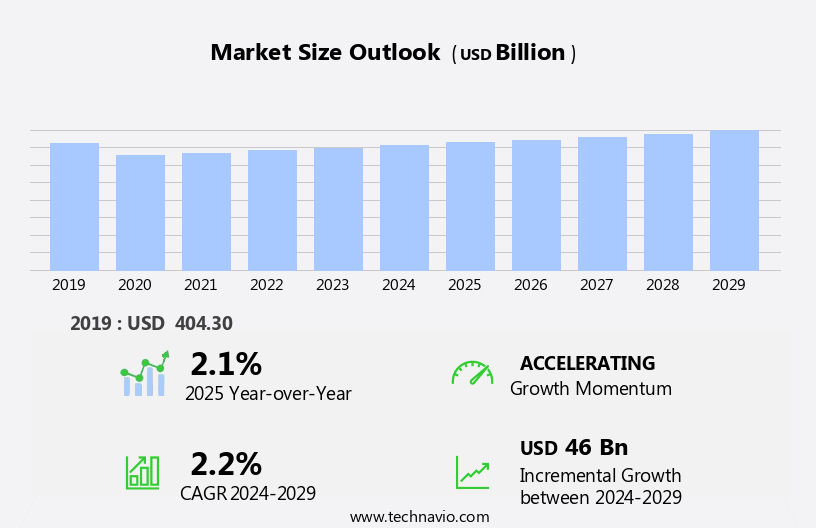
The commercial printing market size is forecast to increase by USD 46 billion, at a CAGR of 2.2% between 2024 and 2029.
- The market is experiencing a resurgence, driven primarily by the increasing demand for paperback books. This trend is fueled by the growing popularity of self-publishing and the rise of e-commerce platforms, enabling easy access to a wide range of titles. Another significant development in the market is the forward integration of companies, as they seek to expand their offerings and secure a larger share of the value chain. However, the market is not without challenges. Overcapacity and pricing pressures continue to pose significant obstacles for commercial printers.
- With increasing competition and advanced technologies enabling decentralized production, traditional printing companies face intense pressure to reduce costs and maintain profitability. To navigate these challenges, companies must focus on innovation, efficiency, and strategic partnerships. By investing in cutting-edge technologies and exploring new business models, they can differentiate themselves and capitalize on the opportunities presented by the evolving market landscape.
What will be the Size of the Commercial Printing Market during the forecast period?
Explore in-depth regional segment analysis with market size data - historical 2019-2023 and forecasts 2025-2029 - in the full report.
Request Free Sample
The market continues to evolve, with dynamic market activities shaping its landscape. ISO standards play a crucial role in ensuring consistency and quality across various applications, from marketing collateral and inkjet printing to gravure printing and screen printing. Ink types, such as water-based and UV-cured, continue to advance, influencing the selection of printing processes. Finishing equipment, including die cutting and foil stamping, complement the printing process, enhancing the overall quality and appeal of the final product. Customer service and turnaround time are increasingly important factors, with businesses seeking efficient and responsive solutions. Offset printing, sheetfed printing, and web printing cater to diverse production capacity needs, while digital printing systems enable print-on-demand and variable data printing.
Paper handling and paper stock choices, from lightweight to heavyweight, influence the final product's look and feel. Color management and quality control are essential for maintaining brand consistency across all printed materials. Marketing agencies and advertising firms rely on commercial printing services for a wide range of projects, from business cards and direct mail to large format printing and lithographic printing. Green printing initiatives and inkjet technology continue to gain traction, driving innovation and sustainability in the industry. The printing industry's ongoing evolution reflects its adaptability to meet the ever-changing needs of businesses and consumers alike.
How is this Commercial Printing Industry segmented?
The commercial printing industry research report provides comprehensive data (region-wise segment analysis), with forecasts and estimates in "USD billion" for the period 2025-2029, as well as historical data from 2019-2023 for the following segments.
- Service
- Print services
- Others
- Application
- Packaging
- Advertising
- Publishing
- Others
- Type
- Offset lithography
- Inkjet
- Flexographic
- Screen
- Others
- Geography
- North America
- US
- Canada
- Europe
- France
- Germany
- UK
- APAC
- Australia
- China
- India
- Japan
- South Korea
- Rest of World (ROW)
- North America
.
By Service Insights
The print services segment is estimated to witness significant growth during the forecast period.
The market encompasses various services and technologies, including flexographic printing for promotional materials, image resolution for high-quality prints, and print on demand for customized production. Graphic designers and advertising agencies rely on commercial printing services for paper handling and selecting appropriate paper stocks. Letterpress printing adds a tactile dimension, while digital printing offers quick turnaround times and variable data printing capabilities. Production capacity is a crucial factor, with large format printing and web printing catering to bulk orders. Sustainability is a trend, with green printing and inkjet printing gaining popularity. Quality control is paramount, with ISO standards ensuring consistency.
Customer service and turnaround time are essential, with offset printing offering long print runs and roll-to-roll printing for continuous production. Marketing collateral, from business cards to marketing materials, is a significant market segment. Companies focus on bundling services, such as printing and distribution, to retain customers. For instance, Quad/Graphics Inc. extended its bank debt agreement in October 2024 to secure long-term financing. In the dynamic printing industry, color management, foil stamping, and finishing equipment are essential tools for creating visually appealing and high-quality prints.
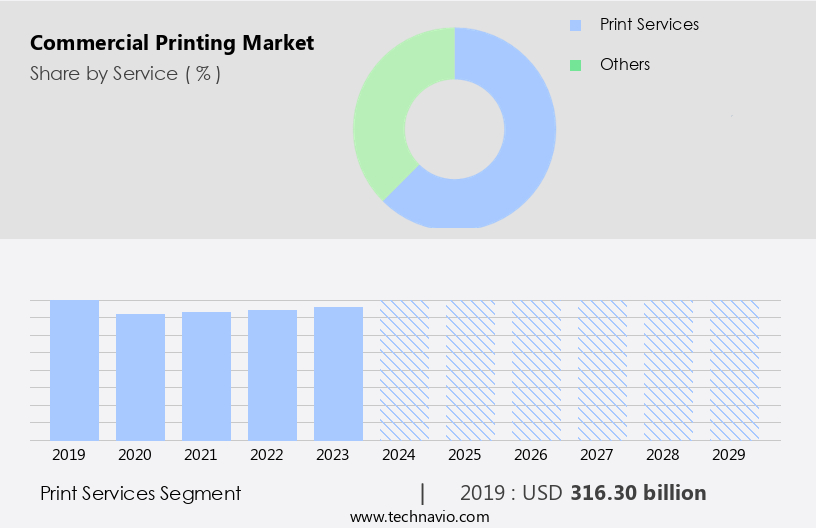
The Print services segment was valued at USD 316.30 billion in 2019 and showed a gradual increase during the forecast period.
Regional Analysis
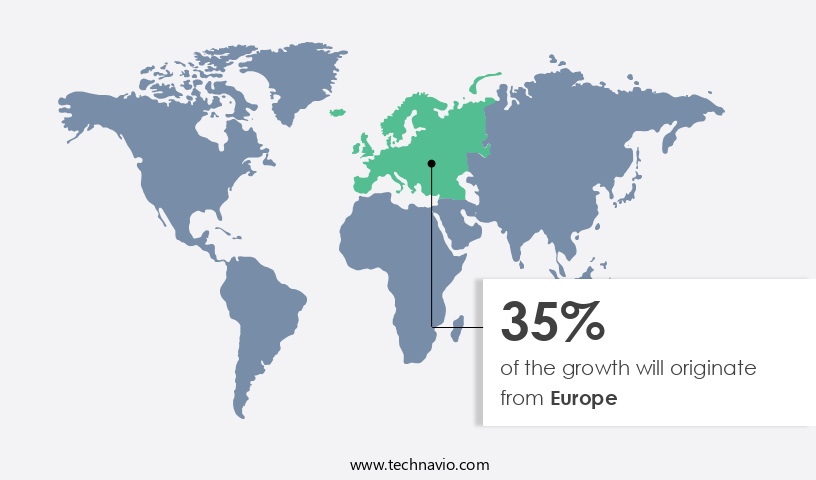
Europe is estimated to contribute 35% to the growth of the global market during the forecast period. Technavio's analysts have elaborately explained the regional trends and drivers that shape the market during the forecast period.
The market in Asia Pacific is experiencing notable growth, with countries such as China, India, the Philippines, Vietnam, and Thailand leading the charge. This region's competitive edge lies in the low cost of materials and labor, making it an attractive destination for both domestic and international customers. In China, the market is advanced in digital publishing, thanks to its status as a hub for e-reader manufacturers and mobile phone companies. India's Digital India Campaign, spearheaded by Prime Minister Narendra Modi, is focused on enhancing technology use nationwide. Over 100,000 schools and colleges in India have adopted software to promote digital tools in education.
Graphic designers and advertising agencies rely on commercial printing services to produce promotional materials, ensuring high-resolution images and color management for their clients. Paper handling and selection are crucial, with various paper stocks available for different printing techniques such as letterpress, lithographic, and digital. Printing equipment, including digital printing systems, offset printing presses, and sheetfed presses, enable production capacity for various print runs. Marketing agencies and print buyers rely on print management and quality control to ensure their marketing collateral meets their brand's standards. ISO standards, such as ISO 12647-2, ensure consistent color reproduction across various printing processes.
Inkjet printing, screen printing, and gravure printing are among the techniques used for various applications, from business cards to large format printing. Direct mail and variable data printing cater to targeted marketing campaigns, while finishing equipment, such as die cutting and foil stamping, add a professional touch to printed materials. Green printing practices, such as using eco-friendly inks and recycled paper stocks, are increasingly popular. Turnaround time and customer service are essential factors in the competitive printing industry. Production capacity and print run length vary depending on the printing technique and equipment used. Roll-to-roll printing is ideal for large-scale projects, while smaller print runs may benefit from sheetfed printing or digital printing systems.
Regardless of the technique, the market continues to evolve, offering innovative solutions for businesses to effectively communicate their brand message.
Market Dynamics
Our researchers analyzed the data with 2024 as the base year, along with the key drivers, trends, and challenges. A holistic analysis of drivers will help companies refine their marketing strategies to gain a competitive advantage.
What are the key market drivers leading to the rise in the adoption of Commercial Printing Industry?
- The significant growth in paperback book sales serves as the primary catalyst for the market's expansion.
- The market has experienced notable growth in recent years, driven by several key factors. One significant trend is the resurgence of paper-based products, such as business cards and magazines, following the decline of eBooks. In 2024, Bertelsmann SE and Co. KGaA reported a 25% increase in sales of paperback books, indicating a preference for physical media among consumers. This revival is expected to boost the market, as businesses and publishers seek cost-effective solutions for producing high-quality printed materials. Moreover, advancements in printing technology, such as digital printing and color management, have expanded production capacity and improved the overall quality of printed materials.
- These innovations have also made it possible to offer more personalized and customized print solutions, which is a major draw for marketing agencies and businesses looking to make an impact. Direct mail campaigns and large format printing continue to be popular applications for commercial printing, as they offer a tangible and memorable way to reach customers. Additionally, techniques like foil stamping add a premium touch to printed materials, making them a desirable choice for special occasions and high-end branding. The cost-effectiveness of printing equipment and the availability of affordable color management solutions have made it easier for businesses to produce high-quality printed materials in-house, further fueling the growth of the market.
- Overall, the market is expected to continue expanding during the forecast period, driven by these and other factors.
What are the market trends shaping the Commercial Printing Industry?
- The trend in the market is shifting towards forward integration among companies. This business strategy involves expanding a company's activities into areas previously handled by suppliers or customers. For instance, a manufacturer might decide to take over the distribution function of its products, or a retailer could start producing some of the goods it sells. This approach offers several benefits, including increased control over the supply chain, improved efficiency, and enhanced customer service.
- The market is undergoing significant transformation as companies seek to expand their offerings beyond traditional print products and services. In the coming years, integrating forward into areas such as media services, digital technologies, management services, and logistics is expected to be a key trend. The supply chain in commercial printing typically involves the procurement of materials, printing, and post-production (co-mailing). However, some industry players like LSC Communications are moving to integrate logistics into their operations, creating end-to-end print product and service solutions. This forward integration will enable companies to consolidate their positions in the market and provide more comprehensive offerings to their clients.
- Quality control remains a crucial aspect of the commercial printing process, with print buyers demanding high print quality, particularly in digital printing systems and web printing. Additionally, the growing emphasis on green printing practices is driving the adoption of sustainable printing processes, such as those utilizing renewable energy sources and recycled materials. Variable data printing and die cutting are other technologies gaining popularity due to their ability to offer personalized and customized print solutions. Companies must invest in advanced printing presses and technologies to meet the evolving demands of their clients while maintaining stringent quality control standards.
What challenges does the Commercial Printing Industry face during its growth?
- Commercial printing faces significant challenges from overcapacity and pricing pressures, which negatively impact industry growth. These issues put pressure on profitability and force companies to constantly adapt in order to remain competitive.
- The market is characterized by intense competition and challenges, including overcapacity and pricing pressures. RR Donnelley and Sons Co. Have identified excess manufacturing capacity in the industry, a result of declining print volumes and the increasing popularity of digital alternatives. This excess capacity is exacerbated by print management firms' efforts to reduce costs for their clients, placing additional pressure on commercial printing companies. ISO standards, such as those related to inkjet printing and finishing equipment, play a crucial role in maintaining quality and efficiency in the market. Ink types, including water-based, UV-cured, and solvent-based, are continually evolving to meet the demands of various applications and industries.
- Gravure printing and screen printing continue to coexist with offset printing, each offering unique advantages based on print run length and specific requirements. Customer service and turnaround time are essential differentiators in the market, as companies strive to meet the evolving needs of their clients. Offset printing remains a popular choice for large print runs, while digital printing offers the flexibility and speed required for shorter runs and on-demand printing. The market's dynamics are shaped by the interplay of these factors, as well as the ongoing advancements in technology and industry trends.
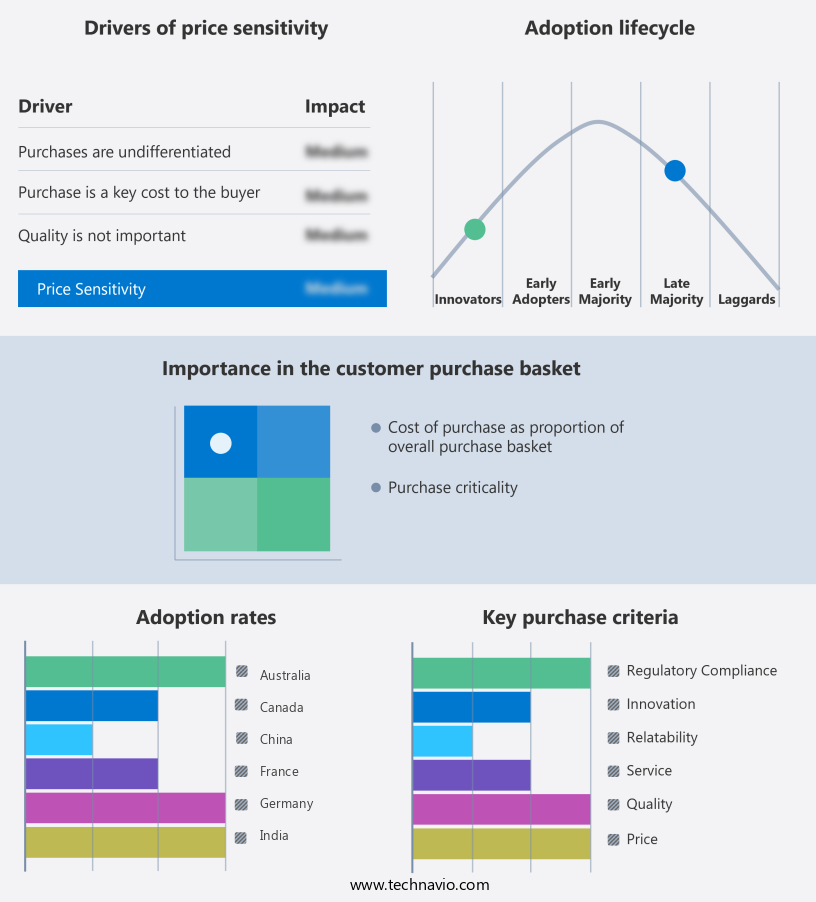
Exclusive Customer Landscape
The commercial printing market forecasting report includes the adoption lifecycle of the market, covering from the innovator's stage to the laggard's stage. It focuses on adoption rates in different regions based on penetration. Furthermore, the commercial printing market report also includes key purchase criteria and drivers of price sensitivity to help companies evaluate and develop their market growth analysis strategies.
Customer Landscape
Key Companies & Market Insights
Companies are implementing various strategies, such as strategic alliances, commercial printing market forecast, partnerships, mergers and acquisitions, geographical expansion, and product/service launches, to enhance their presence in the industry.
ACME printing - The company specializes in advanced printing solutions, delivering high-quality digital and offset prints for businesses.
The industry research and growth report includes detailed analyses of the competitive landscape of the market and information about key companies, including:
- ACME printing
- Bertelsmann SE and Co. KGaA
- Cenveo Worldwide Ltd.
- Cimpress Plc
- Dai Nippon Printing Co. Ltd.
- Ennis Inc.
- Lagardere SA
- LSC Communications LLC
- O Neil Printing
- Print Direction Inc.
- Print Logistic Sp. z.o.o.
- Quad Graphics Inc.
- RR Donnelley and Sons Co.
- Taylor Corp.
- The Enfield Printing Co.
- Toppan Inc.
- Transcontinental Inc.
- WestRock Co.
Qualitative and quantitative analysis of companies has been conducted to help clients understand the wider business environment as well as the strengths and weaknesses of key industry players. Data is qualitatively analyzed to categorize companies as pure play, category-focused, industry-focused, and diversified; it is quantitatively analyzed to categorize companies as dominant, leading, strong, tentative, and weak.
Recent Development and News in Commercial Printing Market
- In February 2023, Hewlett-Packard (HP) announced the launch of its new digital press, the HP Indigo 12000 HD, offering enhanced productivity and superior print quality for commercial printers (HP Press Release, 2023). This innovation is expected to cater to the increasing demand for high-definition, short-run printing.
- In March 2024, Xerox and Fujifilm announced a strategic partnership to develop and commercialize next-generation digital printing technologies (Xerox Press Release, 2024). This collaboration aims to bring advanced solutions to the market and strengthen both companies' positions in the commercial printing industry.
- In July 2024, Quad/Graphics, a leading commercial printer, completed the acquisition of LSC Communications, expanding its capabilities in packaging, print, and marketing services (Quad/Graphics Press Release, 2024). This merger is expected to create a leading global marketing and print communications company, generating approximately USD3 billion in annual revenue.
Research Analyst Overview
- The market continues to evolve, driven by advancements in print technology and consumer demand for high-quality, customized prints. One notable trend is the increasing popularity of spot colors and the use of die-cutting dies to create unique shapes and designs. Perfect binding and print innovation, such as UV coating and wire-o binding, offer enhanced durability and visual appeal. Print automation and workflow management solutions streamline production processes, ensuring efficient and accurate print runs. Print regulations and optimization strategies, including color calibration and paper weight selection, maintain consistency and adherence to industry standards. Prepress software and print data management systems enable seamless collaboration and communication between designers, printers, and clients.
- Folding patterns, saddle stitch, and spiral binding offer versatility in binding types for various print media and applications. Paper grades, finishes, and print technology trends continue to evolve, with digital asset management and print quality assurance solutions ensuring the highest possible standards. Print industry associations play a crucial role in shaping the future of the market through advocacy, education, and innovation.
Dive into Technavio's robust research methodology, blending expert interviews, extensive data synthesis, and validated models for unparalleled Commercial Printing Market insights. See full methodology.
|
Market Scope |
|
|
Report Coverage |
Details |
|
Page number |
224 |
|
Base year |
2024 |
|
Historic period |
2019-2023 |
|
Forecast period |
2025-2029 |
|
Growth momentum & CAGR |
Accelerate at a CAGR of 2.2% |
|
Market growth 2025-2029 |
USD 46 billion |
|
Market structure |
Fragmented |
|
YoY growth 2024-2025(%) |
2.1 |
|
Key countries |
US, China, Japan, India, Canada, UK, South Korea, Germany, France, and Australia |
|
Competitive landscape |
Leading Companies, Market Positioning of Companies, Competitive Strategies, and Industry Risks |
What are the Key Data Covered in this Commercial Printing Market Research and Growth Report?
- CAGR of the Commercial Printing industry during the forecast period
- Detailed information on factors that will drive the growth and forecasting between 2025 and 2029
- Precise estimation of the size of the market and its contribution of the industry in focus to the parent market
- Accurate predictions about upcoming growth and trends and changes in consumer behaviour
- Growth of the market across APAC, North America, Europe, South America, and Middle East and Africa
- Thorough analysis of the market's competitive landscape and detailed information about companies
- Comprehensive analysis of factors that will challenge the commercial printing market growth of industry companies
We can help! Our analysts can customize this commercial printing market research report to meet your requirements.
 RIA -
RIA - 
