Commercial Rotisserie Equipment Market Analysis, Size, and Forecast 2025-2029: North America (US, Canada, and Mexico), Europe (Germany, UK, and France), APAC (China, Japan, and India), South America (Brazil and Argentina), Middle East and Africa (Saudi Arabia, UAE, and South Africa), and Rest of World (ROW)

Commercial Rotisserie Equipment Market Analysis, Size, and Forecast 2025-2029:
North America (US, Canada, and Mexico), Europe (Germany, UK, and France), APAC (China, Japan, and India), South America (Brazil and Argentina), Middle East and Africa (Saudi Arabia, UAE, and South Africa), and Rest of World (ROW)

Published: Dec 2025 294 Pages SKU: IRTNTR73063

Market Overview at a Glance

$73.06 Mn
Market Opportunity
7.1%
CAGR 2024 - 2029
40.1%
North America Growth
$111.41 Mn
Gas segment 2023

Commercial Rotisserie Equipment Market Size 2025-2029

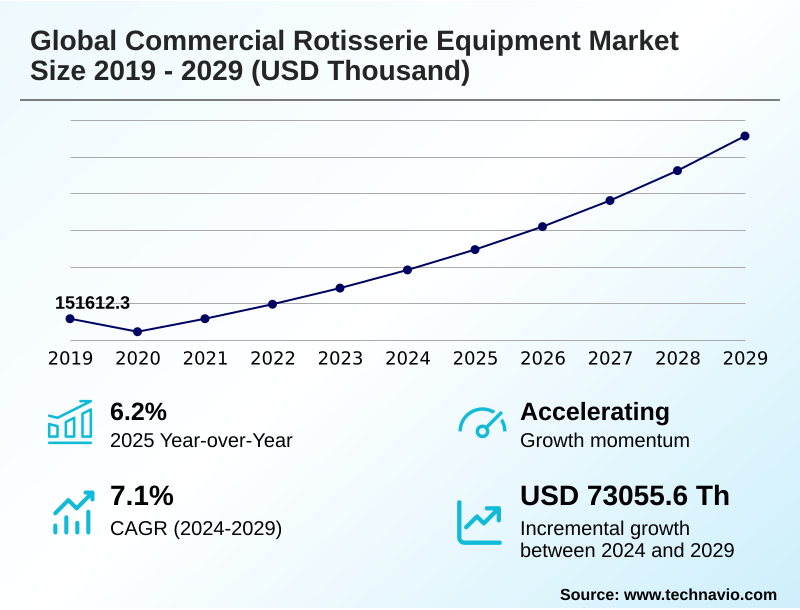
The commercial rotisserie equipment market size is valued to increase by USD 73.06 million, at a CAGR of 7.1% from 2024 to 2029. High profit margins in sale of rotisserie chicken will drive the commercial rotisserie equipment market.

Major Market Trends & Insights

  • North America dominated the market and accounted for a 40.1% growth during the forecast period.
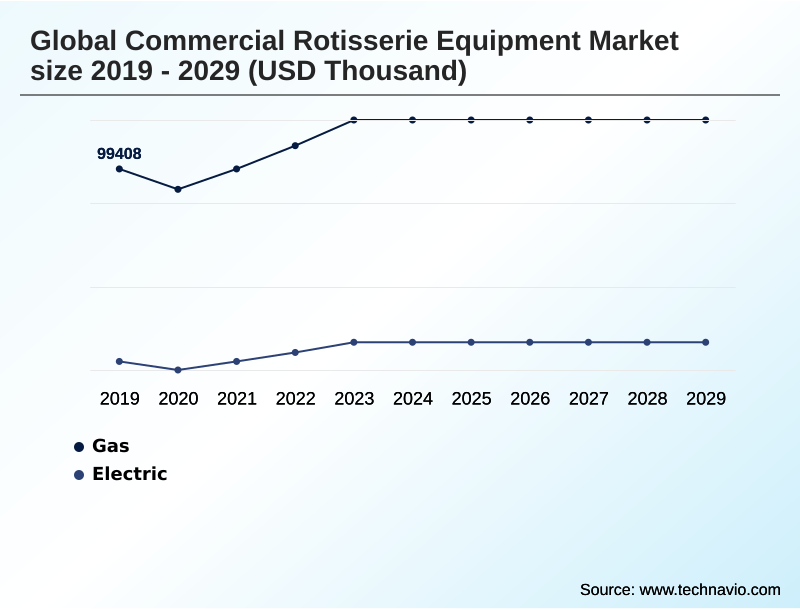
  • By Source of Heat - Gas segment was valued at USD 111.41 million in 2023
  • By End-user - QSRs segment accounted for the largest market revenue share in 2023

Market Size & Forecast

  • Market Opportunities:
  • Market Future Opportunities: USD 73.06 million
  • CAGR from 2024 to 2029 : 7.1%

Market Summary

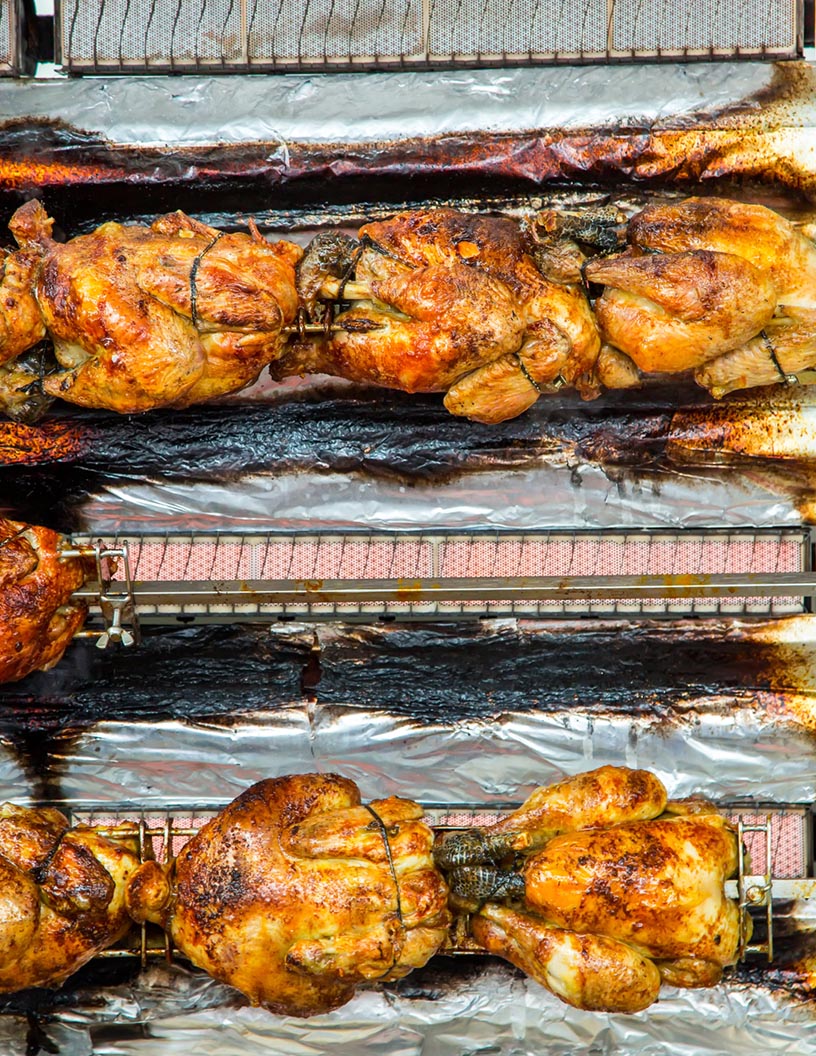
  • The commercial rotisserie equipment market is characterized by a strong emphasis on operational efficiency and product quality, driven by high profit margins from offerings like rotisserie chicken. Foodservice establishments from quick-service restaurants to supermarkets leverage this equipment not only for its cooking capabilities but also as a powerful front-of-house merchandising tool in open-kitchen concepts.
  • Key trends include the adoption of technologies that improve performance and reduce operational overhead, such as infrared burners for even cooking and self-cleaning mechanisms to save labor. For instance, a supermarket chain implementing units with programmable cooking cycles can ensure product consistency across all its locations, a critical factor for brand integrity.
  • However, the market faces headwinds from a broader dietary shift toward plant-based alternatives, which may temper demand for meat-centric appliances. Manufacturers are responding by innovating with more versatile and energy-efficient models designed to meet evolving end-user requirements and maintain a competitive edge in a dynamic culinary landscape.
  • The focus remains on delivering a strong return on investment through enhanced productivity, reduced waste, and superior food quality, ensuring the rotisserie remains a profitable asset in commercial kitchens.

What will be the Size of the Commercial Rotisserie Equipment Market during the forecast period?

Get Key Insights on Market Forecast (PDF) Request Free Sample

How is the Commercial Rotisserie Equipment Market Segmented?

The commercial rotisserie equipment industry research report provides comprehensive data (region-wise segment analysis), with forecasts and estimates in "USD thousand" for the period 2025-2029, as well as historical data from 2019-2023 for the following segments.

  • Source of heat
    • Gas
    • Electric
  • End-user
    • QSRs
    • Hotels
    • Food courts
  • Capacity
    • Medium
    • Small
    • Large
  • Geography
    • North America
      • US
      • Canada
      • Mexico
    • Europe
      • Germany
      • UK
      • France
    • APAC
      • China
      • Japan
      • India
    • South America
      • Brazil
      • Argentina
    • Middle East and Africa
      • Saudi Arabia
      • UAE
      • South Africa
    • Rest of World (ROW)

By Source of Heat Insights

The gas segment is estimated to witness significant growth during the forecast period.

The gas-powered segment is defined by equipment using gas burners for consistent temperature control, essential for high-volume foodservice operations. This equipment enables rapid heat generation, supporting peak service hours and high-throughput kitchens that demand reliable performance and food preparation consistency.

Gas rotisseries, including floor-standing rotisserie models, are designed for continuous operation and feature durable equipment construction. Operators favor these systems for their cost-effectiveness where gas infrastructure is prevalent, allowing for efficient management of fuel expenses.

The market is also driven by the adoption of equipment offering high-capacity stacking, which enhances kitchen workflow optimization and supports a strong return on investment analysis.

The segment's market share, accounting for over 66% of installations, underscores its dominance in commercial kitchen environments prioritizing both performance and premium food presentation.

Request Free Sample

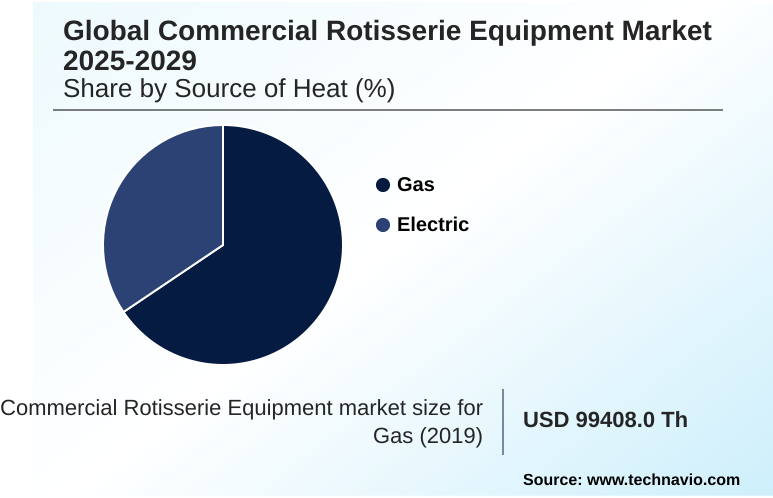
The Gas segment was valued at USD 111.41 million in 2023 and showed a gradual increase during the forecast period.

Request Free Sample

Regional Analysis

North America is estimated to contribute 40.1% to the growth of the global market during the forecast period.Technavio’s analysts have elaborately explained the regional trends and drivers that shape the market during the forecast period.

See How Commercial Rotisserie Equipment Market Demand is Rising in North America Request Free Sample

The geographic landscape of the market is led by North America, which accounts for approximately 40% of the market's incremental growth, driven by strong consumer demand for ready-to-eat meal solutions in supermarkets and a mature foodservice sector.

The region prioritizes ventless operation technology and ENERGY STAR certification to mitigate high labor and energy costs. In Europe, the focus shifts toward front-of-house display cooking and premium food presentation, with an emphasis on equipment hygiene standards.

The APAC region is the fastest-growing market, fueled by urbanization and the expansion of modern retail.

In dense urban centers across Europe and APAC, the adoption of compact equipment footprint and countertop rotisserie models can reduce installation costs by over 30% by avoiding extensive ventilation work, showcasing how regional needs influence technological adoption and enhance customer engagement through in-store bakery programs and food product merchandising.

Market Dynamics

Our researchers analyzed the data with 2024 as the base year, along with the key drivers, trends, and challenges. A holistic analysis of drivers will help companies refine their marketing strategies to gain a competitive advantage.

  • Strategic decisions in the commercial rotisserie equipment market involve a detailed evaluation of various factors to maximize profitability and operational efficiency. When considering gas vs electric rotisserie operating cost, businesses must analyze local utility prices and infrastructure. For establishments with limited area, such as urban cafes or food trucks, the countertop rotisserie for small spaces becomes a critical asset.
  • The technical benefits of infrared rotisserie burners, known for faster and more even cooking, must be weighed against their initial investment. A major consideration for high-volume operators is the impact of self-cleaning on labor; establishments with automated systems report nearly double the equipment uptime during peak hours compared to manual cleaning protocols.
  • For food courts and non-traditional locations, the ventless rotisserie for food courts is often the only viable option, eliminating the need for costly ventilation hoods. Supermarkets, on the other hand, prioritize the high-capacity rotisserie for supermarkets to meet constant demand. Evaluating the return on investment rotisserie programs is essential for all end-users.
  • This involves analyzing the commercial rotisserie equipment cleaning procedure, its effect on downtime, and how equipment for open kitchens can drive sales through visual merchandising. The efficiency gained from a pass-through rotisserie workflow, particularly in busy kitchens, can be significant.
  • Selecting the right rotisserie for hotel buffets requires balancing capacity with aesthetic appeal, while stacked rotisserie for high volume is ideal for central commissaries. Ultimately, maintaining consistent rotisserie product quality is paramount, and the benefits of NSF certified rotisserie hygiene and automating rotisserie cooking cycles contribute directly to this goal, enabling operators to offer diverse menus and optimize for profitability.

What are the key market drivers leading to the rise in the adoption of Commercial Rotisserie Equipment Industry?

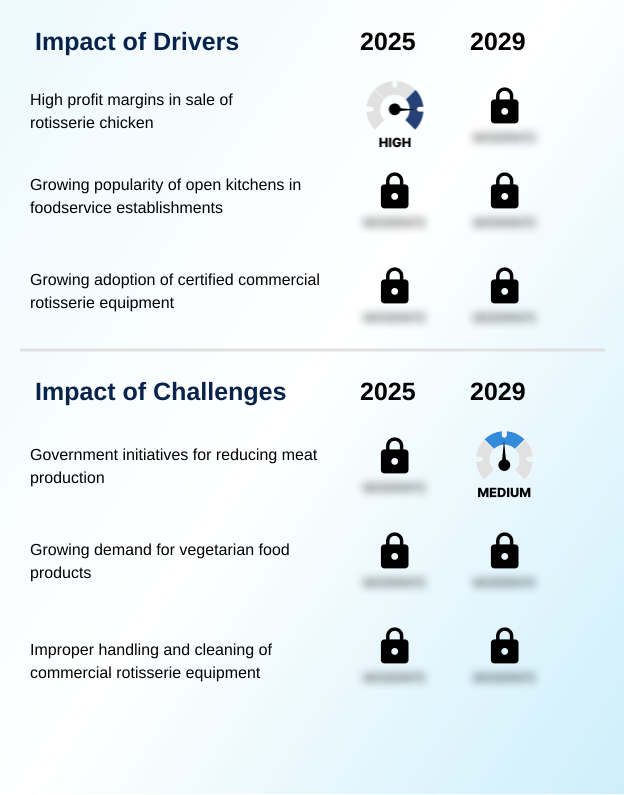
  • High profit margins associated with the sale of rotisserie chicken serve as a key driver for the commercial rotisserie equipment market.

  • Market growth is primarily fueled by the strong profitability of rotisserie products and the equipment's role as a visual merchandising tool.
  • High-volume food production from a single unit offers an attractive return on investment, a key factor in capital expenditure planning. In open-kitchen settings, front-of-house merchandising using visually appealing equipment can increase sales of rotisserie items by as much as 25%.
  • This direct impact on revenue encourages investment in models with pass-through door models and those that facilitate culinary menu diversification.
  • Furthermore, the growing adoption of certified equipment ensures safety and efficiency, with features like uniform heat distribution and spit rotation mechanism guaranteeing a consistent product.
  • This demand is supported by a robust after-sales service network, providing end-user training programs and ensuring equipment reliability.

What are the market trends shaping the Commercial Rotisserie Equipment Industry?

  • The growing adoption of commercial rotisserie equipment featuring infrared burners is an upcoming market trend. This technology is recognized for enhancing heat transfer efficiency and ensuring consistent product quality.

  • Key trends are reshaping the market, driven by the need for greater efficiency and reduced labor. The adoption of equipment with automated cleaning systems is a significant development, with some models reducing daily cleaning time by over 75%. Innovations in heat application, such as infrared cooking burners, are improving energy efficiency and can decrease pre-heating times by up to 40%.
  • Manufacturers are also securing intellectual property, with patented cooking process technologies delivering unparalleled food preparation consistency. These trends reflect a move toward smarter, more autonomous kitchen solutions that incorporate advanced features like sealed heating elements, high-capacity stacking, precise temperature regulation, and AGA certification compliance. The integration of such technologies helps foodservice operators enhance kitchen safety compliance and lower operational costs.

What challenges does the Commercial Rotisserie Equipment Industry face during its growth?

  • Government initiatives aimed at reducing meat production present a significant challenge to the growth of the commercial rotisserie equipment industry.

  • The market faces notable challenges from shifting consumer preferences and operational complexities. The growing demand for plant-based diets is reducing the equipment utilization rate in some foodservice establishments by over 30% as menus diversify away from meat. This trend poses a long-term risk to a market centered on meat preparation. Operationally, improper handling and cleaning lead to significant inefficiencies.
  • For instance, grease and food buildup can increase energy consumption by up to 20% due to poor heat transfer from the energy-efficient heating. This directly impacts the total cost of ownership and undermines the benefits of advanced systems. These challenges compel operators to focus on preventive maintenance scheduling and proper staff training to maintain both performance and food safety compliance.

Exclusive Technavio Analysis on Customer Landscape

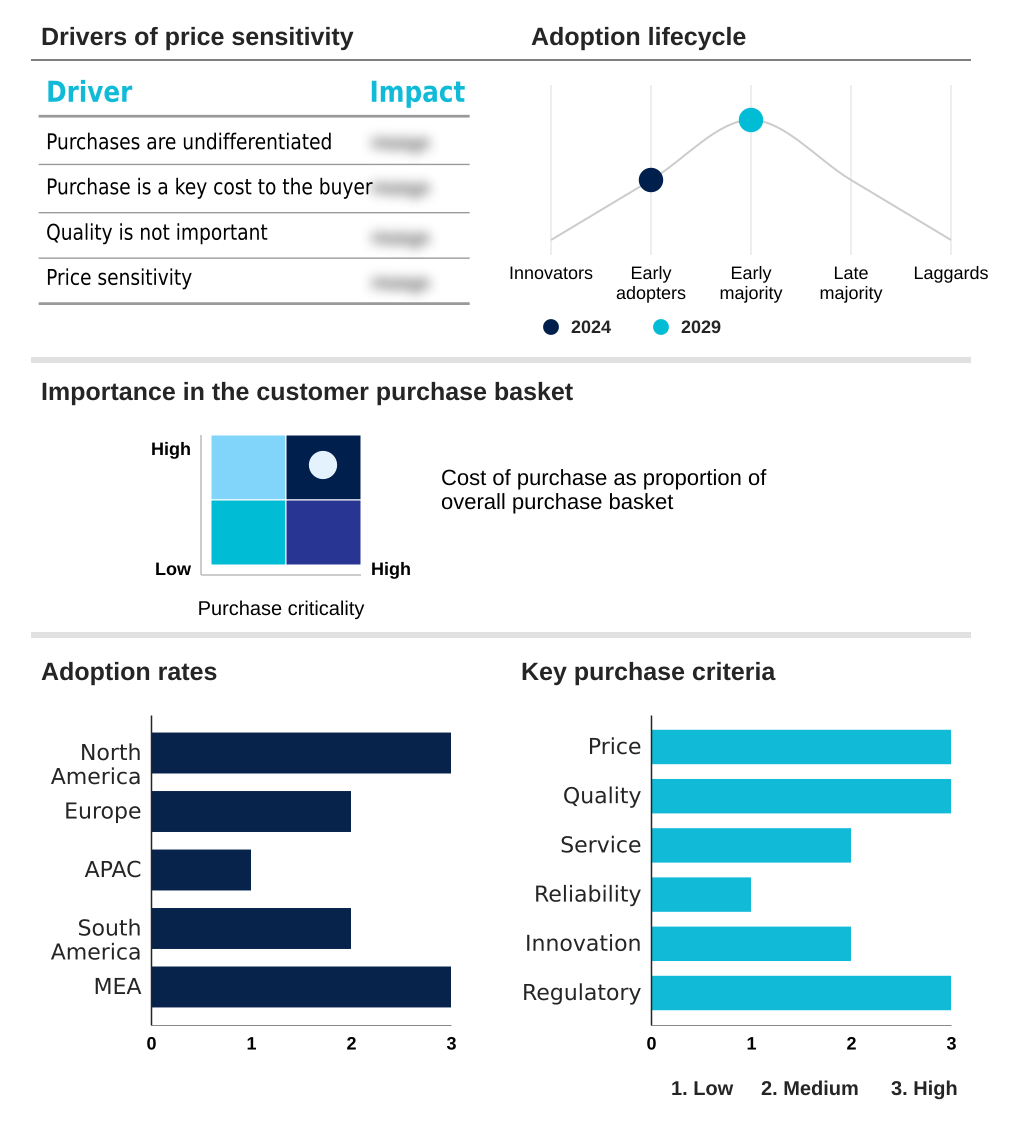
The commercial rotisserie equipment market forecasting report includes the adoption lifecycle of the market, covering from the innovator’s stage to the laggard’s stage. It focuses on adoption rates in different regions based on penetration. Furthermore, the commercial rotisserie equipment market report also includes key purchase criteria and drivers of price sensitivity to help companies evaluate and develop their market growth analysis strategies.

Customer Landscape of Commercial Rotisserie Equipment Industry

Competitive Landscape

Companies are implementing various strategies, such as strategic alliances, commercial rotisserie equipment market forecast, partnerships, mergers and acquisitions, geographical expansion, and product/service launches, to enhance their presence in the industry.

ALPINA BELGIUM - Offerings include commercial rotisserie equipment manufactured from AISI 304 stainless steel, engineered for high-volume cooking applications in professional foodservice environments.

The industry research and growth report includes detailed analyses of the competitive landscape of the market and information about key companies, including:

  • ALPINA BELGIUM
  • Alto Shaam Inc.
  • American Range Corp.
  • Attias Oven Corp.
  • Bidvest Group Ltd.
  • CB srl
  • Diamond Europe SA
  • Dimark Commercial Pty. Ltd.
  • DOREGRILL SAS
  • Equipex LLC
  • Fri-Jado BV
  • Hardt Equipment
  • Henny Penny Corp.
  • Hickory Industries Inc.
  • Illinois Tool Works Inc.
  • J and R Manufacturing LLC
  • ROLLER GRILL INTERNATIONAL SAS
  • Rotisol SA
  • The Middleby Corp.
  • The Vollrath Co. LLC

Qualitative and quantitative analysis of companies has been conducted to help clients understand the wider business environment as well as the strengths and weaknesses of key industry players. Data is qualitatively analyzed to categorize companies as pure play, category-focused, industry-focused, and diversified; it is quantitatively analyzed to categorize companies as dominant, leading, strong, tentative, and weak.

Recent Development and News in Commercial rotisserie equipment market

  • In September 2024, Henny Penny Corp. announced a new patent for an AI-driven temperature and humidity control system designed to optimize cooking cycles, reportedly reducing energy consumption by up to 15% for various proteins.
  • In November 2024, Alto-Shaam Inc. launched its new Prodigi line of ventless rotisserie ovens, which incorporates its patented automated cleaning technology, aiming to reduce associated labor costs for end-users.
  • In January 2025, Rotisol SA entered into a strategic partnership with a major global luxury hotel group to become the exclusive supplier of display rotisseries for all new hotel openings across the APAC region.
  • In April 2025, The Middleby Corp. completed the acquisition of a leading manufacturer of automated food handling systems to integrate robotics into its large-scale rotisserie production lines for industrial food processors.

Dive into Technavio’s robust research methodology, blending expert interviews, extensive data synthesis, and validated models for unparalleled Commercial Rotisserie Equipment Market insights. See full methodology.

Market Scope
Page number 294
Base year 2024
Historic period 2019-2023
Forecast period 2025-2029
Growth momentum & CAGR Accelerate at a CAGR of 7.1%
Market growth 2025-2029 USD 73055.6 thousand
Market structure Fragmented
YoY growth 2024-2025(%) 6.2%
Key countries US, Canada, Mexico, Germany, UK, France, Italy, Spain, The Netherlands, China, Japan, India, South Korea, Australia, Indonesia, Brazil, Argentina, Chile, Saudi Arabia, UAE, South Africa, Egypt and Nigeria
Competitive landscape Leading Companies, Market Positioning of Companies, Competitive Strategies, and Industry Risks

Request Free Sample

Research Analyst Overview

  • The commercial rotisserie equipment market is evolving beyond basic cooking functions, with a clear focus on integrated systems that enhance operational efficiency and product consistency. Innovations in radiant heat technology and cross-flow convection heating are enabling more precise temperature regulation, which is critical for food preparation workflow.
  • Boardroom decisions increasingly center on capital investments in equipment that offers a quantifiable return through automation and data. For example, the adoption of programmable logic controllers and digital touchscreen controls connected to a remote monitoring capability allows for centralized oversight of multi-unit operations. This directly addresses the challenge of maintaining brand standards across a franchise network.
  • Equipment featuring a patented cooking methodology can reduce product variance by over 30%, a compelling metric for large-scale operators. Advanced features like automated grease collection, multi-spit roasting systems, and ventless operation technology are becoming standard expectations.
  • Compliance with NSF International standards and ENERGY STAR certification is also a key purchasing driver, influencing long-term operational costs and aligning with corporate sustainability mandates. The market's direction is toward intelligent, connected, and highly automated cooking platforms.

What are the Key Data Covered in this Commercial Rotisserie Equipment Market Research and Growth Report?

  • What is the expected growth of the Commercial Rotisserie Equipment Market between 2025 and 2029?

    • USD 73.06 million, at a CAGR of 7.1%

  • What segmentation does the market report cover?

    • The report is segmented by Source of Heat (Gas, Electric), End-user (QSRs, Hotels, Food courts), Capacity (Medium, Small, Large) and Geography (North America, Europe, APAC, South America, Middle East and Africa)

  • Which regions are analyzed in the report?

    • North America, Europe, APAC, South America and Middle East and Africa

  • What are the key growth drivers and market challenges?

    • High profit margins in sale of rotisserie chicken, Government initiatives for reducing meat production

  • Who are the major players in the Commercial Rotisserie Equipment Market?

    • ALPINA BELGIUM, Alto Shaam Inc., American Range Corp., Attias Oven Corp., Bidvest Group Ltd., CB srl, Diamond Europe SA, Dimark Commercial Pty. Ltd., DOREGRILL SAS, Equipex LLC, Fri-Jado BV, Hardt Equipment, Henny Penny Corp., Hickory Industries Inc., Illinois Tool Works Inc., J and R Manufacturing LLC, ROLLER GRILL INTERNATIONAL SAS, Rotisol SA, The Middleby Corp. and The Vollrath Co. LLC

Market Research Insights

  • Market dynamics are shaped by the pursuit of operational efficiency and enhanced profitability. Foodservice operators are increasingly adopting equipment that offers a high return on investment, with features like automated cooking cycles improving product consistency by over 20%. The emphasis on total cost of ownership is driving demand for durable equipment construction and solutions that simplify kitchen workflow optimization.
  • For example, the integration of a data management platform for remote recipe management can streamline multi-unit operations, a key factor in brand standard enforcement. Furthermore, self-cleaning functions can reduce daily sanitation labor by up to 45 minutes, directly impacting operational simplicity and costs.
  • This focus on measurable outcomes reflects a sophisticated approach to capital expenditure planning, where long-term value outweighs initial purchase price.

We can help! Our analysts can customize this commercial rotisserie equipment market research report to meet your requirements.

Get in touch

1. Executive Summary

1.1 Market overview

Executive Summary - Chart on Market Overview
Executive Summary - Data Table on Market Overview
Executive Summary - Chart on Global Market Characteristics
Executive Summary - Chart on Market by Geography
Executive Summary - Chart on Market Segmentation by Source of Heat
Executive Summary - Chart on Market Segmentation by End-user
Executive Summary - Chart on Market Segmentation by Capacity
Executive Summary - Chart on Incremental Growth
Executive Summary - Data Table on Incremental Growth
Executive Summary - Chart on Company Market Positioning

2. Technavio Analysis

2.1 Analysis of price sensitivity, lifecycle, customer purchase basket, adoption rates, and purchase criteria

2.2 Criticality of inputs and Factors of differentiation

Chart on Overview on criticality of inputs and factors of differentiation

2.3 Factors of disruption

Chart on Overview on factors of disruption

2.4 Impact of drivers and challenges

Chart on Impact of drivers and challenges in 2024 and 2029

3. Market Landscape

3.1 Market ecosystem

Chart on Parent Market
Data Table on - Parent Market

3.2 Market characteristics

Chart on Market characteristics analysis

3.3 Value chain analysis

Chart on Value chain analysis

4. Market Sizing

4.1 Market definition

Data Table on Offerings of companies included in the market definition

4.2 Market segment analysis

Market segments

4.3 Market size 2024

4.4 Market outlook: Forecast for 2024-2029

Chart on Global - Market size and forecast 2024-2029 ($ thousand)
Data Table on Global - Market size and forecast 2024-2029 ($ thousand)
Chart on Global Market: Year-over-year growth 2024-2029 (%)
Data Table on Global Market: Year-over-year growth 2024-2029 (%)

5. Historic Market Size

5.1 Global Commercial Rotisserie Equipment Market 2019 - 2023

Historic Market Size - Data Table on Global Commercial Rotisserie Equipment Market 2019 - 2023 ($ thousand)

5.2 Source of Heat segment analysis 2019 - 2023

Historic Market Size - Source of Heat Segment 2019 - 2023 ($ thousand)

5.3 End-user segment analysis 2019 - 2023

Historic Market Size - End-user Segment 2019 - 2023 ($ thousand)

5.4 Capacity segment analysis 2019 - 2023

Historic Market Size - Capacity Segment 2019 - 2023 ($ thousand)

5.5 Geography segment analysis 2019 - 2023

Historic Market Size - Geography Segment 2019 - 2023 ($ thousand)

5.6 Country segment analysis 2019 - 2023

Historic Market Size - Country Segment 2019 - 2023 ($ thousand)

6. Qualitative Analysis

6.1 Impact of AI on the global commercial rotisserie equipment market

7. Five Forces Analysis

7.1 Five forces summary

Five forces analysis - Comparison between 2024 and 2029

7.2 Bargaining power of buyers

Bargaining power of buyers - Impact of key factors 2024 and 2029

7.3 Bargaining power of suppliers

Bargaining power of suppliers - Impact of key factors in 2024 and 2029

7.4 Threat of new entrants

Threat of new entrants - Impact of key factors in 2024 and 2029

7.5 Threat of substitutes

Threat of substitutes - Impact of key factors in 2024 and 2029

7.6 Threat of rivalry

Threat of rivalry - Impact of key factors in 2024 and 2029

7.7 Market condition

Chart on Market condition - Five forces 2024 and 2029

8. Market Segmentation by Source of Heat

8.1 Market segments

Chart on Market Segmentation by Source of Heat - Market share 2024-2029 (%)
Data Table on Market Segmentation by Source of Heat - Market share 2024-2029 (%)

8.2 Comparison by Market Segmentation by Source of Heat

Chart on Comparison by Market Segmentation by Source of Heat
Data Table on Comparison by Market Segmentation by Source of Heat

8.3 Gas - Market size and forecast 2024-2029

Chart on Gas - Market size and forecast 2024-2029 ($ thousand)
Data Table on Gas - Market size and forecast 2024-2029 ($ thousand)
Chart on Gas - Year-over-year growth 2024-2029 (%)
Data Table on Gas - Year-over-year growth 2024-2029 (%)

8.4 Electric - Market size and forecast 2024-2029

Chart on Electric - Market size and forecast 2024-2029 ($ thousand)
Data Table on Electric - Market size and forecast 2024-2029 ($ thousand)
Chart on Electric - Year-over-year growth 2024-2029 (%)
Data Table on Electric - Year-over-year growth 2024-2029 (%)

8.5 Market opportunity by Market Segmentation by Source of Heat

Market opportunity by Market Segmentation by Source of Heat ($ thousand)
Data Table on Market opportunity by Market Segmentation by Source of Heat ($ thousand)

9. Market Segmentation by End-user

9.1 Market segments

Chart on End-user - Market share 2024-2029 (%)
Data Table on End-user - Market share 2024-2029 (%)

9.2 Comparison by End-user

Chart on Comparison by End-user
Data Table on Comparison by End-user

9.3 QSRs - Market size and forecast 2024-2029

Chart on QSRs - Market size and forecast 2024-2029 ($ thousand)
Data Table on QSRs - Market size and forecast 2024-2029 ($ thousand)
Chart on QSRs - Year-over-year growth 2024-2029 (%)
Data Table on QSRs - Year-over-year growth 2024-2029 (%)

9.4 Hotels - Market size and forecast 2024-2029

Chart on Hotels - Market size and forecast 2024-2029 ($ thousand)
Data Table on Hotels - Market size and forecast 2024-2029 ($ thousand)
Chart on Hotels - Year-over-year growth 2024-2029 (%)
Data Table on Hotels - Year-over-year growth 2024-2029 (%)

9.5 Food courts - Market size and forecast 2024-2029

Chart on Food courts - Market size and forecast 2024-2029 ($ thousand)
Data Table on Food courts - Market size and forecast 2024-2029 ($ thousand)
Chart on Food courts - Year-over-year growth 2024-2029 (%)
Data Table on Food courts - Year-over-year growth 2024-2029 (%)

9.6 Market opportunity by End-user

Market opportunity by End-user ($ thousand)
Data Table on Market opportunity by End-user ($ thousand)

10. Market Segmentation by Capacity

10.1 Market segments

Chart on Capacity - Market share 2024-2029 (%)
Data Table on Capacity - Market share 2024-2029 (%)

10.2 Comparison by Capacity

Chart on Comparison by Capacity
Data Table on Comparison by Capacity

10.3 Medium - Market size and forecast 2024-2029

Chart on Medium - Market size and forecast 2024-2029 ($ thousand)
Data Table on Medium - Market size and forecast 2024-2029 ($ thousand)
Chart on Medium - Year-over-year growth 2024-2029 (%)
Data Table on Medium - Year-over-year growth 2024-2029 (%)

10.4 Small - Market size and forecast 2024-2029

Chart on Small - Market size and forecast 2024-2029 ($ thousand)
Data Table on Small - Market size and forecast 2024-2029 ($ thousand)
Chart on Small - Year-over-year growth 2024-2029 (%)
Data Table on Small - Year-over-year growth 2024-2029 (%)

10.5 Large - Market size and forecast 2024-2029

Chart on Large - Market size and forecast 2024-2029 ($ thousand)
Data Table on Large - Market size and forecast 2024-2029 ($ thousand)
Chart on Large - Year-over-year growth 2024-2029 (%)
Data Table on Large - Year-over-year growth 2024-2029 (%)

10.6 Market opportunity by Capacity

Market opportunity by Capacity ($ thousand)
Data Table on Market opportunity by Capacity ($ thousand)

11. Customer Landscape

11.1 Customer landscape overview

Analysis of price sensitivity, lifecycle, customer purchase basket, adoption rates, and purchase criteria

12. Geographic Landscape

12.1 Geographic segmentation

Chart on Market share by geography 2024-2029 (%)
Data Table on Market share by geography 2024-2029 (%)

12.2 Geographic comparison

Chart on Geographic comparison
Data Table on Geographic comparison

12.3 North America - Market size and forecast 2024-2029

Chart on North America - Market size and forecast 2024-2029 ($ thousand)
Data Table on North America - Market size and forecast 2024-2029 ($ thousand)
Chart on North America - Year-over-year growth 2024-2029 (%)
Data Table on North America - Year-over-year growth 2024-2029 (%)
Chart on Regional Comparison - North America
Data Table on Regional Comparison - North America

12.3.1 US - Market size and forecast 2024-2029

Chart on US - Market size and forecast 2024-2029 ($ thousand)
Data Table on US - Market size and forecast 2024-2029 ($ thousand)
Chart on US - Year-over-year growth 2024-2029 (%)
Data Table on US - Year-over-year growth 2024-2029 (%)

12.3.2 Canada - Market size and forecast 2024-2029

Chart on Canada - Market size and forecast 2024-2029 ($ thousand)
Data Table on Canada - Market size and forecast 2024-2029 ($ thousand)
Chart on Canada - Year-over-year growth 2024-2029 (%)
Data Table on Canada - Year-over-year growth 2024-2029 (%)

12.3.3 Mexico - Market size and forecast 2024-2029

Chart on Mexico - Market size and forecast 2024-2029 ($ thousand)
Data Table on Mexico - Market size and forecast 2024-2029 ($ thousand)
Chart on Mexico - Year-over-year growth 2024-2029 (%)
Data Table on Mexico - Year-over-year growth 2024-2029 (%)

12.4 Europe - Market size and forecast 2024-2029

Chart on Europe - Market size and forecast 2024-2029 ($ thousand)
Data Table on Europe - Market size and forecast 2024-2029 ($ thousand)
Chart on Europe - Year-over-year growth 2024-2029 (%)
Data Table on Europe - Year-over-year growth 2024-2029 (%)
Chart on Regional Comparison - Europe
Data Table on Regional Comparison - Europe

12.4.1 Germany - Market size and forecast 2024-2029

Chart on Germany - Market size and forecast 2024-2029 ($ thousand)
Data Table on Germany - Market size and forecast 2024-2029 ($ thousand)
Chart on Germany - Year-over-year growth 2024-2029 (%)
Data Table on Germany - Year-over-year growth 2024-2029 (%)

12.4.2 UK - Market size and forecast 2024-2029

Chart on UK - Market size and forecast 2024-2029 ($ thousand)
Data Table on UK - Market size and forecast 2024-2029 ($ thousand)
Chart on UK - Year-over-year growth 2024-2029 (%)
Data Table on UK - Year-over-year growth 2024-2029 (%)

12.4.3 France - Market size and forecast 2024-2029

Chart on France - Market size and forecast 2024-2029 ($ thousand)
Data Table on France - Market size and forecast 2024-2029 ($ thousand)
Chart on France - Year-over-year growth 2024-2029 (%)
Data Table on France - Year-over-year growth 2024-2029 (%)

12.4.4 Italy - Market size and forecast 2024-2029

Chart on Italy - Market size and forecast 2024-2029 ($ thousand)
Data Table on Italy - Market size and forecast 2024-2029 ($ thousand)
Chart on Italy - Year-over-year growth 2024-2029 (%)
Data Table on Italy - Year-over-year growth 2024-2029 (%)

12.4.5 Spain - Market size and forecast 2024-2029

Chart on Spain - Market size and forecast 2024-2029 ($ thousand)
Data Table on Spain - Market size and forecast 2024-2029 ($ thousand)
Chart on Spain - Year-over-year growth 2024-2029 (%)
Data Table on Spain - Year-over-year growth 2024-2029 (%)

12.4.6 The Netherlands - Market size and forecast 2024-2029

Chart on The Netherlands - Market size and forecast 2024-2029 ($ thousand)
Data Table on The Netherlands - Market size and forecast 2024-2029 ($ thousand)
Chart on The Netherlands - Year-over-year growth 2024-2029 (%)
Data Table on The Netherlands - Year-over-year growth 2024-2029 (%)

12.5 APAC - Market size and forecast 2024-2029

Chart on APAC - Market size and forecast 2024-2029 ($ thousand)
Data Table on APAC - Market size and forecast 2024-2029 ($ thousand)
Chart on APAC - Year-over-year growth 2024-2029 (%)
Data Table on APAC - Year-over-year growth 2024-2029 (%)
Chart on Regional Comparison - APAC
Data Table on Regional Comparison - APAC

12.5.1 China - Market size and forecast 2024-2029

Chart on China - Market size and forecast 2024-2029 ($ thousand)
Data Table on China - Market size and forecast 2024-2029 ($ thousand)
Chart on China - Year-over-year growth 2024-2029 (%)
Data Table on China - Year-over-year growth 2024-2029 (%)

12.5.2 Japan - Market size and forecast 2024-2029

Chart on Japan - Market size and forecast 2024-2029 ($ thousand)
Data Table on Japan - Market size and forecast 2024-2029 ($ thousand)
Chart on Japan - Year-over-year growth 2024-2029 (%)
Data Table on Japan - Year-over-year growth 2024-2029 (%)

12.5.3 India - Market size and forecast 2024-2029

Chart on India - Market size and forecast 2024-2029 ($ thousand)
Data Table on India - Market size and forecast 2024-2029 ($ thousand)
Chart on India - Year-over-year growth 2024-2029 (%)
Data Table on India - Year-over-year growth 2024-2029 (%)

12.5.4 South Korea - Market size and forecast 2024-2029

Chart on South Korea - Market size and forecast 2024-2029 ($ thousand)
Data Table on South Korea - Market size and forecast 2024-2029 ($ thousand)
Chart on South Korea - Year-over-year growth 2024-2029 (%)
Data Table on South Korea - Year-over-year growth 2024-2029 (%)

12.5.5 Australia - Market size and forecast 2024-2029

Chart on Australia - Market size and forecast 2024-2029 ($ thousand)
Data Table on Australia - Market size and forecast 2024-2029 ($ thousand)
Chart on Australia - Year-over-year growth 2024-2029 (%)
Data Table on Australia - Year-over-year growth 2024-2029 (%)

12.5.6 Indonesia - Market size and forecast 2024-2029

Chart on Indonesia - Market size and forecast 2024-2029 ($ thousand)
Data Table on Indonesia - Market size and forecast 2024-2029 ($ thousand)
Chart on Indonesia - Year-over-year growth 2024-2029 (%)
Data Table on Indonesia - Year-over-year growth 2024-2029 (%)

12.6 South America - Market size and forecast 2024-2029

Chart on South America - Market size and forecast 2024-2029 ($ thousand)
Data Table on South America - Market size and forecast 2024-2029 ($ thousand)
Chart on South America - Year-over-year growth 2024-2029 (%)
Data Table on South America - Year-over-year growth 2024-2029 (%)
Chart on Regional Comparison - South America
Data Table on Regional Comparison - South America

12.6.1 Brazil - Market size and forecast 2024-2029

Chart on Brazil - Market size and forecast 2024-2029 ($ thousand)
Data Table on Brazil - Market size and forecast 2024-2029 ($ thousand)
Chart on Brazil - Year-over-year growth 2024-2029 (%)
Data Table on Brazil - Year-over-year growth 2024-2029 (%)

12.6.2 Argentina - Market size and forecast 2024-2029

Chart on Argentina - Market size and forecast 2024-2029 ($ thousand)
Data Table on Argentina - Market size and forecast 2024-2029 ($ thousand)
Chart on Argentina - Year-over-year growth 2024-2029 (%)
Data Table on Argentina - Year-over-year growth 2024-2029 (%)

12.6.3 Chile - Market size and forecast 2024-2029

Chart on Chile - Market size and forecast 2024-2029 ($ thousand)
Data Table on Chile - Market size and forecast 2024-2029 ($ thousand)
Chart on Chile - Year-over-year growth 2024-2029 (%)
Data Table on Chile - Year-over-year growth 2024-2029 (%)

12.7 Middle East and Africa - Market size and forecast 2024-2029

Chart on Middle East and Africa - Market size and forecast 2024-2029 ($ thousand)
Data Table on Middle East and Africa - Market size and forecast 2024-2029 ($ thousand)
Chart on Middle East and Africa - Year-over-year growth 2024-2029 (%)
Data Table on Middle East and Africa - Year-over-year growth 2024-2029 (%)
Chart on Regional Comparison - Middle East and Africa
Data Table on Regional Comparison - Middle East and Africa

12.7.1 Saudi Arabia - Market size and forecast 2024-2029

Chart on Saudi Arabia - Market size and forecast 2024-2029 ($ thousand)
Data Table on Saudi Arabia - Market size and forecast 2024-2029 ($ thousand)
Chart on Saudi Arabia - Year-over-year growth 2024-2029 (%)
Data Table on Saudi Arabia - Year-over-year growth 2024-2029 (%)

12.7.2 UAE - Market size and forecast 2024-2029

Chart on UAE - Market size and forecast 2024-2029 ($ thousand)
Data Table on UAE - Market size and forecast 2024-2029 ($ thousand)
Chart on UAE - Year-over-year growth 2024-2029 (%)
Data Table on UAE - Year-over-year growth 2024-2029 (%)

12.7.3 South Africa - Market size and forecast 2024-2029

Chart on South Africa - Market size and forecast 2024-2029 ($ thousand)
Data Table on South Africa - Market size and forecast 2024-2029 ($ thousand)
Chart on South Africa - Year-over-year growth 2024-2029 (%)
Data Table on South Africa - Year-over-year growth 2024-2029 (%)

12.7.4 Egypt - Market size and forecast 2024-2029

Chart on Egypt - Market size and forecast 2024-2029 ($ thousand)
Data Table on Egypt - Market size and forecast 2024-2029 ($ thousand)
Chart on Egypt - Year-over-year growth 2024-2029 (%)
Data Table on Egypt - Year-over-year growth 2024-2029 (%)

12.7.5 Nigeria - Market size and forecast 2024-2029

Chart on Nigeria - Market size and forecast 2024-2029 ($ thousand)
Data Table on Nigeria - Market size and forecast 2024-2029 ($ thousand)
Chart on Nigeria - Year-over-year growth 2024-2029 (%)
Data Table on Nigeria - Year-over-year growth 2024-2029 (%)

12.8 Market opportunity by geography

Market opportunity by geography ($ thousand)
Data Tables on Market opportunity by geography ($ thousand)

13. Drivers, Challenges, and Opportunity

13.1 Market drivers

High profit margins in sale of rotisserie chicken
Growing popularity of open kitchens in foodservice establishments
Growing adoption of certified commercial rotisserie equipment

13.2 Market challenges

Government initiatives for reducing meat production
Growing demand for vegetarian food products
Improper handling and cleaning of commercial rotisserie equipment

13.3 Impact of drivers and challenges

Impact of drivers and challenges in 2024 and 2029

13.4 Market opportunities

Growing adoption of commercial rotisserie equipment featuring infrared burners
Increasing adoption of self-cleaning commercial rotisserie equipment
Rising preference for commercial rotisserie equipment with patented designs

14. Competitive Landscape

14.1 Overview

14.2

Overview on criticality of inputs and factors of differentiation

14.3 Landscape disruption

Overview on factors of disruption

14.4 Industry risks

Impact of key risks on business

15. Competitive Analysis

15.1 Companies profiled

Companies covered

15.2 Company ranking index

15.3 Market positioning of companies

Matrix on companies position and classification

15.4 ALPINA BELGIUM

ALPINA BELGIUM - Overview
ALPINA BELGIUM - Product / Service
ALPINA BELGIUM - Key offerings
SWOT

15.5 Alto Shaam Inc.

Alto Shaam Inc. - Overview
Alto Shaam Inc. - Product / Service
Alto Shaam Inc. - Key offerings
SWOT

15.6 American Range Corp.

American Range Corp. - Overview
American Range Corp. - Product / Service
American Range Corp. - Key offerings
SWOT

15.7 Attias Oven Corp.

Attias Oven Corp. - Overview
Attias Oven Corp. - Product / Service
Attias Oven Corp. - Key offerings
SWOT

15.8 Dimark Commercial Pty. Ltd.

Dimark Commercial Pty. Ltd. - Overview
Dimark Commercial Pty. Ltd. - Product / Service
Dimark Commercial Pty. Ltd. - Key offerings
SWOT

15.9 DOREGRILL SAS

DOREGRILL SAS - Overview
DOREGRILL SAS - Product / Service
DOREGRILL SAS - Key offerings
SWOT

15.10 Equipex LLC

Equipex LLC - Overview
Equipex LLC - Product / Service
Equipex LLC - Key offerings
SWOT

15.11 Fri-Jado BV

Fri-Jado BV - Overview
Fri-Jado BV - Product / Service
Fri-Jado BV - Key offerings
SWOT

15.12 Henny Penny Corp.

Henny Penny Corp. - Overview
Henny Penny Corp. - Product / Service
Henny Penny Corp. - Key offerings
SWOT

15.13 Hickory Industries Inc.

Hickory Industries Inc. - Overview
Hickory Industries Inc. - Product / Service
Hickory Industries Inc. - Key offerings
SWOT

15.14 Illinois Tool Works Inc.

Illinois Tool Works Inc. - Overview
Illinois Tool Works Inc. - Business segments
Illinois Tool Works Inc. - Key offerings
Illinois Tool Works Inc. - Segment focus
SWOT

15.15 J and R Manufacturing LLC

J and R Manufacturing LLC - Overview
J and R Manufacturing LLC - Product / Service
J and R Manufacturing LLC - Key offerings
SWOT

15.16 ROLLER GRILL INTERNATIONAL SAS

ROLLER GRILL INTERNATIONAL SAS - Overview
ROLLER GRILL INTERNATIONAL SAS - Product / Service
ROLLER GRILL INTERNATIONAL SAS - Key offerings
SWOT

15.17 Rotisol SA

Rotisol SA - Overview
Rotisol SA - Product / Service
Rotisol SA - Key offerings
SWOT

15.18 The Vollrath Co. LLC

The Vollrath Co. LLC - Overview
The Vollrath Co. LLC - Product / Service
The Vollrath Co. LLC - Key offerings
SWOT

16. Appendix

16.1 Scope of the report

Market definition
Objectives
Notes and caveats

16.2 Inclusions and exclusions checklist

Inclusions checklist
Exclusions checklist

16.3 Currency conversion rates for US$

16.4 Research methodology

16.5 Data procurement

Information sources

16.6 Data validation

16.7 Validation techniques employed for market sizing

16.8 Data synthesis

16.9 360 degree market analysis

16.10 List of abbreviations

Research Methodology

Technavio presents a detailed picture of the market by way of study, synthesis, and summation of data from multiple sources. The analysts have presented the various facets of the market with a particular focus on identifying the key industry influencers. The data thus presented is comprehensive, reliable, and the result of extensive research, both primary and secondary.

INFORMATION SOURCES

Primary sources

  • Manufacturers and suppliers
  • Channel partners
  • Industry experts
  • Strategic decision makers

Secondary sources

  • Industry journals and periodicals
  • Government data
  • Financial reports of key industry players
  • Historical data
  • Press releases

DATA ANALYSIS

Data Synthesis

  • Collation of data
  • Estimation of key figures
  • Analysis of derived insights

Data Validation

  • Triangulation with data models
  • Reference against proprietary databases
  • Corroboration with industry experts

REPORT WRITING

Qualitative

  • Market drivers
  • Market challenges
  • Market trends
  • Five forces analysis

Quantitative

  • Market size and forecast
  • Market segmentation
  • Geographical insights
  • Competitive landscape

Interested in this report?

Get your sample now to see our research methodology and insights!

Download Now

Frequently Asked Questions

Commercial Rotisserie Equipment market growth will increase by USD 73055.6 thousand thousand during 2025-2029 .

The Commercial Rotisserie Equipment market is expected to grow at a CAGR of 7.1% during 2025-2029 .

Commercial Rotisserie Equipment market is segmented by Source of heat (Gas, Electric) End-user (QSRs, Hotels, Food courts) Capacity (Medium, Small, Large)

ALPINA BELGIUM, Alto Shaam Inc., American Range Corp., Attias Oven Corp., Bidvest Group Ltd., CB srl, Diamond Europe SA, Dimark Commercial Pty. Ltd., DOREGRILL SAS, Equipex LLC, Fri-Jado BV, Hardt Equipment, Henny Penny Corp., Hickory Industries Inc., Illinois Tool Works Inc., J and R Manufacturing LLC, ROLLER GRILL INTERNATIONAL SAS, Rotisol SA, The Middleby Corp., The Vollrath Co. LLC are a few of the key vendors in the Commercial Rotisserie Equipment market.

North America will register the highest growth rate of 40.1% among the other regions. Therefore, the Commercial Rotisserie Equipment market in North America is expected to garner significant business opportunities for the vendors during the forecast period.

US, Canada, Mexico, Germany, UK, France, Italy, Spain, The Netherlands, China, Japan, India, South Korea, Australia, Indonesia, Brazil, Argentina, Chile, Saudi Arabia, UAE, South Africa, Egypt, Nigeria

  • High profit margins in sale of rotisserie chicken is the driving factor this market.

The Commercial Rotisserie Equipment market vendors should focus on grabbing business opportunities from the Source of heat segment as it accounted for the largest market share in the base year.