
Computing Mouse Market Size 2025-2029
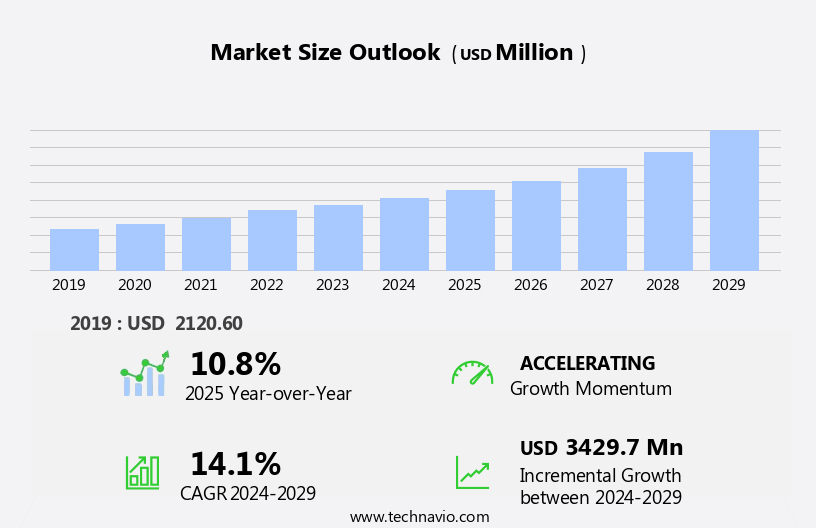
The computing mouse market size is forecast to increase by USD 3.43 billion at a CAGR of 14.1% between 2024 and 2029.
- The market is experiencing significant growth, driven by the increasing preference for wireless mouses and the demand for ergonomic designs that cater to the needs of the modern workforce. The wireless segment is expected to dominate the market due to the convenience and flexibility it offers, allowing users to work without the constraints of cords. Additionally, the ergonomic mouse segment is gaining traction as more individuals recognize the importance of reducing strain and improving comfort during long hours of computer use. However, the market faces challenges from the availability of refurbished and counterfeit products, which may negatively impact the revenue growth of original equipment manufacturers. Companies must focus on innovation and differentiation to maintain their market position and attract price-sensitive consumers. Strategic partnerships, collaborations, and mergers and acquisitions can also help market players expand their reach and enhance their product offerings. Overall, the market presents ample opportunities for growth, particularly in emerging economies where the adoption of computers and PC peripherals is on the rise. Companies seeking to capitalize on these opportunities must stay abreast of market trends and consumer preferences, and invest in research and development to meet the evolving needs of their customers.
What will be the Size of the Computing Mouse Market during the forecast period?
- The market is a dynamic and evolving industry catering to computer operators in their daily operations. Responsive computer mice continue to dominate the landscape, with innovations in ergonomic designs, wired and wireless connectivity, and multi-device compatibility driving growth. The market expansion is driven by various sectors, including video gamers, graphic design software users, and educational institutions. Advancements in technology have led to the emergence of gaming mice with high-end features such as customizable buttons, adjustable DPI sensors, and RGB lighting. Rough surface mice have gained traction in specific industries, offering enhanced precision and control. Innovative computing peripherals now offer multi-device connectivity, quick charging choices, and voice interaction capabilities, integrating virtual assistants and voice control features for added convenience.
- Battery life and design aesthetics are also key considerations, with high-end mice focusing on sleek ergonomics and extended battery life. Overall, the market is poised for continued growth, driven by the increasing reliance on computers for various applications and the demand for more responsive and feature-rich input devices.
How is this Computing Mouse Industry segmented?
The computing mouse industry research report provides comprehensive data (region-wise segment analysis), with forecasts and estimates in "USD billion" for the period 2025-2029, as well as historical data from 2019-2023 for the following segments.
- Product
- Wired
- Wireless
- Distribution Channel
- Offline
- Online
- Application
- Consumer purpose
- Commercial purpose
- Technology
- Optical mouse
- Laser mouse
- Capacitive mouse
- Hall effect
- Type
- Adjustable DPI
- Programmable buttons
- Gesture support
- Tilt scrolling
- Multi-device pairing
- Geography
- APAC
- Australia
- China
- India
- Japan
- South Korea
- North America
- US
- Canada
- Europe
- France
- Germany
- UK
- South America
- Middle East and Africa
- APAC
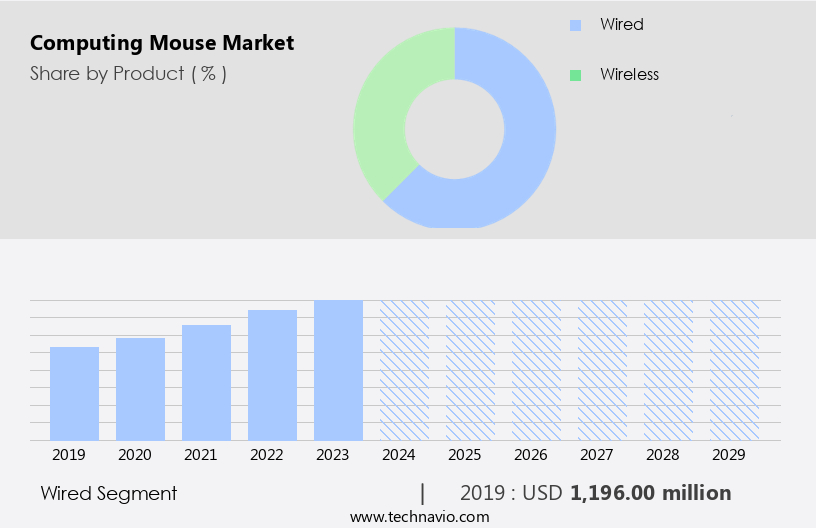
By Product Insights
The wired segment is estimated to witness significant growth during the forecast period. The market encompasses both wired and wireless mice, catering to various user groups such as computer operators and video gamers. Wired mice remain a preferred choice due to their faster response time and reduced input lag, which is crucial for professional applications like graphic design and gaming. However, the wireless segment is gaining traction with innovative computing peripherals that offer seamless computing experiences. These include voice assistant microphones with indirect voice control, smart computing devices, and ergonomic designs. Corporate professionals and domestic consumers alike source computing mice from specialty stores and online platforms.
Get a glance at the market report of share of various segments Request Free Sample
The wired segment was valued at USD 1.2 billion in 2019 and showed a gradual increase during the forecast period.
Regional Analysis
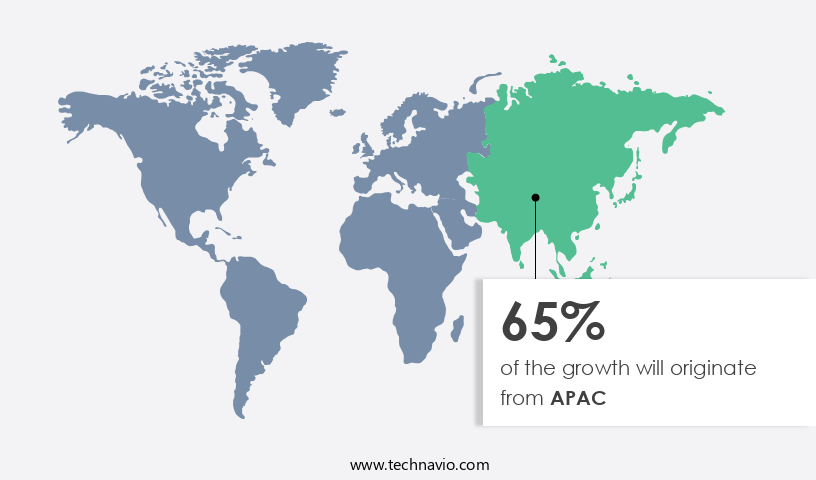
APAC is estimated to contribute 65% to the growth of the global market during the forecast period. Technavio's analysts have elaborately explained the regional trends and drivers that shape the market during the forecast period.
For more insights on the market size of various regions, Request Free Sample
The market in APAC, led by China, dominates global production due to its vast labor pool and manufacturing capabilities. Key APAC countries, including China, Hong Kong, Thailand, Singapore, Malaysia, the Philippines, South Korea, and Taiwan, contribute significantly to the production and export of computing mice. The increasing demand for personal computers in India, driven by both consumer and commercial sectors, further boosts the region's significance in the market. Computer operators, video gamers, and corporate professionals alike rely on innovative computing peripherals, such as wired and wireless mice, for a seamless computing experience. Ergonomic designs, configurable buttons, and high-end mice catering to graphic design software and gaming industries are popular choices.
Market Dynamics
Our researchers analyzed the data with 2024 as the base year, along with the key drivers, trends, and challenges. A holistic analysis of drivers will help companies refine their marketing strategies to gain a competitive advantage.
What are the key market drivers leading to the rise in the adoption of Computing Mouse Industry?
- Rising demand for wireless mouses is the key driver of the market. The computing industry has witnessed significant technological advancements, leading to the development of innovative products. While innovation in core computing components has been a priority, peripheral devices, including computing mice, have also undergone changes.
- Among these, wireless mice have gained popularity due to their flexibility and convenience. Unlike wired mice, wireless mice offer unencumbered movement and faster response times. This makes them an ideal choice for users who require computing access from a distance or use a secondary display, such as a TV. The wireless mouse's ability to function independently of a wired connection adds to its appeal. As a result, wireless mice have become a preferred accessory in the computing market.
What are the market trends shaping the Computing Mouse Industry?
- Increasing demand for ergonomic mouses is the upcoming market trend. An ergonomic mouse is a design solution aimed at mitigating discomfort and muscle strain during extended computer usage. Such health issues, including arthritis, carpal tunnel syndrome (CTS), and tendonitis, can stem from the improper positioning and movement of a conventional mouse.
- An ergonomic mouse, conversely, encourages a more natural hand position, reducing the likelihood of pain and strain in the forearms, hands, and shoulders. By supporting the user's hand in a comfortable position, an ergonomic mouse enables extended computer sessions without compromising arm strength. Furthermore, optical sensors and laser sensors offer varying levels of precision, while wireless technology, such as RF and adaptive frequency, ensures seamless connectivity. Virtual assistants and voice interaction are increasingly integrated into computing mice, enabling voice control features and voice commands for added convenience.
What challenges does the Computing Mouse Industry face during its growth?
- Availability of refurbished and counterfeit products is a key challenge affecting the industry growth. The e-commerce sector has witnessed substantial expansion in recent years, with Q1 2023 seeing a 15% penetration rate in the US market. Simultaneously, the issue of gray-market computing mice has emerged as a concern.
- Gray-market products, including refurbished and counterfeit computing mice, are sold by unauthorized channels that are not endorsed by genuine mouse manufacturers. Refurbished mice are repaired by equipment manufacturers but marketed as new items by unlawful sellers. In contrast, counterfeit mice are replicas of authentic products, designed to mimic branded items. The rise of these unauthorized sales channels poses a challenge to the integrity and reputation of genuine computing mouse companies. Online and direct stores offer a wide range of options for consumers, from wired and wireless mice to specialized gaming and ergonomic designs. High-end mice cater to power users, offering advanced features like multi-device connectivity, customizable DPI settings, and customizable buttons. Ultimately, the market continues to adapt to the evolving needs of its diverse user base, offering innovative solutions for a more productive and enjoyable computing experience.
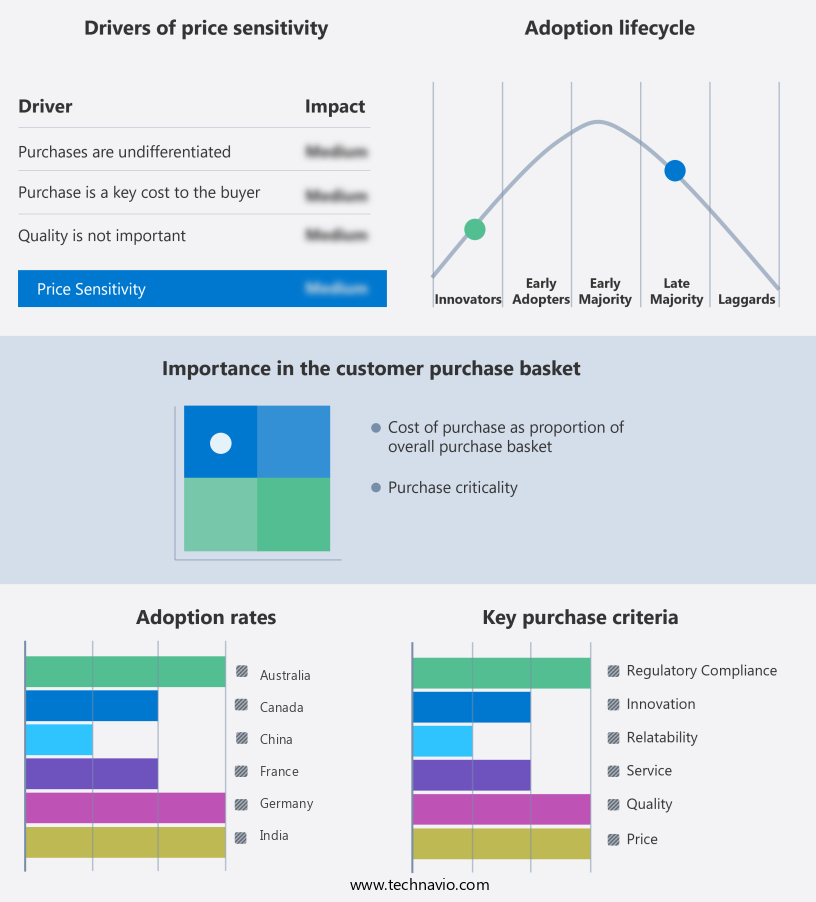
Exclusive Customer Landscape
The computing mouse market forecasting report includes the adoption lifecycle of the market, covering from the innovator's stage to the laggard's stage. It focuses on adoption rates in different regions based on penetration. Furthermore, the computing mouse market report also includes key purchase criteria and drivers of price sensitivity to help companies evaluate and develop their market growth analysis strategies.
Customer Landscape
Key Companies & Market Insights
Companies are implementing various strategies, such as strategic alliances, computing mouse market forecast, partnerships, mergers and acquisitions, geographical expansion, and product/service launches, to enhance their presence in the industry.
A4TECH - The company offers computing mouse that comes with a simple 4-button design which meet the needs of daily work and each button will give a fast and effective response and a quiet click.
The industry research and growth report includes detailed analyses of the competitive landscape of the market and information about key companies, including:
- Apple Inc.
- ASUSTeK Computer Inc.
- AZIO Corp.
- Bloody
- Cherry AG
- Cooler Master Technology Inc.
- Corsair Gaming Inc.
- COUGAR
- Dell Technologies Inc.
- Fnatic Ltd.
- Gigabyte Technology Co. Ltd.
- Hewlett Packard Enterprise Co.
- Jelly Comb
- Lenovo Group Ltd.
- Logitech International SA
- Mad Catz Global Ltd.
- Microsoft Corp.
- Razer Inc.
- Rx Infotech P Ltd.
- SteelSeries ApS
- TURTLE BEACH CORP.
Qualitative and quantitative analysis of companies has been conducted to help clients understand the wider business environment as well as the strengths and weaknesses of key industry players. Data is qualitatively analyzed to categorize companies as pure play, category-focused, industry-focused, and diversified; it is quantitatively analyzed to categorize companies as dominant, leading, strong, tentative, and weak.
Research Analyst Overview
The input device market, specifically computing mice, continues to evolve as technology advances and consumer needs change. These devices play a crucial role in enhancing the computing experience for various user groups, including computer operators and video gamers. Computing mice offer users a seamless experience by enabling precise and responsive interaction with smart computing devices. Innovative peripherals in this category include those with voice assistant microphones, enabling indirect voice control, further streamlining the user experience. Corporate professionals and domestic consumers alike seek computing mice designed for commercial purpose, with wired and wireless options catering to different preferences. Movement responsiveness and ergonomic designs are essential features for those working long hours to prevent repetitive strain injuries.
In addition, branded computer peripherals, such as gaming mice and ergonomic designs, cater to specific user needs. Gaming mice often come with configurable buttons and ergonomic mouse designs, while ergonomic mice feature sculpted forms, thumb rests, and adjustable palm supports. Graphic design software users may require high DPI settings and programmable buttons for optimal productivity. Educational institutions and wireless networking environments benefit from wireless technology, allowing for multi-device connectivity and quick charging choices. Mouse design plays a significant role in user comfort and productivity. Hand position, muscle strain, and input lag are essential considerations for both office workers and those in creative professions.
|
Market Scope |
|
|
Report Coverage |
Details |
|
Page number |
257 |
|
Base year |
2024 |
|
Historic period |
2019-2023 |
|
Forecast period |
2025-2029 |
|
Growth momentum & CAGR |
Accelerate at a CAGR of 14.1% |
|
Market growth 2025-2029 |
USD 3.43 billion |
|
Market structure |
Fragmented |
|
YoY growth 2024-2025(%) |
10.8 |
|
Key countries |
US, China, Canada, Japan, UK, India, Germany, France, South Korea, and Australia |
|
Competitive landscape |
Leading Companies, market growth and forecasting, Market Positioning of Companies, Competitive Strategies, and Industry Risks |
What are the Key Data Covered in this Computing Mouse Market Research and Growth Report?
- CAGR of the Computing Mouse industry during the forecast period
- Detailed information on factors that will drive the growth and forecasting between 2025 and 2029
- Precise estimation of the size of the market and its contribution of the industry in focus to the parent market
- Accurate predictions about upcoming growth and trends and changes in consumer behaviour
- Growth of the market across APAC, North America, Europe, South America, and Middle East and Africa
- Thorough analysis of the market's competitive landscape and detailed information about companies
- Comprehensive analysis of factors that will challenge the computing mouse market growth of industry companies
We can help! Our analysts can customize this computing mouse market research report to meet your requirements.
 RIA -
RIA - 
