Configure Price And Quote (CPQ) Software Market Analysis, Size, and Forecast 2026-2030: North America (US, Canada, and Mexico), Europe (Germany, UK, and France), APAC (China, Japan, and India), South America (Brazil and Argentina), Middle East and Africa (UAE, Saudi Arabia, and South Africa), and Rest of World (ROW)

Configure Price And Quote (CPQ) Software Market Analysis, Size, and Forecast 2026-2030:
North America (US, Canada, and Mexico), Europe (Germany, UK, and France), APAC (China, Japan, and India), South America (Brazil and Argentina), Middle East and Africa (UAE, Saudi Arabia, and South Africa), and Rest of World (ROW)

Published: Mar 2026 300 Pages SKU: IRTNTR41048

Market Overview at a Glance

$5.46 B
Market Opportunity
20.9%
CAGR 2025 - 2030
36.2%
North America Growth
$2.11 B
Cloud-based segment 2024

Configure Price And Quote (CPQ) Software Market Size 2026-2030

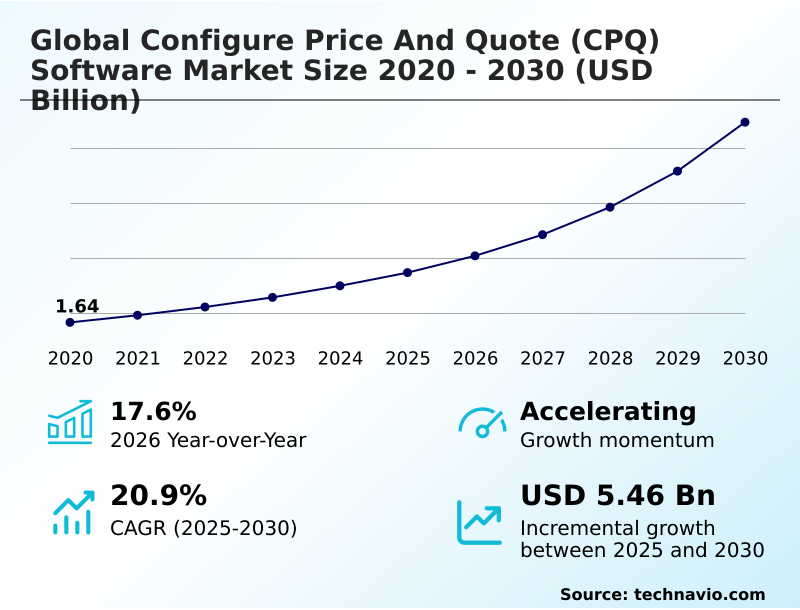
The configure price and quote (cpq) software market size is valued to increase by USD 5.46 billion, at a CAGR of 20.9% from 2025 to 2030. Increasing demand for sales process automation will drive the configure price and quote (cpq) software market.

Major Market Trends & Insights

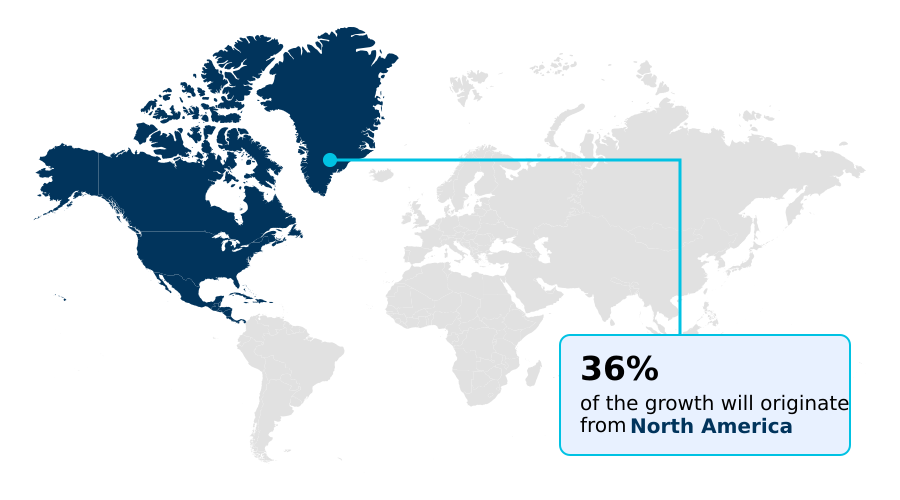
  • North America dominated the market and accounted for a 36.2% growth during the forecast period.
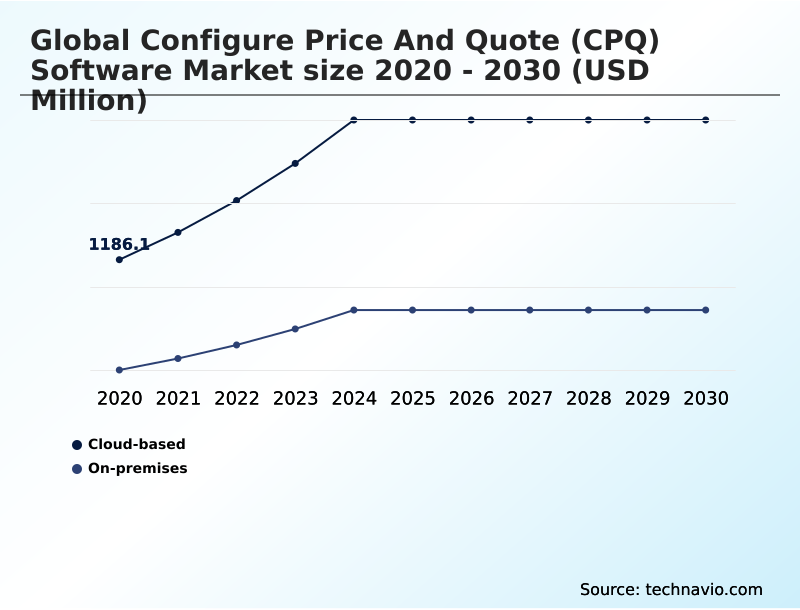
  • By Deployment - Cloud-based segment was valued at USD 2.11 billion in 2024
  • By End-user - IT and telecom segment accounted for the largest market revenue share in 2024

Market Size & Forecast

  • Market Opportunities: USD 7.28 billion
  • Market Future Opportunities: USD 5.46 billion
  • CAGR from 2025 to 2030 : 20.9%

Market Summary

  • The configure price and quote (CPQ) software market is evolving from a specialized sales tool into a strategic enterprise asset essential for navigating commercial complexity. The core function of this technology is to automate and streamline the entire quote-to-cash cycle, ensuring accuracy and speed in an increasingly competitive landscape.
  • Key drivers include the proliferation of highly configurable products and the shift toward subscription-based business models, which demand robust subscription lifecycle management. Businesses leverage CPQ for sophisticated sales process automation, which uses a rules-based engine to prevent the sale of incompatible product combinations, a common source of revenue leakage.
  • A notable trend is the integration of AI to provide guided selling recommendations and predictive pricing analytics, empowering sales teams to optimize deal value with real-time margin analysis. For instance, a manufacturer of industrial equipment can use a visual product configurator linked to its CPQ system to allow customers to build custom machinery online.
  • The system ensures all component selections are valid, calculates pricing instantly, and generates a professional quote, transforming a multi-day, error-prone manual task into a seamless, automated customer experience that directly accelerates revenue generation and improves profitability.

What will be the Size of the Configure Price And Quote (CPQ) Software Market during the forecast period?

Get Key Insights on Market Forecast (PDF) Request Free Sample

How is the Configure Price And Quote (CPQ) Software Market Segmented?

The configure price and quote (cpq) software industry research report provides comprehensive data (region-wise segment analysis), with forecasts and estimates in "USD million" for the period 2026-2030, as well as historical data from 2020-2024 for the following segments.

  • Deployment
    • Cloud-based
    • On-premises
  • End-user
    • IT and telecom
    • BFSI
    • Automobile
    • Others
  • Application
    • Product configuration
    • Quote generation
    • Pricing optimization
    • Others
  • Geography
    • North America
      • US
      • Canada
      • Mexico
    • Europe
      • Germany
      • UK
      • France
    • APAC
      • China
      • Japan
      • India
    • South America
      • Brazil
      • Argentina
    • Middle East and Africa
      • UAE
      • Saudi Arabia
      • South Africa
    • Rest of World (ROW)

By Deployment Insights

The cloud-based segment is estimated to witness significant growth during the forecast period.

The cloud-based segment is redefining how organizations execute complex sales, favored for its superior scalability and flexibility. This deployment model enables enterprises to adjust resource usage based on market demand without significant capital expenditure.

The SaaS paradigm facilitates automatic updates, ensuring tools remain current.

A key driver for adoption is the superior integration capability of cloud solutions, which use API-first development to connect with CRM and ERP platforms, creating a unified data ecosystem for revenue lifecycle management.

This empowers sales teams with a powerful sales enablement technology for accurate quoting from any location, a necessity in modern remote work environments.

This approach to complex product configuration and automated approval workflows leads to significant sales cycle acceleration, with some firms reporting a 30% reduction in quote turnaround time.

The model's opex-based financial structure and robust security protocols further drive its adoption in B2B digital commerce and for managing subscription billing solutions.

Request Free Sample

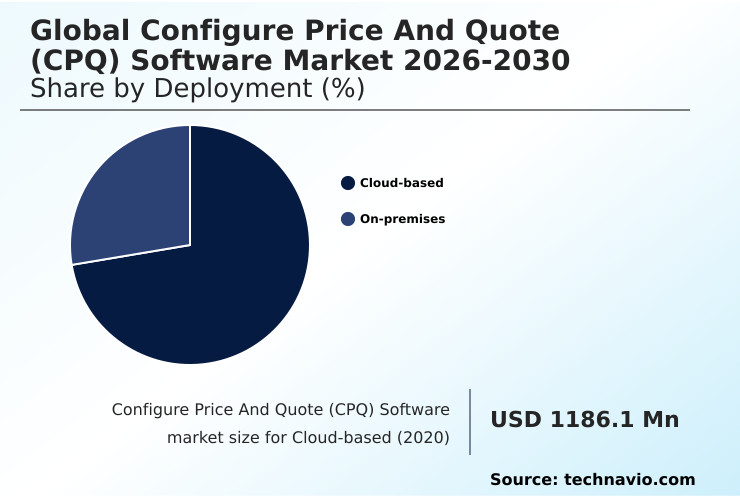
The Cloud-based segment was valued at USD 2.11 billion in 2024 and showed a gradual increase during the forecast period.

Request Free Sample

Regional Analysis

North America is estimated to contribute 36.2% to the growth of the global market during the forecast period.Technavio’s analysts have elaborately explained the regional trends and drivers that shape the market during the forecast period.

See How Configure Price And Quote (CPQ) Software Market Demand is Rising in North America Request Free Sample

The geographic landscape for configure price and quote (CPQ) software is led by North America, which accounts for over 36% of the incremental growth, driven by early adoption in its high-tech and manufacturing sectors.

Europe follows closely, with Germany's industrial base leveraging CPQ for complex engineering sales, contributing to the region's strong market position.

APAC is the fastest-growing region, with its expanding manufacturing and e-commerce sectors demanding solutions that provide omnichannel quoting consistency and multi-currency support to facilitate cross-border trade.

Across all regions, a key objective is effective channel sales enablement for partners and distributors.

The adoption of these platforms has enabled B2B sales teams to reduce manual quoting errors by up to 40%, enhancing the move toward more customer-centric quoting. The rise of the direct-to-consumer sales portal is another global factor accelerating adoption.

Market Dynamics

Our researchers analyzed the data with 2025 as the base year, along with the key drivers, trends, and challenges. A holistic analysis of drivers will help companies refine their marketing strategies to gain a competitive advantage.

  • The strategic adoption of configure price and quote (CPQ) software varies significantly by industry and business size, reflecting diverse operational needs. For instance, the use of cpq for manufacturing industry is critical for managing complex product catalogs and ensuring engineer-to-order accuracy, a stark contrast to how cpq software for telecom is used to bundle intricate service and subscription packages.
  • A successful cpq integration with crm is universally seen as fundamental, creating a seamless data flow from lead to revenue. Businesses evaluating the benefits of cpq software often focus on sales efficiency and error reduction. However, they must also consider the challenges in cpq implementation, such as data migration and user adoption.
  • Many seek out the best cpq software for small business, prioritizing ease of use and affordability, while larger enterprises focus on scalability. The growing subscription economy highlights the importance of cpq for subscription management, which differs from traditional transactional sales. Understanding cpq software pricing models is key to managing total cost of ownership.
  • The value of a cpq visual configurator benefits the customer experience, making complex choices intuitive. Ultimately, learning how cpq improves sales efficiency through automation is a core goal. Systems must handle cpq for complex product catalogs and support cpq and revenue recognition compliance.
  • Following cpq implementation best practices is essential, as is comparing cpq and erp systems to define their respective roles. The infusion of ai in cpq software is revolutionizing price optimization, while headless cpq for e-commerce is enabling customized online buying experiences. These tools are crucial for managing cpq for recurring revenue and designing cpq automation workflow examples.
  • The cpq role in digital transformation is undeniable, empowering cpq for b2b sales teams to close deals faster. Organizations using CPQ report that sales teams spend 25% more time on active selling compared to those using manual methods.

What are the key market drivers leading to the rise in the adoption of Configure Price And Quote (CPQ) Software Industry?

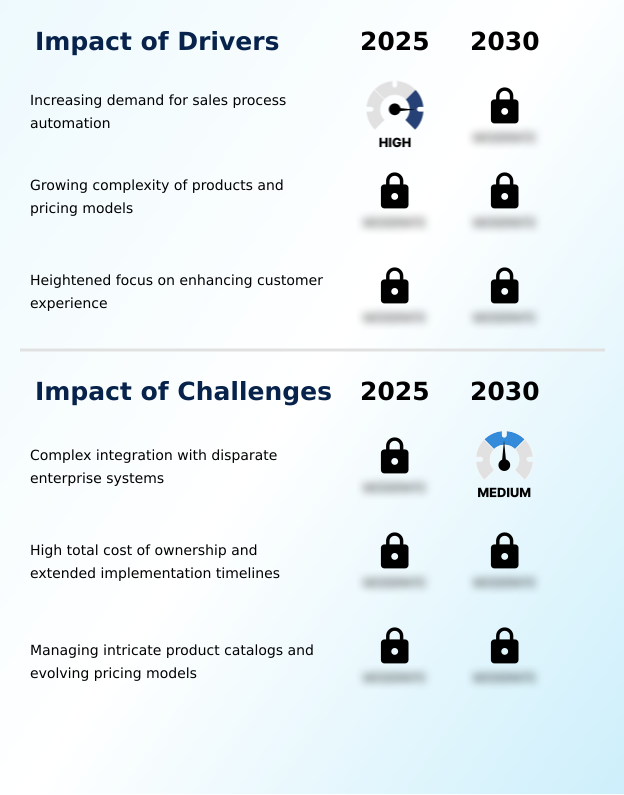
  • A key market driver is the increasing demand for sales process automation across enterprises.

  • The increasing demand for sales process automation is a major market driver, as businesses seek greater efficiency and accuracy. By automating quoting, companies achieve significant sales cycle acceleration, with leading adopters reporting a 30% faster time-to-quote.
  • This automation is crucial for managing the growing complexity of products and pricing models, where CPQ provides essential pricing governance and control.
  • This directly addresses margin leakage prevention, with automated systems reducing quoting errors by over 90% compared to manual spreadsheet-based methods. Furthermore, the heightened focus on enhancing customer experience propels adoption, as faster, more professional quoting improves satisfaction.
  • Integrated analytics also contribute to better sales performance management and overall quoting accuracy improvement.

What are the market trends shaping the Configure Price And Quote (CPQ) Software Industry?

  • The infusion of artificial intelligence is an emerging trend, enabling predictive quoting and advanced price optimization.

  • A primary trend shaping the market is the infusion of artificial intelligence to enable dynamic pricing and predictive quoting. This evolution transforms platforms into a sophisticated, data-driven revenue operations platform, moving beyond rule-based engines. Firms leveraging these tools have seen a 15% uplift in margins by optimizing price points in real-time.
  • Another significant trend is the convergence of CPQ with B2B e-commerce, leading to the rise of the self-service quoting portal. This facilitates a complete digital sales transformation by allowing customers to configure products and receive quotes instantly, a feature that has reduced sales-assist costs by up to 25%.
  • Finally, the integration with contract lifecycle management is becoming standard, ensuring a seamless flow from quote to legally binding agreement.

What challenges does the Configure Price And Quote (CPQ) Software Industry face during its growth?

  • The complexity of integrating with disparate enterprise systems presents a significant challenge to market growth.

  • A primary challenge is the complex integration of a modern enterprise quoting platform with disparate legacy systems, a process that can increase implementation timelines by up to 20%. The high total cost of ownership and extended deployments, particularly for firms with an engineer-to-order process or configure-to-order manufacturing operations, also present significant hurdles.
  • Managing intricate product catalogs and evolving pricing models remains a persistent operational difficulty, requiring dedicated administrative resources. For example, implementing a headless CPQ architecture for a self-service portal requires specialized expertise that can be difficult to source.
  • The intricacies of complex deal management, involving multiple currencies and regulatory requirements, further compound these challenges, with unsuccessful integrations often leading to a 10% to 15% drop in expected ROI.

Exclusive Technavio Analysis on Customer Landscape

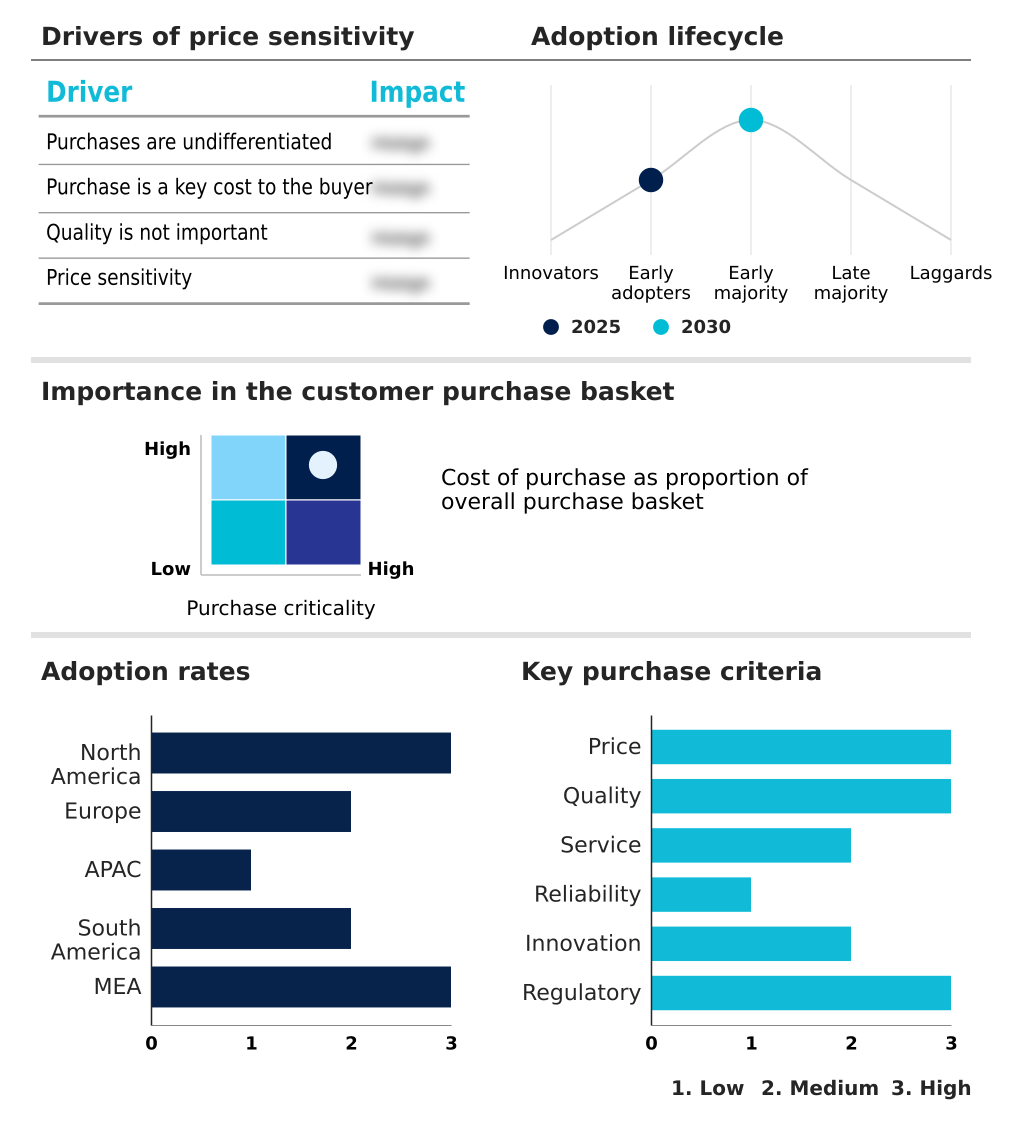
The configure price and quote (cpq) software market forecasting report includes the adoption lifecycle of the market, covering from the innovator’s stage to the laggard’s stage. It focuses on adoption rates in different regions based on penetration. Furthermore, the configure price and quote (cpq) software market report also includes key purchase criteria and drivers of price sensitivity to help companies evaluate and develop their market growth analysis strategies.

Customer Landscape of Configure Price And Quote (CPQ) Software Industry

Competitive Landscape

Companies are implementing various strategies, such as strategic alliances, configure price and quote (cpq) software market forecast, partnerships, mergers and acquisitions, geographical expansion, and product/service launches, to enhance their presence in the industry.

aspire technologies - Delivers configure price and quote (CPQ) software for streamlined quoting and proposal automation, designed to optimize customer system deployment, performance, and operational efficiency.

The industry research and growth report includes detailed analyses of the competitive landscape of the market and information about key companies, including:

  • aspire technologies
  • Bitrix24 Ltd.
  • Cincom Systems Inc.
  • CloudSense Ltd.
  • ConnectWise LLC
  • Experlogix LLC
  • Hansen Technologies Ltd.
  • IBM Corp.
  • Infor Inc.
  • Model N Inc.
  • Oracle Corp.
  • Pros Holdings Inc.
  • Revalize Inc.
  • Salesforce Inc.
  • SAP SE
  • ServiceNow Inc.
  • Tacton Systems AB
  • The Conga Way
  • Vendavo Inc.

Qualitative and quantitative analysis of companies has been conducted to help clients understand the wider business environment as well as the strengths and weaknesses of key industry players. Data is qualitatively analyzed to categorize companies as pure play, category-focused, industry-focused, and diversified; it is quantitatively analyzed to categorize companies as dominant, leading, strong, tentative, and weak.

Recent Development and News in Configure price and quote (cpq) software market

  • In April, 2025, Salesforce Inc. detailed its strategic roadmap for its Revenue Lifecycle Management platform, signaling a transition from its traditional managed package CPQ solutions to a core-native architecture.
  • In March, 2025, a report from the International Advanced Industries Consortium indicated that the average deployment time for enterprise-grade CPQ solutions had increased by nearly 20% over the preceding two years.
  • In May, 2025, the Regional Comprehensive Economic Partnership trade bloc announced an updated digital commerce chapter with provisions to streamline and secure complex B2B transactions across member nations.
  • In February, 2025, Oracle Corp. released the 25A update for its CPQ Cloud, introducing the new Redwood Quote UI and enhanced transaction management features for large-scale manufacturing clients.

Dive into Technavio’s robust research methodology, blending expert interviews, extensive data synthesis, and validated models for unparalleled Configure Price And Quote (CPQ) Software Market insights. See full methodology.

Market Scope
Page number 300
Base year 2025
Historic period 2020-2024
Forecast period 2026-2030
Growth momentum & CAGR Accelerate at a CAGR of 20.9%
Market growth 2026-2030 USD 5464.7 million
Market structure Fragmented
YoY growth 2025-2026(%) 17.6%
Key countries US, Canada, Mexico, Germany, UK, France, Italy, Spain, The Netherlands, China, Japan, India, South Korea, Australia, Indonesia, Brazil, Argentina, Chile, UAE, Saudi Arabia, South Africa, Egypt and Israel
Competitive landscape Leading Companies, Market Positioning of Companies, Competitive Strategies, and Industry Risks

Request Free Sample

Research Analyst Overview

  • Configure price and quote (CPQ) software has matured into a cornerstone of modern commercial operations, extending far beyond simple proposal generation automation. Its core is a powerful rules-based configuration engine that manages complex product configuration, preventing costly errors and ensuring bill of materials generation is accurate.
  • This technology is pivotal for the entire quote-to-cash cycle and is increasingly central to revenue lifecycle management. The move to subscription models has made subscription lifecycle management and the ability to handle co-terming contract amendments essential. Leading platforms now offer a visual product configurator for enhanced customer engagement and incorporate a dynamic pricing engine for real-time margin analysis.
  • The integration of AI provides predictive pricing analytics and guided selling recommendations, while automated approval workflows streamline governance. An API-first development approach and headless CPQ architecture are enabling seamless e-commerce integration and composable commerce integration.
  • Businesses that successfully deploy these solutions achieve omnichannel quoting consistency and robust multi-currency support, with some reporting a 15% increase in deal profitability through pricing optimization algorithms. This strategic adoption of sales process automation, paired with integrated contract lifecycle management, is now a boardroom-level imperative for achieving scalable growth in B2B digital commerce.

What are the Key Data Covered in this Configure Price And Quote (CPQ) Software Market Research and Growth Report?

  • What is the expected growth of the Configure Price And Quote (CPQ) Software Market between 2026 and 2030?

    • USD 5.46 billion, at a CAGR of 20.9%

  • What segmentation does the market report cover?

    • The report is segmented by Deployment (Cloud-based, and On-premises), End-user (IT and telecom, BFSI, Automobile, and Others), Application (Product configuration, Quote generation, Pricing optimization, and Others) and Geography (North America, Europe, APAC, South America, Middle East and Africa)

  • Which regions are analyzed in the report?

    • North America, Europe, APAC, South America and Middle East and Africa

  • What are the key growth drivers and market challenges?

    • Increasing demand for sales process automation, Complex integration with disparate enterprise systems

  • Who are the major players in the Configure Price And Quote (CPQ) Software Market?

    • aspire technologies, Bitrix24 Ltd., Cincom Systems Inc., CloudSense Ltd., ConnectWise LLC, Experlogix LLC, Hansen Technologies Ltd., IBM Corp., Infor Inc., Model N Inc., Oracle Corp., Pros Holdings Inc., Revalize Inc., Salesforce Inc., SAP SE, ServiceNow Inc., Tacton Systems AB, The Conga Way and Vendavo Inc.

Market Research Insights

  • Modern enterprise quoting platforms are central to digital sales transformation, providing sophisticated product configuration software and advanced pricing management software to enhance commercial operations. Adoption of these B2B quoting tools has demonstrated a direct impact on performance, with businesses achieving up to 95% quoting accuracy improvement and a 30% reduction in approval times through deal desk automation.
  • This sales cycle acceleration is critical in competitive environments. By creating a guided buying experience with integrated sales quoting software, companies not only improve customer satisfaction but also see a 10% increase in average deal size by presenting optimized upsell and cross-sell opportunities. These platforms have become indispensable for managing complex transactions and driving revenue efficiency.

We can help! Our analysts can customize this configure price and quote (cpq) software market research report to meet your requirements.

Get in touch

1. Executive Summary

1.1 Market overview

Executive Summary - Chart on Market Overview
Executive Summary - Data Table on Market Overview
Executive Summary - Chart on Global Market Characteristics
Executive Summary - Chart on Market by Geography
Executive Summary - Chart on Market Segmentation by Deployment
Executive Summary - Chart on Market Segmentation by End-user
Executive Summary - Chart on Market Segmentation by Application
Executive Summary - Chart on Incremental Growth
Executive Summary - Data Table on Incremental Growth
Executive Summary - Chart on Company Market Positioning

2. Technavio Analysis

2.1 Analysis of price sensitivity, lifecycle, customer purchase basket, adoption rates, and purchase criteria

2.2 Criticality of inputs and Factors of differentiation

Chart on Overview on criticality of inputs and factors of differentiation

2.3 Factors of disruption

Chart on Overview on factors of disruption

2.4 Impact of drivers and challenges

Chart on Impact of drivers and challenges in 2025 and 2030

3. Market Landscape

3.1 Market ecosystem

Chart on Parent Market
Data Table on - Parent Market

3.2 Market characteristics

Chart on Market characteristics analysis

3.3 Value chain analysis

Chart on Value chain analysis

4. Market Sizing

4.1 Market definition

Data Table on Offerings of companies included in the market definition

4.2 Market segment analysis

Market segments

4.3 Market size 2025

4.4 Market outlook: Forecast for 2025-2030

Chart on Global - Market size and forecast 2025-2030 ($ million)
Data Table on Global - Market size and forecast 2025-2030 ($ million)
Chart on Global Market: Year-over-year growth 2025-2030 (%)
Data Table on Global Market: Year-over-year growth 2025-2030 (%)

5. Historic Market Size

5.1 Global Configure Price And Quote (CPQ) Software Market 2020 - 2024

Historic Market Size - Data Table on Global Configure Price And Quote (CPQ) Software Market 2020 - 2024 ($ million)

5.2 Deployment segment analysis 2020 - 2024

Historic Market Size - Deployment Segment 2020 - 2024 ($ million)

5.3 End-user segment analysis 2020 - 2024

Historic Market Size - End-user Segment 2020 - 2024 ($ million)

5.4 Application segment analysis 2020 - 2024

Historic Market Size - Application Segment 2020 - 2024 ($ million)

5.5 Geography segment analysis 2020 - 2024

Historic Market Size - Geography Segment 2020 - 2024 ($ million)

5.6 Country segment analysis 2020 - 2024

Historic Market Size - Country Segment 2020 - 2024 ($ million)

6. Qualitative Analysis

6.1 Impact of AI in global configure price and quote (CPQ) software market

7. Five Forces Analysis

7.1 Five forces summary

Five forces analysis - Comparison between 2025 and 2030

7.2 Bargaining power of buyers

Bargaining power of buyers - Impact of key factors 2025 and 2030

7.3 Bargaining power of suppliers

Bargaining power of suppliers - Impact of key factors in 2025 and 2030

7.4 Threat of new entrants

Threat of new entrants - Impact of key factors in 2025 and 2030

7.5 Threat of substitutes

Threat of substitutes - Impact of key factors in 2025 and 2030

7.6 Threat of rivalry

Threat of rivalry - Impact of key factors in 2025 and 2030

7.7 Market condition

Chart on Market condition - Five forces 2025 and 2030

8. Market Segmentation by Deployment

8.1 Market segments

Chart on Deployment - Market share 2025-2030 (%)
Data Table on Deployment - Market share 2025-2030 (%)

8.2 Comparison by Deployment

Chart on Comparison by Deployment
Data Table on Comparison by Deployment

8.3 Cloud-based - Market size and forecast 2025-2030

Chart on Cloud-based - Market size and forecast 2025-2030 ($ million)
Data Table on Cloud-based - Market size and forecast 2025-2030 ($ million)
Chart on Cloud-based - Year-over-year growth 2025-2030 (%)
Data Table on Cloud-based - Year-over-year growth 2025-2030 (%)

8.4 On-premises - Market size and forecast 2025-2030

Chart on On-premises - Market size and forecast 2025-2030 ($ million)
Data Table on On-premises - Market size and forecast 2025-2030 ($ million)
Chart on On-premises - Year-over-year growth 2025-2030 (%)
Data Table on On-premises - Year-over-year growth 2025-2030 (%)

8.5 Market opportunity by Deployment

Market opportunity by Deployment ($ million)
Data Table on Market opportunity by Deployment ($ million)

9. Market Segmentation by End-user

9.1 Market segments

Chart on End-user - Market share 2025-2030 (%)
Data Table on End-user - Market share 2025-2030 (%)

9.2 Comparison by End-user

Chart on Comparison by End-user
Data Table on Comparison by End-user

9.3 IT and telecom - Market size and forecast 2025-2030

Chart on IT and telecom - Market size and forecast 2025-2030 ($ million)
Data Table on IT and telecom - Market size and forecast 2025-2030 ($ million)
Chart on IT and telecom - Year-over-year growth 2025-2030 (%)
Data Table on IT and telecom - Year-over-year growth 2025-2030 (%)

9.4 BFSI - Market size and forecast 2025-2030

Chart on BFSI - Market size and forecast 2025-2030 ($ million)
Data Table on BFSI - Market size and forecast 2025-2030 ($ million)
Chart on BFSI - Year-over-year growth 2025-2030 (%)
Data Table on BFSI - Year-over-year growth 2025-2030 (%)

9.5 Automobile - Market size and forecast 2025-2030

Chart on Automobile - Market size and forecast 2025-2030 ($ million)
Data Table on Automobile - Market size and forecast 2025-2030 ($ million)
Chart on Automobile - Year-over-year growth 2025-2030 (%)
Data Table on Automobile - Year-over-year growth 2025-2030 (%)

9.6 Others - Market size and forecast 2025-2030

Chart on Others - Market size and forecast 2025-2030 ($ million)
Data Table on Others - Market size and forecast 2025-2030 ($ million)
Chart on Others - Year-over-year growth 2025-2030 (%)
Data Table on Others - Year-over-year growth 2025-2030 (%)

9.7 Market opportunity by End-user

Market opportunity by End-user ($ million)
Data Table on Market opportunity by End-user ($ million)

10. Market Segmentation by Application

10.1 Market segments

Chart on Application - Market share 2025-2030 (%)
Data Table on Application - Market share 2025-2030 (%)

10.2 Comparison by Application

Chart on Comparison by Application
Data Table on Comparison by Application

10.3 Product configuration - Market size and forecast 2025-2030

Chart on Product configuration - Market size and forecast 2025-2030 ($ million)
Data Table on Product configuration - Market size and forecast 2025-2030 ($ million)
Chart on Product configuration - Year-over-year growth 2025-2030 (%)
Data Table on Product configuration - Year-over-year growth 2025-2030 (%)

10.4 Quote generation - Market size and forecast 2025-2030

Chart on Quote generation - Market size and forecast 2025-2030 ($ million)
Data Table on Quote generation - Market size and forecast 2025-2030 ($ million)
Chart on Quote generation - Year-over-year growth 2025-2030 (%)
Data Table on Quote generation - Year-over-year growth 2025-2030 (%)

10.5 Pricing optimization - Market size and forecast 2025-2030

Chart on Pricing optimization - Market size and forecast 2025-2030 ($ million)
Data Table on Pricing optimization - Market size and forecast 2025-2030 ($ million)
Chart on Pricing optimization - Year-over-year growth 2025-2030 (%)
Data Table on Pricing optimization - Year-over-year growth 2025-2030 (%)

10.6 Others - Market size and forecast 2025-2030

Chart on Others - Market size and forecast 2025-2030 ($ million)
Data Table on Others - Market size and forecast 2025-2030 ($ million)
Chart on Others - Year-over-year growth 2025-2030 (%)
Data Table on Others - Year-over-year growth 2025-2030 (%)

10.7 Market opportunity by Application

Market opportunity by Application ($ million)
Data Table on Market opportunity by Application ($ million)

11. Customer Landscape

11.1 Customer landscape overview

Analysis of price sensitivity, lifecycle, customer purchase basket, adoption rates, and purchase criteria

12. Geographic Landscape

12.1 Geographic segmentation

Chart on Market share by geography 2025-2030 (%)
Data Table on Market share by geography 2025-2030 (%)

12.2 Geographic comparison

Chart on Geographic comparison
Data Table on Geographic comparison

12.3 North America - Market size and forecast 2025-2030

Chart on North America - Market size and forecast 2025-2030 ($ million)
Data Table on North America - Market size and forecast 2025-2030 ($ million)
Chart on North America - Year-over-year growth 2025-2030 (%)
Data Table on North America - Year-over-year growth 2025-2030 (%)
Chart on Regional Comparison - North America
Data Table on Regional Comparison - North America

12.3.1 US - Market size and forecast 2025-2030

Chart on US - Market size and forecast 2025-2030 ($ million)
Data Table on US - Market size and forecast 2025-2030 ($ million)
Chart on US - Year-over-year growth 2025-2030 (%)
Data Table on US - Year-over-year growth 2025-2030 (%)

12.3.2 Canada - Market size and forecast 2025-2030

Chart on Canada - Market size and forecast 2025-2030 ($ million)
Data Table on Canada - Market size and forecast 2025-2030 ($ million)
Chart on Canada - Year-over-year growth 2025-2030 (%)
Data Table on Canada - Year-over-year growth 2025-2030 (%)

12.3.3 Mexico - Market size and forecast 2025-2030

Chart on Mexico - Market size and forecast 2025-2030 ($ million)
Data Table on Mexico - Market size and forecast 2025-2030 ($ million)
Chart on Mexico - Year-over-year growth 2025-2030 (%)
Data Table on Mexico - Year-over-year growth 2025-2030 (%)

12.4 Europe - Market size and forecast 2025-2030

Chart on Europe - Market size and forecast 2025-2030 ($ million)
Data Table on Europe - Market size and forecast 2025-2030 ($ million)
Chart on Europe - Year-over-year growth 2025-2030 (%)
Data Table on Europe - Year-over-year growth 2025-2030 (%)
Chart on Regional Comparison - Europe
Data Table on Regional Comparison - Europe

12.4.1 Germany - Market size and forecast 2025-2030

Chart on Germany - Market size and forecast 2025-2030 ($ million)
Data Table on Germany - Market size and forecast 2025-2030 ($ million)
Chart on Germany - Year-over-year growth 2025-2030 (%)
Data Table on Germany - Year-over-year growth 2025-2030 (%)

12.4.2 UK - Market size and forecast 2025-2030

Chart on UK - Market size and forecast 2025-2030 ($ million)
Data Table on UK - Market size and forecast 2025-2030 ($ million)
Chart on UK - Year-over-year growth 2025-2030 (%)
Data Table on UK - Year-over-year growth 2025-2030 (%)

12.4.3 France - Market size and forecast 2025-2030

Chart on France - Market size and forecast 2025-2030 ($ million)
Data Table on France - Market size and forecast 2025-2030 ($ million)
Chart on France - Year-over-year growth 2025-2030 (%)
Data Table on France - Year-over-year growth 2025-2030 (%)

12.4.4 Italy - Market size and forecast 2025-2030

Chart on Italy - Market size and forecast 2025-2030 ($ million)
Data Table on Italy - Market size and forecast 2025-2030 ($ million)
Chart on Italy - Year-over-year growth 2025-2030 (%)
Data Table on Italy - Year-over-year growth 2025-2030 (%)

12.4.5 Spain - Market size and forecast 2025-2030

Chart on Spain - Market size and forecast 2025-2030 ($ million)
Data Table on Spain - Market size and forecast 2025-2030 ($ million)
Chart on Spain - Year-over-year growth 2025-2030 (%)
Data Table on Spain - Year-over-year growth 2025-2030 (%)

12.4.6 The Netherlands - Market size and forecast 2025-2030

Chart on The Netherlands - Market size and forecast 2025-2030 ($ million)
Data Table on The Netherlands - Market size and forecast 2025-2030 ($ million)
Chart on The Netherlands - Year-over-year growth 2025-2030 (%)
Data Table on The Netherlands - Year-over-year growth 2025-2030 (%)

12.5 APAC - Market size and forecast 2025-2030

Chart on APAC - Market size and forecast 2025-2030 ($ million)
Data Table on APAC - Market size and forecast 2025-2030 ($ million)
Chart on APAC - Year-over-year growth 2025-2030 (%)
Data Table on APAC - Year-over-year growth 2025-2030 (%)
Chart on Regional Comparison - APAC
Data Table on Regional Comparison - APAC

12.5.1 China - Market size and forecast 2025-2030

Chart on China - Market size and forecast 2025-2030 ($ million)
Data Table on China - Market size and forecast 2025-2030 ($ million)
Chart on China - Year-over-year growth 2025-2030 (%)
Data Table on China - Year-over-year growth 2025-2030 (%)

12.5.2 Japan - Market size and forecast 2025-2030

Chart on Japan - Market size and forecast 2025-2030 ($ million)
Data Table on Japan - Market size and forecast 2025-2030 ($ million)
Chart on Japan - Year-over-year growth 2025-2030 (%)
Data Table on Japan - Year-over-year growth 2025-2030 (%)

12.5.3 India - Market size and forecast 2025-2030

Chart on India - Market size and forecast 2025-2030 ($ million)
Data Table on India - Market size and forecast 2025-2030 ($ million)
Chart on India - Year-over-year growth 2025-2030 (%)
Data Table on India - Year-over-year growth 2025-2030 (%)

12.5.4 South Korea - Market size and forecast 2025-2030

Chart on South Korea - Market size and forecast 2025-2030 ($ million)
Data Table on South Korea - Market size and forecast 2025-2030 ($ million)
Chart on South Korea - Year-over-year growth 2025-2030 (%)
Data Table on South Korea - Year-over-year growth 2025-2030 (%)

12.5.5 Australia - Market size and forecast 2025-2030

Chart on Australia - Market size and forecast 2025-2030 ($ million)
Data Table on Australia - Market size and forecast 2025-2030 ($ million)
Chart on Australia - Year-over-year growth 2025-2030 (%)
Data Table on Australia - Year-over-year growth 2025-2030 (%)

12.5.6 Indonesia - Market size and forecast 2025-2030

Chart on Indonesia - Market size and forecast 2025-2030 ($ million)
Data Table on Indonesia - Market size and forecast 2025-2030 ($ million)
Chart on Indonesia - Year-over-year growth 2025-2030 (%)
Data Table on Indonesia - Year-over-year growth 2025-2030 (%)

12.6 South America - Market size and forecast 2025-2030

Chart on South America - Market size and forecast 2025-2030 ($ million)
Data Table on South America - Market size and forecast 2025-2030 ($ million)
Chart on South America - Year-over-year growth 2025-2030 (%)
Data Table on South America - Year-over-year growth 2025-2030 (%)
Chart on Regional Comparison - South America
Data Table on Regional Comparison - South America

12.6.1 Brazil - Market size and forecast 2025-2030

Chart on Brazil - Market size and forecast 2025-2030 ($ million)
Data Table on Brazil - Market size and forecast 2025-2030 ($ million)
Chart on Brazil - Year-over-year growth 2025-2030 (%)
Data Table on Brazil - Year-over-year growth 2025-2030 (%)

12.6.2 Argentina - Market size and forecast 2025-2030

Chart on Argentina - Market size and forecast 2025-2030 ($ million)
Data Table on Argentina - Market size and forecast 2025-2030 ($ million)
Chart on Argentina - Year-over-year growth 2025-2030 (%)
Data Table on Argentina - Year-over-year growth 2025-2030 (%)

12.6.3 Chile - Market size and forecast 2025-2030

Chart on Chile - Market size and forecast 2025-2030 ($ million)
Data Table on Chile - Market size and forecast 2025-2030 ($ million)
Chart on Chile - Year-over-year growth 2025-2030 (%)
Data Table on Chile - Year-over-year growth 2025-2030 (%)

12.7 Middle East and Africa - Market size and forecast 2025-2030

Chart on Middle East and Africa - Market size and forecast 2025-2030 ($ million)
Data Table on Middle East and Africa - Market size and forecast 2025-2030 ($ million)
Chart on Middle East and Africa - Year-over-year growth 2025-2030 (%)
Data Table on Middle East and Africa - Year-over-year growth 2025-2030 (%)
Chart on Regional Comparison - Middle East and Africa
Data Table on Regional Comparison - Middle East and Africa

12.7.1 UAE - Market size and forecast 2025-2030

Chart on UAE - Market size and forecast 2025-2030 ($ million)
Data Table on UAE - Market size and forecast 2025-2030 ($ million)
Chart on UAE - Year-over-year growth 2025-2030 (%)
Data Table on UAE - Year-over-year growth 2025-2030 (%)

12.7.2 Saudi Arabia - Market size and forecast 2025-2030

Chart on Saudi Arabia - Market size and forecast 2025-2030 ($ million)
Data Table on Saudi Arabia - Market size and forecast 2025-2030 ($ million)
Chart on Saudi Arabia - Year-over-year growth 2025-2030 (%)
Data Table on Saudi Arabia - Year-over-year growth 2025-2030 (%)

12.7.3 South Africa - Market size and forecast 2025-2030

Chart on South Africa - Market size and forecast 2025-2030 ($ million)
Data Table on South Africa - Market size and forecast 2025-2030 ($ million)
Chart on South Africa - Year-over-year growth 2025-2030 (%)
Data Table on South Africa - Year-over-year growth 2025-2030 (%)

12.7.4 Egypt - Market size and forecast 2025-2030

Chart on Egypt - Market size and forecast 2025-2030 ($ million)
Data Table on Egypt - Market size and forecast 2025-2030 ($ million)
Chart on Egypt - Year-over-year growth 2025-2030 (%)
Data Table on Egypt - Year-over-year growth 2025-2030 (%)

12.7.5 Israel - Market size and forecast 2025-2030

Chart on Israel - Market size and forecast 2025-2030 ($ million)
Data Table on Israel - Market size and forecast 2025-2030 ($ million)
Chart on Israel - Year-over-year growth 2025-2030 (%)
Data Table on Israel - Year-over-year growth 2025-2030 (%)

12.8 Market opportunity by geography

Market opportunity by geography ($ million)
Data Tables on Market opportunity by geography ($ million)

13. Drivers, Challenges, and Opportunity

13.1 Market drivers

Increasing demand for sales process automation
Growing complexity of products and pricing models
Heightened focus on enhancing customer experience

13.2 Market challenges

Complex integration with disparate enterprise systems
High total cost of ownership and extended implementation timelines
Managing intricate product catalogs and evolving pricing models

13.3 Impact of drivers and challenges

Impact of drivers and challenges in 2025 and 2030

13.4 Market opportunities

Infusion of artificial intelligence for predictive quoting and price optimization
Convergence of CPQ with e-commerce and self-service channels
CPQs essential role in managing subscription and usage-based revenue models

14. Competitive Landscape

14.1 Overview

14.2

Overview on criticality of inputs and factors of differentiation

14.3 Landscape disruption

Overview on factors of disruption

14.4 Industry risks

Impact of key risks on business

15. Competitive Analysis

15.1 Companies profiled

Companies covered

15.2 Company ranking index

15.3 Market positioning of companies

Matrix on companies position and classification

15.4 aspire technologies

aspire technologies - Overview
aspire technologies - Product / Service
aspire technologies - Key offerings
SWOT

15.5 Bitrix24 Ltd.

Bitrix24 Ltd. - Overview
Bitrix24 Ltd. - Product / Service
Bitrix24 Ltd. - Key offerings
SWOT

15.6 Cincom Systems Inc.

Cincom Systems Inc. - Overview
Cincom Systems Inc. - Product / Service
Cincom Systems Inc. - Key offerings
SWOT

15.7 CloudSense Ltd.

CloudSense Ltd. - Overview
CloudSense Ltd. - Product / Service
CloudSense Ltd. - Key offerings
SWOT

15.8 ConnectWise LLC

ConnectWise LLC - Overview
ConnectWise LLC - Product / Service
ConnectWise LLC - Key offerings
SWOT

15.9 Experlogix LLC

Experlogix LLC - Overview
Experlogix LLC - Product / Service
Experlogix LLC - Key offerings
SWOT

15.10 Hansen Technologies Ltd.

Hansen Technologies Ltd. - Overview
Hansen Technologies Ltd. - Product / Service
Hansen Technologies Ltd. - Key news
Hansen Technologies Ltd. - Key offerings
SWOT

15.11 IBM Corp.

IBM Corp. - Overview
IBM Corp. - Business segments
IBM Corp. - Key news
IBM Corp. - Key offerings
IBM Corp. - Segment focus
SWOT

15.12 Infor Inc.

Infor Inc. - Overview
Infor Inc. - Product / Service
Infor Inc. - Key news
Infor Inc. - Key offerings
SWOT

15.13 Model N Inc.

Model N Inc. - Overview
Model N Inc. - Product / Service
Model N Inc. - Key offerings
SWOT

15.14 Oracle Corp.

Oracle Corp. - Overview
Oracle Corp. - Business segments
Oracle Corp. - Key news
Oracle Corp. - Key offerings
Oracle Corp. - Segment focus
SWOT

15.15 Pros Holdings Inc.

Pros Holdings Inc. - Overview
Pros Holdings Inc. - Product / Service
Pros Holdings Inc. - Key offerings
SWOT

15.16 Revalize Inc.

Revalize Inc. - Overview
Revalize Inc. - Product / Service
Revalize Inc. - Key offerings
SWOT

15.17 Salesforce Inc.

Salesforce Inc. - Overview
Salesforce Inc. - Product / Service
Salesforce Inc. - Key news
Salesforce Inc. - Key offerings
SWOT

15.18 SAP SE

SAP SE - Overview
SAP SE - Business segments
SAP SE - Key news
SAP SE - Key offerings
SAP SE - Segment focus
SWOT

16. Appendix

16.1 Scope of the report

Market definition
Objectives
Notes and caveats

16.2 Inclusions and exclusions checklist

Inclusions checklist
Exclusions checklist

16.3 Currency conversion rates for US$

16.4 Research methodology

16.5 Data procurement

Information sources

16.6 Data validation

16.7 Validation techniques employed for market sizing

16.8 Data synthesis

16.9 360 degree market analysis

16.10 List of abbreviations

Research Methodology

Technavio presents a detailed picture of the market by way of study, synthesis, and summation of data from multiple sources. The analysts have presented the various facets of the market with a particular focus on identifying the key industry influencers. The data thus presented is comprehensive, reliable, and the result of extensive research, both primary and secondary.

INFORMATION SOURCES

Primary sources

  • Manufacturers and suppliers
  • Channel partners
  • Industry experts
  • Strategic decision makers

Secondary sources

  • Industry journals and periodicals
  • Government data
  • Financial reports of key industry players
  • Historical data
  • Press releases

DATA ANALYSIS

Data Synthesis

  • Collation of data
  • Estimation of key figures
  • Analysis of derived insights

Data Validation

  • Triangulation with data models
  • Reference against proprietary databases
  • Corroboration with industry experts

REPORT WRITING

Qualitative

  • Market drivers
  • Market challenges
  • Market trends
  • Five forces analysis

Quantitative

  • Market size and forecast
  • Market segmentation
  • Geographical insights
  • Competitive landscape

Interested in this report?

Get your sample now to see our research methodology and insights!

Download Now

Frequently Asked Questions

Configure Price And Quote (CPQ) Software market growth will increase by USD 5464.7 million during 2026-2030.

The Configure Price And Quote (CPQ) Software market is expected to grow at a CAGR of 20.9% during 2026-2030.

Configure Price And Quote (CPQ) Software market is segmented by Deployment (Cloud-based, On-premises) End-user (IT and telecom, BFSI, Automobile, Others) Application (Product configuration, Quote generation, Pricing optimization, Others)

aspire technologies, Bitrix24 Ltd., Cincom Systems Inc., CloudSense Ltd., ConnectWise LLC, Experlogix LLC, Hansen Technologies Ltd., IBM Corp., Infor Inc., Model N Inc., Oracle Corp., Pros Holdings Inc., Revalize Inc., Salesforce Inc., SAP SE, ServiceNow Inc., Tacton Systems AB, The Conga Way, Vendavo Inc. are a few of the key vendors in the Configure Price And Quote (CPQ) Software market.

North America will register the highest growth rate of 36.2% among the other regions. Therefore, the Configure Price And Quote (CPQ) Software market in North America is expected to garner significant business opportunities for the vendors during the forecast period.

US, Canada, Mexico, Germany, UK, France, Italy, Spain, The Netherlands, China, Japan, India, South Korea, Australia, Indonesia, Brazil, Argentina, Chile, UAE, Saudi Arabia, South Africa, Egypt, Israel

  • Increasing demand for sales process automation is the driving factor this market.

The Configure Price And Quote (CPQ) Software market vendors should focus on grabbing business opportunities from the Deployment segment as it accounted for the largest market share in the base year.