US Construction Aggregates Market Size 2025-2029
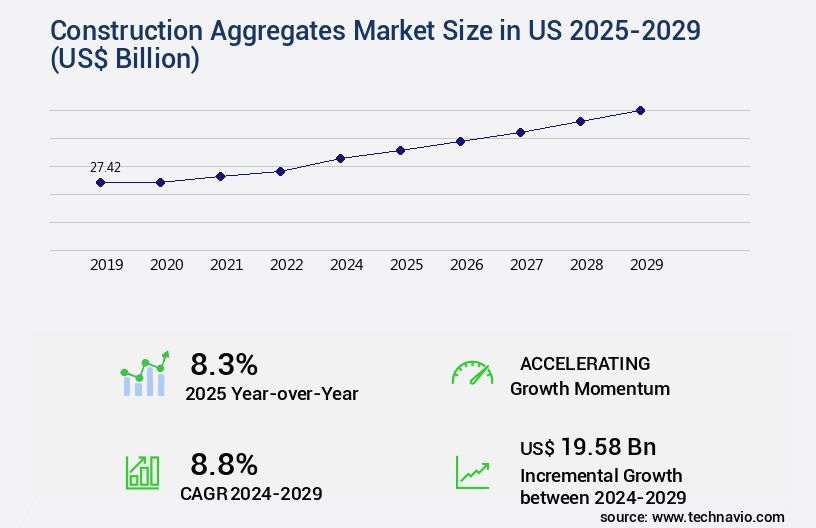
The us construction aggregates market size is valued to increase USD 19.58 billion, at a CAGR of 8.8% from 2024 to 2029. Increasing investment by government for infrastructure development will drive the us construction aggregates market.
Major Market Trends & Insights
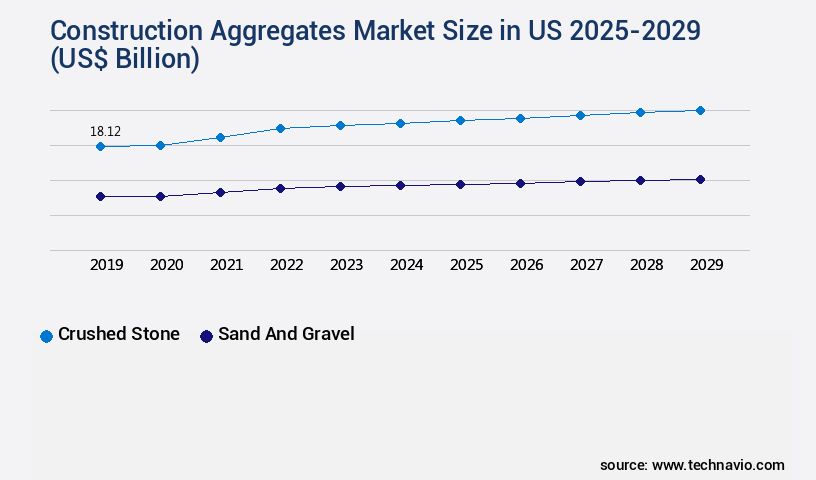
- By Product - Crushed stone segment was valued at USD 18.12 billion in 2022
- By Type - Coarse segment accounted for the largest market revenue share in 2022
Market Size & Forecast
- Market Opportunities: USD 108.17 billion
- Market Future Opportunities: USD 19.58 billion
- CAGR from 2024 to 2029 : 8.8%
Market Summary
- The Construction Aggregates Market in the US is a dynamic and continually evolving industry, driven by increasing investment in infrastructure development and technological advancements in construction techniques and materials. According to the US Geological Survey, the United States was the world's largest producer of construction aggregates in 2020, accounting for approximately 28% of the global production. This market's growth is fueled by the construction industry's ongoing demand for materials such as sand, gravel, and crushed stone. However, the market faces challenges, including fluctuating material costs and regulatory requirements. For instance, the Environmental Protection Agency's (EPA) regulations on the mining and processing of construction aggregates impact the industry's operations.
- Despite these challenges, opportunities exist for market participants, particularly those that can innovate and adapt to changing market conditions. For example, the adoption of sustainable and eco-friendly construction practices is gaining momentum, presenting new opportunities for companies to differentiate themselves and meet evolving customer demands.
What will be the Size of the US Construction Aggregates Market during the forecast period?
Get Key Insights on Market Forecast (PDF) Request Free Sample
How is the Construction Aggregates in US Market Segmented and what are the key trends of market segmentation?
The construction aggregates in us industry research report provides comprehensive data (region-wise segment analysis), with forecasts and estimates in "USD billion" for the period 2025-2029, as well as historical data from 2019-2023 for the following segments.
- Product
- Crushed stone
- Sand and gravel
- Type
- Coarse
- Fine
- End-user
- Non-building
- Residential
- Non-residential
- Transportation Mode
- Truck
- Train
- Ship
- Truck
- Train
- Ship
- Geography
- North America
- US
- North America
By Product Insights
The crushed stone segment is estimated to witness significant growth during the forecast period.
The US construction aggregates market, primarily driven by crushed stone production, continues to evolve with ongoing quarry operations and supply chain management. Crushed stone is a crucial component in road construction and maintenance, as well as residential and commercial projects. In 2023, the US produced over half of its crushed stone domestically in leading states like Texas, Pennsylvania, Florida, Missouri, Ohio, North Carolina, Georgia, Indiana, Illinois, and New York. These states accounted for approximately 55% of the country's production, with Texas being the largest producer. The market is subject to regulatory compliance, cost analysis, and environmental impact assessments.
Size reduction methods, such as rock fragmentation and aggregate crushing, employ various techniques like blasting operations, excavation, and equipment maintenance. Production optimization, operational efficiency, and safety protocols are essential for inventory management, material handling systems, and waste rock management. Aggregate testing methods ensure durability, particle size distribution, and gradation control, while water management, noise pollution control, and dust suppression are integral to the industry's sustainability. Pricing strategies and permitting processes are essential for market competitiveness and demand forecasting.
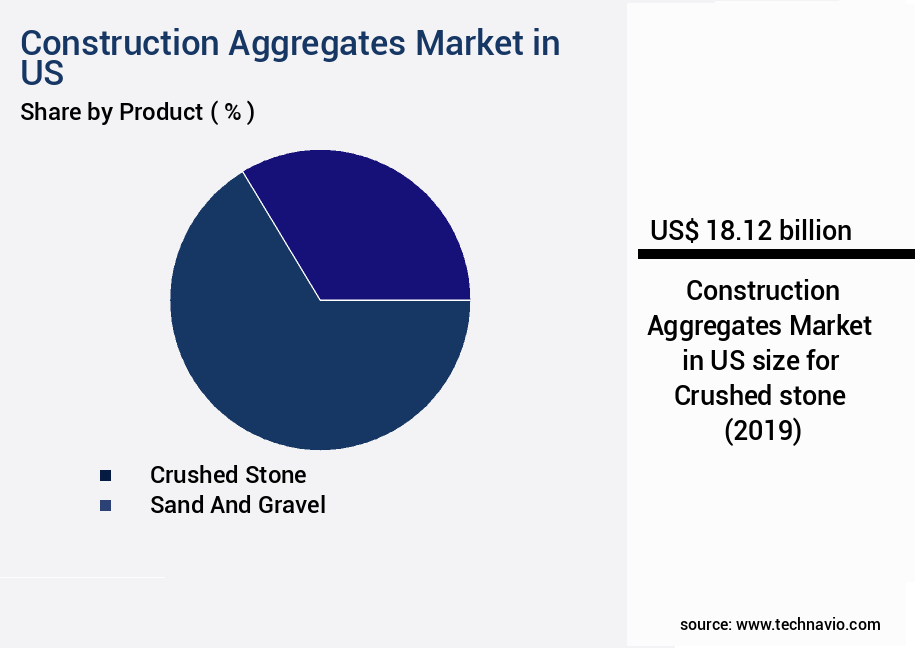
The Crushed stone segment was valued at USD 18.12 billion in 2019 and showed a gradual increase during the forecast period.
Market Dynamics
Our researchers analyzed the data with 2024 as the base year, along with the key drivers, trends, and challenges. A holistic analysis of drivers will help companies refine their marketing strategies to gain a competitive advantage.
The construction aggregates market in the US is a vital sector that significantly contributes to the nation's infrastructure development. Aggregates, including sand, gravel, and crushed stone, play a pivotal role in enhancing the performance of concrete and optimizing asphalt production. The impact of aggregate properties on concrete performance is crucial, with proper gradation ensuring improved durability and strength. In the realm of asphalt production, the optimization of aggregate blending is essential to minimize environmental impact. Sustainable aggregate sourcing and utilization strategies, such as recycling and reusing waste materials, are increasingly adopted to reduce the ecological footprint of aggregate mining.
Digital technologies have revolutionized aggregate processing, enabling real-time monitoring, assessment of aggregate quality using advanced testing methods, and effective inventory management. The role of aggregate size distribution in concrete durability is well-established, with finer aggregates enhancing workability and coarser aggregates contributing to compressive strength. Cost-effective aggregate transportation and logistics solutions are crucial to maintaining operational efficiency in aggregate production processes. Advanced aggregate processing technologies, such as dust suppression systems and automated processing lines, improve quality and reduce emissions. Regulatory compliance and permitting for aggregate mining operations are stringent, necessitating innovative methods for waste rock management in aggregate quarries and enhancing safety protocols for workers in processing plants.
Strategies for reducing water usage in aggregate washing plants are also gaining traction, contributing to environmental sustainability initiatives in aggregate production. Improving operational efficiency in aggregate production processes is a key focus, with more than 70% of players investing in research and development to innovate and stay competitive. The assessment of aggregate quality for different construction applications is critical, with tailored solutions ensuring optimal performance and cost-effectiveness. Effective use of heavy equipment for aggregate extraction and processing is essential to maximizing productivity and minimizing downtime. The industrial application segment accounts for a significantly larger share of the market, driven by the infrastructure sector's insatiable demand for high-quality aggregates.
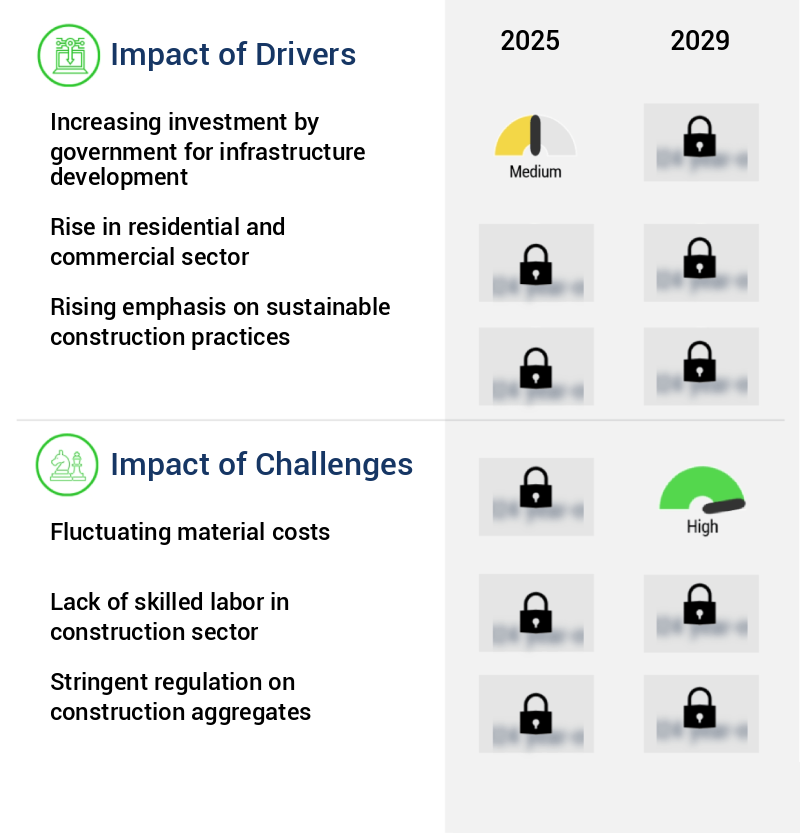
What are the key market drivers leading to the rise in the adoption of Construction Aggregates in US Industry?
- Government investment in infrastructure development is a crucial catalyst for market growth. By increasing funding for infrastructure projects, the government significantly contributes to the economic expansion and creates opportunities for businesses and industries, ultimately driving market progression.
- The US construction aggregates market has witnessed notable expansion due to several driving factors. These include escalating government investments in infrastructure projects, population growth, and urbanization. One sector particularly experiencing growth is transportation. The US administration has allocated substantial funds towards enhancing transportation infrastructure, including highways, bridges, and airports. For instance, in late 2021, the Biden administration announced a USD2 trillion investment plan aimed at upgrading and expanding transportation projects.
- This encompasses improving roads and bridges, expanding public transit, and modernizing airports. This trend underscores the continuous evolution and growing importance of the construction aggregates market in the US infrastructure sector.
What are the market trends shaping the Construction Aggregates in US Industry?
- Construction industry trends indicate a focus on technological advancements in techniques and materials. Technological innovations are shaping the future of construction practices.
- Technological advancements have significantly transformed the US construction aggregates market, leading to enhanced efficiency, sustainability, and cost-effectiveness. Innovations in machinery and equipment have revolutionized aggregate extraction and processing. For example, automated excavators and loaders are now commonly used in quarries for precise extraction, increasing productivity and ensuring safer working conditions. Advanced crushers, screens, and sorters are utilized to process and separate aggregates more effectively, resulting in higher-quality products and reduced waste.
- Furthermore, the integration of technology in construction sites has facilitated real-time monitoring and analysis of aggregate inventory levels, optimizing transportation logistics, and improving overall project management. These advancements contribute to faster construction timelines, reduced environmental impact, and a more sustainable construction industry.
What challenges does the Construction Aggregates in US Industry face during its growth?
- The volatility of material costs poses a significant challenge to the industry's growth trajectory.
- The construction aggregates market in the US is characterized by its sensitivity to material cost fluctuations, which pose significant challenges to industry players. Construction aggregates, encompassing sand, gravel, and crushed stone, are subject to various price determinants, including supply-demand dynamics, transportation costs, and market conditions. One significant factor influencing material costs is the volatility of commodity prices. The prices of raw materials used in the production of construction aggregates, such as fuel, steel, and chemicals, can experience substantial fluctuations due to factors like global supply and demand imbalances, geopolitical events, and economic conditions.
- Consequently, the construction aggregates industry in the US must navigate these price fluctuations to maintain operational efficiency and profitability.
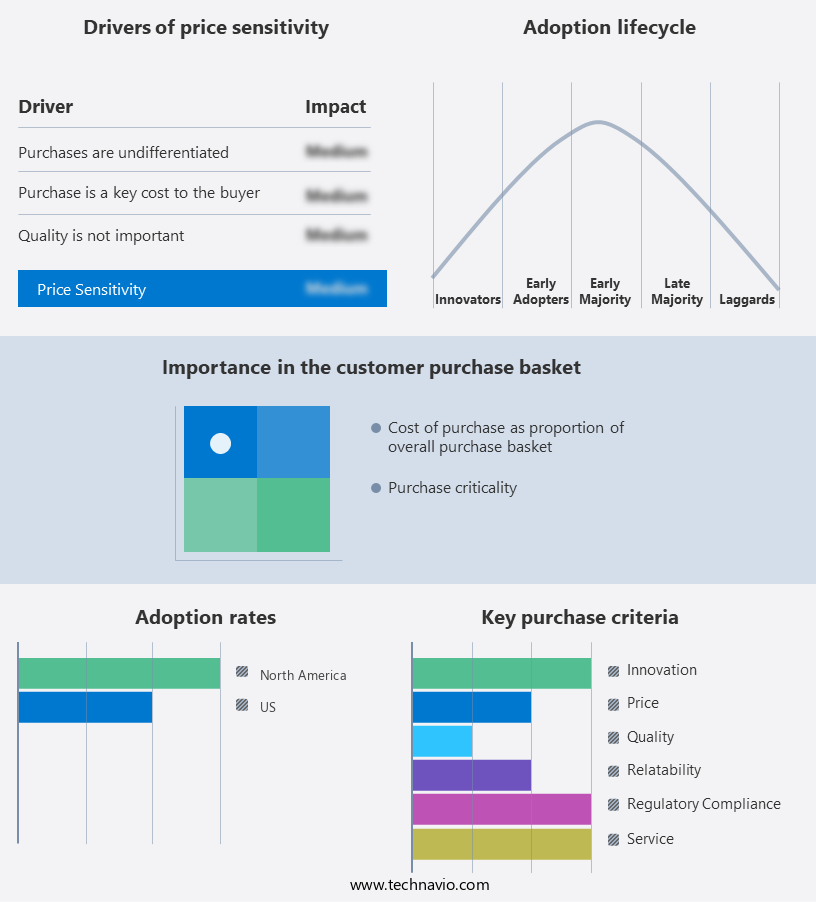
Exclusive Customer Landscape
The us construction aggregates market forecasting report includes the adoption lifecycle of the market, covering from the innovator’s stage to the laggard’s stage. It focuses on adoption rates in different regions based on penetration. Furthermore, the us construction aggregates market report also includes key purchase criteria and drivers of price sensitivity to help companies evaluate and develop their market growth analysis strategies.
Customer Landscape of Construction Aggregates in US Industry
Competitive Landscape & Market Insights
Companies are implementing various strategies, such as strategic alliances, us construction aggregates market forecast, partnerships, mergers and acquisitions, geographical expansion, and product/service launches, to enhance their presence in the industry.
Anglo American plc - This company specializes in the production and distribution of construction materials, including sand, gravel, ready-mixed concrete, and mortar and screeds. Their product offerings cater to various sectors of the construction industry, ensuring project efficiency and quality.
The industry research and growth report includes detailed analyses of the competitive landscape of the market and information about key companies, including:
- Anglo American plc
- Arcosa Inc.
- Boral Ltd.
- Buzzi SpA
- Carmeuse Coordination Center SA
- Cementir Holding NV
- CEMEX SAB de CV
- CRH Plc
- EUROCEMENT Group
- Fisher Sand and Gravel Co.
- HeidelbergCement AG
- Holcim Ltd.
- Irving Materials Inc.
- LSR Group
- Martin Marietta Materials Inc.
- Rogers Group Inc.
- RW Sidley Inc.
- Top Grade Site Management LLC
- Vicat
- Vulcan Materials Co.
Qualitative and quantitative analysis of companies has been conducted to help clients understand the wider business environment as well as the strengths and weaknesses of key industry players. Data is qualitatively analyzed to categorize companies as pure play, category-focused, industry-focused, and diversified; it is quantitatively analyzed to categorize companies as dominant, leading, strong, tentative, and weak.
Recent Development and News in Construction Aggregates Market In US
- In January 2024, Vulcan Materials Company, a leading producer of construction aggregates in the US, announced the acquisition of Cemex's aggregates business in the Pacific Northwest region for approximately USD2.1 billion (Bloomberg). This strategic move expanded Vulcan's presence in the key markets of Oregon, Washington, and California.
- In March 2024, Martin Marietta Materials, another major player in the US construction aggregates market, completed the acquisition of Texas-based Bluegrass Materials for USD1.5 billion (Reuters). This acquisition added to Martin Marietta's footprint in the southern US and increased its market share in the region.
- In April 2025, Lehigh Hanson, a leading global supplier of cement and construction aggregates, launched its new line of sustainable construction aggregates, called Eco-Friendly Aggregates (EFA). These aggregates are produced using recycled materials and reduce the carbon footprint of construction projects (Lehigh Hanson press release).
- In May 2025, the Federal Highway Administration (FHWA) announced a new policy encouraging the use of recycled construction aggregates in federal-aid highway projects. This policy aims to promote sustainability and reduce the environmental impact of the construction industry (FHWA press release).
Dive into Technavio’s robust research methodology, blending expert interviews, extensive data synthesis, and validated models for unparalleled US Construction Aggregates Market insights. See full methodology.
|
Market Scope |
|
|
Report Coverage |
Details |
|
Page number |
170 |
|
Base year |
2024 |
|
Historic period |
2019-2023 |
|
Forecast period |
2025-2029 |
|
Growth momentum & CAGR |
Accelerate at a CAGR of 8.8% |
|
Market growth 2025-2029 |
USD 19.58 billion |
|
Market structure |
Fragmented |
|
YoY growth 2024-2025(%) |
8.3 |
|
Key countries |
US and North America |
|
Competitive landscape |
Leading Companies, Market Positioning of Companies, Competitive Strategies, and Industry Risks |
Research Analyst Overview
- The construction aggregates market in the US is a dynamic and intricate ecosystem, encompassing various aspects from quarry operations to supply chain management. Quarry operations form the foundation of this industry, with companies continuously striving for operational efficiency and productivity. Size reduction methods, such as crushing and rock fragmentation, play a crucial role in producing crushed stone, ensuring the right particle size distribution and gradation control for diverse construction applications. Supply chain management is another critical component, with transportation logistics and inventory management being key areas of focus. Conveyor belt systems and material handling systems streamline the process, while noise pollution control and dust suppression measures mitigate environmental concerns.
- Environmental impact assessments and regulatory compliance are essential for sustainable quarry operations. Aggregate testing methods, including durability testing and compressive strength analysis, ensure the quality of the final product. Cost analysis and production optimization are ongoing priorities to maintain operational efficiency and competitiveness. Regarding pricing strategies, companies employ various tactics to cater to market demands, with factors like demand forecasting, aggregate screening, and permitting processes influencing their decisions. Equipment maintenance and safety protocols are integral to maintaining operational excellence and ensuring a consistent product. The construction aggregates market in the US is characterized by evolving patterns and continuous activity.
- Companies are constantly exploring new methods for excavation techniques, blasting operations, and waste rock management, among others, to enhance their offerings and remain competitive.
What are the Key Data Covered in this US Construction Aggregates Market Research and Growth Report?
-
What is the expected growth of the US Construction Aggregates Market between 2025 and 2029?
-
USD 19.58 billion, at a CAGR of 8.8%
-
-
What segmentation does the market report cover?
-
The report segmented by Product (Crushed stone and Sand and gravel), Type (Coarse and Fine), End-user (Non-building, Residential, and Non-residential), Geography (North America), and Transportation Mode (Truck, Train, Ship, Truck, Train, and Ship)
-
-
Which regions are analyzed in the report?
-
US
-
-
What are the key growth drivers and market challenges?
-
Increasing investment by government for infrastructure development, Fluctuating material costs
-
-
Who are the major players in the Construction Aggregates Market in US?
-
Key Companies Anglo American plc, Arcosa Inc., Boral Ltd., Buzzi SpA, Carmeuse Coordination Center SA, Cementir Holding NV, CEMEX SAB de CV, CRH Plc, EUROCEMENT Group, Fisher Sand and Gravel Co., HeidelbergCement AG, Holcim Ltd., Irving Materials Inc., LSR Group, Martin Marietta Materials Inc., Rogers Group Inc., RW Sidley Inc., Top Grade Site Management LLC, Vicat, and Vulcan Materials Co.
-
Market Research Insights
- The construction aggregates market in the US continues to exhibit significant growth, driven by the increasing demand for infrastructure projects and building construction. According to industry estimates, the market size for concrete aggregates was valued at USD25.5 billion in 2020, representing a notable increase from USD23.8 billion in 2018. Furthermore, the recycling aggregates segment is gaining traction due to environmental stewardship and waste reduction initiatives. Material handling and processing equipment, including crushing plants, washing plants, and screening plants, play a crucial role in the production and supply of aggregates. The adoption of advanced processing technologies, such as automation systems and predictive maintenance, enhances operational efficiency and productivity.
- The integration of data analytics and material specifications ensures the delivery of high-quality aggregates for various applications. Infrastructure projects, particularly road construction, remain the primary consumers of aggregates. The carbon footprint of aggregate production is a concern, and sustainable practices, such as energy efficiency and aggregate blending, are being implemented to mitigate environmental impact. Mining equipment and material handling solutions are essential for the efficient extraction, transportation, and storage of aggregates in aggregate stockpiles. Overall, the construction aggregates market in the US remains dynamic, with ongoing advancements in processing technologies and a focus on sustainable practices.
We can help! Our analysts can customize this us construction aggregates market research report to meet your requirements.
 RIA -
RIA - 
