
Contact Center Market Size 2025-2029
The contact center market size is valued to increase USD 231.6 billion, at a CAGR of 10.9% from 2024 to 2029. Focus on reducing operating costs of businesses will drive the contact center market.
Major Market Trends & Insights
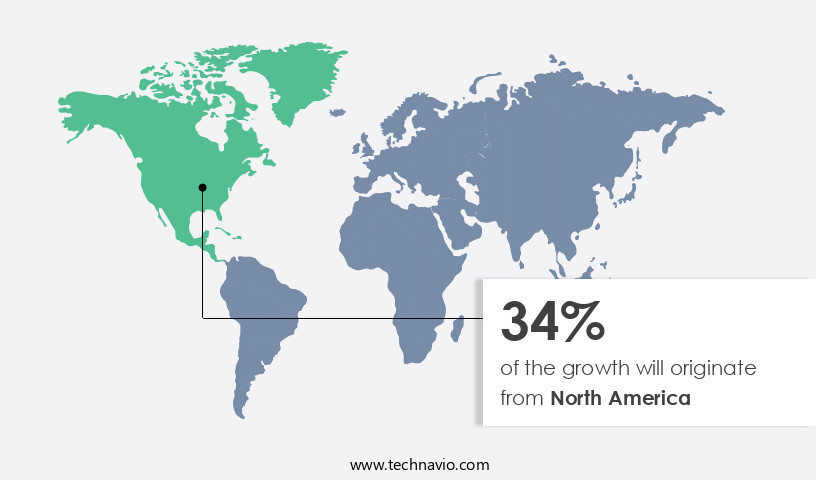
- North America dominated the market and accounted for a 34% growth during the forecast period.
- By Type - Voice-based segment was valued at USD 86.90 billion in 2023
- By Deployment - On-premises segment accounted for the largest market revenue share in 2023
Market Size & Forecast
- Market Opportunities: USD 183.39 billion
- Market Future Opportunities: USD 231.60 billion
- CAGR : 10.9%
- North America: Largest market in 2023
Market Summary
- The market represents a dynamic and ever-evolving landscape, driven by advancements in core technologies and applications. Chatbots, for instance, have gained significant traction, with over 80% of businesses reporting increased efficiency and reduced operating costs as a result of their integration. One such technology gaining traction is chatbots, which enable quicker response times and improved efficiency. However, this trend comes with its challenges. As contact centers become more digitized, they become increasingly vulnerable to cybersecurity threats. Rising cybersecurity threats pose a significant risk, with contact centers becoming increasingly vulnerable to data breaches and customer information theft.
- Regulations, such as the EU's General Data Protection Regulation (GDPR), further complicate matters, requiring stringent compliance measures. Despite these challenges, opportunities abound. The global market for contact center technologies and services is projected to reach USD150 billion by 2025, fueled by the growing demand for enhanced customer experiences and omnichannel support.
What will be the Size of the Contact Center Market during the forecast period?

Get Key Insights on Market Forecast (PDF) Request Free Sample
How is the Contact Center Market Segmented and what are the key trends of market segmentation?
The contact center industry research report provides comprehensive data (region-wise segment analysis), with forecasts and estimates in "USD billion" for the period 2025-2029, as well as historical data from 2019-2023 for the following segments.
- Type
- Voice-based
- Text-based
- Social media-based
- Deployment
- On-premises
- Cloud-based
- Component
- Solutions/Software
- Services
- Organization Size
- Small and medium Enterprises (SMEs)
- Large Enterprises
- End-User
- Banking, Financial Services, and Insurance (BFSI)
- Retail and E-commerce
- Telecommunications
- Healthcare
- Travel and Hospitality
- IT and Telecom
- Government and Public Sector
- Others
- Geography
- North America
- US
- Canada
- Europe
- France
- Germany
- Spain
- UK
- APAC
- Australia
- China
- India
- Japan
- Rest of World (ROW)
- North America
By Type Insights
The voice-based segment is estimated to witness significant growth during the forecast period.
Contact centers continue to evolve, integrating advanced technologies to enhance customer experience and streamline operations. Service level agreements and customer satisfaction scores remain top priorities, driving the adoption of chatbot integration, contact center analytics, and multichannel communication. Automated call distribution and cloud-based contact centers enable real-time monitoring, agent performance metrics, and call routing strategies. Self-service portals, interactive voice response (IVR) systems, and knowledge base systems support first call resolution and reduce the need for human intervention. Computer telephony integration, predictive dialing, and CRM integration further optimize contact center performance. The use of speech analytics tools and customer journey mapping enables a more personalized and effective interaction with customers.
IVR technology, live chat, and social media-based interaction are expected to decrease the reliance on voice-based interaction during the forecast period. IVRs, which use a combination of touch-tone keypads and voice telephone inputs, can access databases to provide suitable responses, reducing throughput time and improving overall efficiency. In 2020, approximately 50% of contact centers employed IVRs, and this number is projected to reach 60% by 2025. Additionally, the market for call center software is projected to grow, with an estimated 35% of contact centers expected to adopt cloud-based solutions by 2025. This trend is driven by the need for flexibility, scalability, and cost savings.
Furthermore, agent training programs and real-time monitoring dashboards are increasingly important, with an estimated 75% of contact centers investing in these solutions by 2025. These trends reflect the ongoing evolution of the market, as it adapts to changing customer expectations and technological advancements. The market's dynamics continue to unfold, with new innovations and applications emerging across various sectors.

The Voice-based segment was valued at USD 86.90 billion in 2019 and showed a gradual increase during the forecast period.

Regional Analysis
North America is estimated to contribute 34% to the growth of the global market during the forecast period.Technavio's analysts have elaborately explained the regional trends and drivers that shape the market during the forecast period.
See How Contact Center Market Demand is Rising in North America Request Free Sample
The market in North America experiences significant growth due to the increasing adoption of advanced analytics solutions. Multichannel customer interaction analytics, speech analytics, and contact center performance analytics are increasingly being utilized by enterprises to improve customer experiences as they transition to omnichannel customer care. Key companies in the region, such as Avaya Holding Corp., expand their offerings by globalizing their cloud-based contact center solutions, like Avaya OneCloudTM CCaaS, to cater to the evolving market demands.
The integration of technology and digitalization in contact center services is a constant priority for these companies, ensuring they remain competitive and meet the needs of their clients.
Market Dynamics
Our researchers analyzed the data with 2024 as the base year, along with the key drivers, trends, and challenges. A holistic analysis of drivers will help companies refine their marketing strategies to gain a competitive advantage.
The market is a dynamic and evolving landscape, driven by the increasing need to improve agent performance metrics and enhance customer experience through technology. Contact centers are shifting their focus towards implementing omnichannel routing strategies, measuring customer satisfaction scores, and optimizing call center efficiency. This is achieved by analyzing customer interaction data, integrating CRM and contact center systems, designing effective self-service portals, and leveraging speech analytics for insights. Moreover, the adoption of cloud-based contact center solutions is on the rise, enabling organizations to deploy flexible and scalable systems. The market is witnessing significant advancements in workforce management, with real-time monitoring and predictive analytics being used to optimize average handle time and reduce abandoned call rates.
Enhancing customer experience is a key priority, leading to the integration of AI and machine learning technologies. One notable trend is the increasing importance of maintaining contact center security, as organizations handle sensitive customer data. Additionally, the market is witnessing a shift towards building robust knowledge base systems to improve first call resolution rates and ensure service level agreements are maintained. Compared to traditional contact center solutions, cloud-based systems are gaining popularity due to their flexibility and cost-effectiveness. In fact, more than 60% of organizations are reported to have already adopted or are planning to adopt cloud-based contact center solutions, representing a significant shift in the market.
This trend is expected to continue, with cloud-based solutions accounting for a larger share of the market in the coming years.

What are the key market drivers leading to the rise in the adoption of Contact Center Industry?
- Focusing on reducing operating costs is a crucial priority for businesses and serves as the primary market driver.
- Organizations aim to minimize business expenses, leading them to outsource customer management and support services to contact center agencies. In-house contact centers necessitate substantial investments in infrastructure, workforce management, and employee training, potentially adding 50%-70% to operational costs. Outsourcing call center operations offers several advantages to international and regional companies. First, they avoid the need for infrastructure investments as contact center companies assume responsibility for managing the outsourced work and infrastructure. Additionally, outsourcing enables companies to access a skilled workforce, ensuring efficient and effective customer service.
- Furthermore, outsourcing allows businesses to focus on their core competencies, enhancing overall productivity and profitability. By offloading the burden of contact center management, organizations can allocate resources to strategic initiatives and improve their bottom line.
What are the market trends shaping the Contact Center Industry?
- The integration of chatbots into businesses is becoming a mandated market trend for improved turnaround times. This innovative approach enhances business efficiency and customer service.
- Contact centers are essential business units that handle customer queries and provide resolutions, playing a significant role in shaping customer experiences and brand loyalty. However, the traditional approach of relying solely on human agents for handling customer inquiries comes with challenges. The increasing volume of queries and the need for instant responses have led contact centers to explore automation through chatbots. Chatbots, powered by artificial intelligence and natural language processing, can handle simple queries effectively, enabling human agents to focus on more complex issues. According to various studies, chatbot adoption in customer service is on the rise, with over 69% of businesses using or planning to use chatbots by 2022.
- This trend is driven by the benefits chatbots offer, such as 24/7 availability, quick response times, and cost savings. Moreover, chatbots can be integrated with various messaging platforms and social media channels, making them accessible to customers through their preferred channels. This flexibility and convenience can lead to improved customer satisfaction and engagement. The continuous advancements in AI and machine learning technologies further enhance chatbots' capabilities, allowing them to understand and respond to customer queries more accurately and effectively. In conclusion, the adoption of chatbots in contact centers is a growing trend that offers numerous benefits, including quick response times, cost savings, and improved customer satisfaction.
- The use of AI and machine learning technologies enables chatbots to handle simple queries effectively and continuously learn and adapt to customer needs. This evolution in customer service technology is a testament to the industry's commitment to providing efficient, convenient, and personalized solutions for customers.
What challenges does the Contact Center Industry face during its growth?
- The contact center industry faces significant growth challenges due to the escalating cybersecurity risks, which necessitates continuous investment in advanced security measures to safeguard sensitive customer information.
- Contact centers play a crucial role in businesses by handling customer interactions, yet they pose significant security risks. Agents may struggle to maintain organizational standards for quality, and contact centers cannot provide advanced fraud detection services for financial institutions. Furthermore, personal customer information, including names, email addresses, contact numbers, and ages, is vulnerable when shared with agents. The market faces escalating cyber threats as it stores data from numerous clients.
- Hackers can exploit this information to bypass knowledge-based verification systems, gaining unauthorized access. It is essential to prioritize robust security measures, such as encryption, multi-factor authentication, and access control policies, to mitigate these risks and safeguard sensitive data.
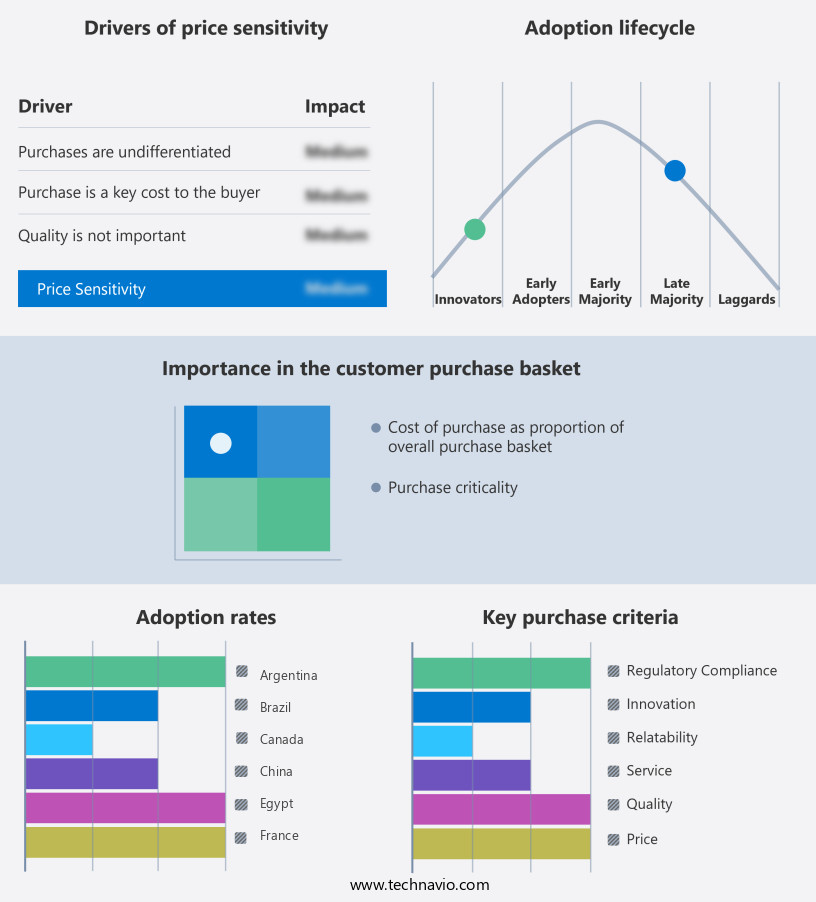
Exclusive Technavio Analysis on Customer Landscape
The contact center market forecasting report includes the adoption lifecycle of the market, covering from the innovator's stage to the laggard's stage. It focuses on adoption rates in different regions based on penetration. Furthermore, the contact center market report also includes key purchase criteria and drivers of price sensitivity to help companies evaluate and develop their market growth analysis strategies.
Customer Landscape of Contact Center Industry
Competitive Landscape
Companies are implementing various strategies, such as strategic alliances, contact center market forecast, partnerships, mergers and acquisitions, geographical expansion, and product/service launches, to enhance their presence in the industry.
8x8 Inc. - This company specializes in contact center solutions, providing Inbound, Outbound, Digital, and Integrations services to enhance customer engagement and streamline communication processes. Their offerings facilitate effective customer interactions through advanced technology and strategic partnerships.
The industry research and growth report includes detailed analyses of the competitive landscape of the market and information about key companies, including:
- 8x8 Inc.
- ALE International
- Alphabet Inc.
- Alvaria Inc.
- Amazon.com Inc.
- Ameyo Pvt Ltd.
- Atos SE
- Avaya LLC
- Cisco Systems Inc.
- Enghouse Systems Ltd.
- Five9 Inc.
- Genesys Telecommunications Laboratories Inc.
- Mitel Networks Corp.
- NEC Corp.
- NICE Ltd.
- SAP SE
- Vocalcom Group
- Vonage Holdings Corp.
- Zendesk Inc.
- ZTE Corp.
Qualitative and quantitative analysis of companies has been conducted to help clients understand the wider business environment as well as the strengths and weaknesses of key industry players. Data is qualitatively analyzed to categorize companies as pure play, category-focused, industry-focused, and diversified; it is quantitatively analyzed to categorize companies as dominant, leading, strong, tentative, and weak.
Recent Development and News in Contact Center Market
- In January 2024, global tech giant Microsoft announced the acquisition of Metaswitch Networks, a leading provider of cloud-native communications software for service providers and enterprises, to strengthen its position in the market. The deal, valued at approximately USD1.8 billion, was aimed at enhancing Microsoft's Teams platform with advanced communications capabilities (Microsoft Press Release, 2024).
- In March 2024, Amazon Web Services (AWS) introduced Amazon Connect Wisdom, an AI-powered contact center service that uses machine learning to help agents resolve customer queries more efficiently. This service was designed to analyze past interactions and provide real-time recommendations to agents, improving customer satisfaction and agent productivity (AWS Blog, 2024).
- In April 2025, IBM and Genesys, a leading provider of omnichannel customer experience and contact center solutions, announced a strategic partnership to integrate IBM Watson Assistant with Genesys' PureCloud platform. This collaboration aimed to provide businesses with advanced AI-driven customer service capabilities, enabling them to offer more personalized and efficient support to their customers (Genesys Press Release, 2025).
- In May 2025, Twilio, a cloud communications platform, announced the acquisition of Zipwhip, a messaging platform for businesses. The acquisition, valued at approximately USD850 million, was aimed at expanding Twilio's communication capabilities and strengthening its presence in the business messaging market, particularly in the contact center sector (Twilio Press Release, 2025).
Dive into Technavio's robust research methodology, blending expert interviews, extensive data synthesis, and validated models for unparalleled Contact Center Market insights. See full methodology.
|
Market Scope |
|
|
Report Coverage |
Details |
|
Page number |
200 |
|
Base year |
2024 |
|
Historic period |
2019-2023 |
|
Forecast period |
2025-2029 |
|
Growth momentum & CAGR |
Accelerate at a CAGR of 10.9% |
|
Market growth 2025-2029 |
USD 231.6 billion |
|
Market structure |
Fragmented |
|
YoY growth 2024-2025(%) |
9.5 |
|
Key countries |
US, India, Australia, UK, Canada, Japan, Germany, France, China, and Spain |
|
Competitive landscape |
Leading Companies, Market Positioning of Companies, Competitive Strategies, and Industry Risks |
Research Analyst Overview
- The market continues to evolve, with a focus on enhancing customer engagement and satisfaction through advanced technologies. Service Level Agreements (SLAs) are a critical aspect of this evolution, ensuring efficient and effective communication between businesses and their customers. One significant trend is the integration of chatbots, which can handle routine inquiries and free up agents for more complex issues. Contact center analytics plays a pivotal role in this transformation, providing insights into customer behavior and preferences. Multichannel communication is essential, with businesses adopting cloud-based contact centers to support various channels, including voice, email, chat, and social media. Automated call distribution and Interactive Voice Response (IVR) systems streamline call handling, while abandoned call rates are monitored to minimize customer frustration.
- Call center software is evolving to include advanced features like real-time monitoring dashboards, agent performance metrics, and call routing strategies. Self-service portals and ACD routing enable customers to resolve issues independently, while skill-based routing ensures that agents are best equipped to handle specific queries. Knowledge base systems and average handle time are essential metrics for optimizing agent productivity. Omnichannel routing and agent occupancy rate are becoming increasingly important as businesses strive to provide seamless customer experiences. Customer journey analytics and first call resolution are key performance indicators, with predictive dialing and quality monitoring systems helping to improve agent performance.
- CRM integration and speech analytics tools offer valuable insights into customer interactions, enhancing overall customer experience management.
What are the Key Data Covered in this Contact Center Market Research and Growth Report?
-
What is the expected growth of the Contact Center Market between 2025 and 2029?
-
USD 231.6 billion, at a CAGR of 10.9%
-
-
What segmentation does the market report cover?
-
The report is segmented by Type (Voice-based, Text-based, and Social media-based), Deployment (On-premises and Cloud-based), Geography (North America, APAC, Europe, South America, and Middle East and Africa), Component (Solutions/Software, Services, Solutions/Software, and Services), Organization Size (Small and medium Enterprises (SMEs), Large Enterprises), and End-User (Banking, Financial Services, and Insurance (BFSI), Retail and E-commerce, Telecommunications, Healthcare, Travel and Hospitality, IT and Telecom, Government and Public Sector, Others)
-
-
Which regions are analyzed in the report?
-
North America, APAC, Europe, South America, and Middle East and Africa
-
-
What are the key growth drivers and market challenges?
-
Focus on reducing operating costs of businesses, Rising cybersecurity threats associated with contact centers
-
-
Who are the major players in the Contact Center Market?
-
8x8 Inc., ALE International, Alphabet Inc., Alvaria Inc., Amazon.com Inc., Ameyo Pvt Ltd., Atos SE, Avaya LLC, Cisco Systems Inc., Enghouse Systems Ltd., Five9 Inc., Genesys Telecommunications Laboratories Inc., Mitel Networks Corp., NEC Corp., NICE Ltd., SAP SE, Vocalcom Group, Vonage Holdings Corp., Zendesk Inc., and ZTE Corp.
-
Market Research Insights
- The market encompasses a range of customer support platforms and technologies that enable businesses to manage and optimize customer engagement strategies. According to industry estimates, the global contact center workforce is projected to reach over 10 million agents by 2025, underscoring the market's significant size and growth potential. This expanding workforce requires advanced infrastructure to facilitate effective customer interaction management, including call center technology, performance monitoring tools, and communication platforms. Moreover, the increasing emphasis on customer experience design necessitates the integration of contact center automation, customer journey optimization, and omnichannel support. In fact, approximately 73% of businesses report that they have already implemented or plan to implement an omnichannel customer service strategy.
- Furthermore, contact center reporting and compliance tools ensure adherence to industry regulations and maintain high levels of customer trust. With the integration of customer feedback mechanisms, agent scheduling tools, and real-time data analytics, businesses can continuously improve customer relationship management and agent productivity.
We can help! Our analysts can customize this contact center market research report to meet your requirements.