Convenience Stores Market Size 2026-2030
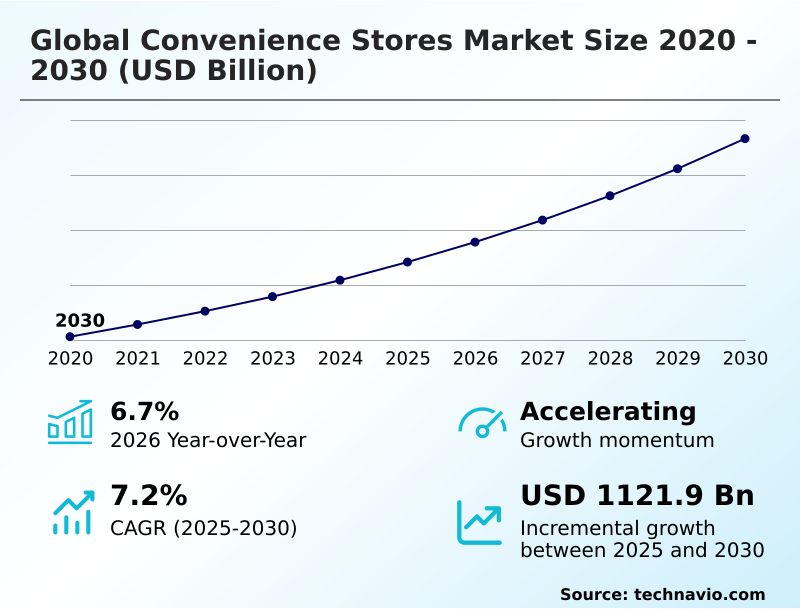
The convenience stores market size is valued to increase by USD 1121.9 billion, at a CAGR of 7.2% from 2025 to 2030. Growing demand for convenient food products will drive the convenience stores market.
Major Market Trends & Insights
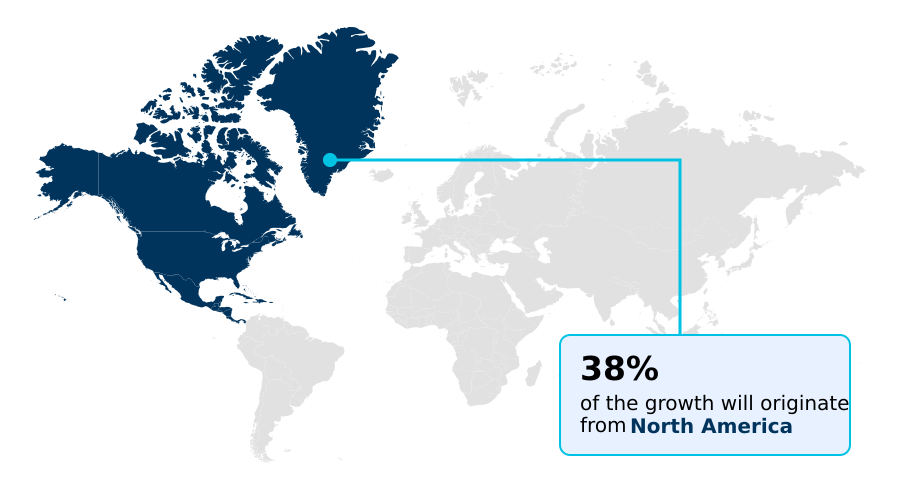
- North America dominated the market and accounted for a 37.9% growth during the forecast period.
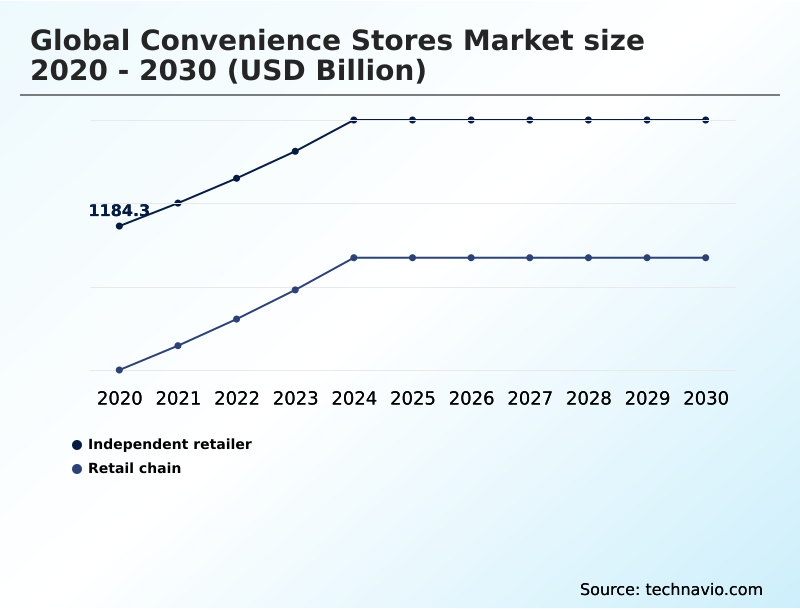
- By Ownership - Independent retailer segment was valued at USD 1433.8 billion in 2024
- By Type - Traditional convenience store segment accounted for the largest market revenue share in 2024
Market Size & Forecast
- Market Opportunities: USD 1800.5 billion
- Market Future Opportunities: USD 1121.9 billion
- CAGR from 2025 to 2030 : 7.2%
Market Summary
- The convenience stores market is undergoing a significant transformation, evolving from simple retail outlets into sophisticated, technology-driven hubs. This evolution is powered by the integration of advanced systems that enhance operational efficiency and customer experience. For instance, AI-driven inventory management and predictive demand forecasting are becoming standard for optimizing stock levels, particularly for fresh foodservice offerings.
- The push for a seamless customer journey is driving the adoption of automated checkout systems and frictionless checkout systems, minimizing wait times and improving satisfaction. In a competitive landscape, a successful omnichannel retail strategy is crucial, blending physical stores with robust e-commerce platform integration and mobile ordering platforms.
- A retailer might leverage in-store traffic analysis to refine store layouts and product placements, using insights to tailor promotions delivered through digital loyalty programs. This data-centric approach, covering everything from supply chain optimization to customer engagement, is redefining the value proposition of the modern convenience store, positioning it as an indispensable part of the daily consumer ecosystem.
What will be the Size of the Convenience Stores Market during the forecast period?
Get Key Insights on Market Forecast (PDF) Get Free Sample
How is the Convenience Stores Market Segmented?
The convenience stores industry research report provides comprehensive data (region-wise segment analysis), with forecasts and estimates in "USD billion" for the period 2026-2030, as well as historical data from 2020-2024 for the following segments.
- Ownership
- Independent retailer
- Retail chain
- Type
- Traditional convenience store
- Mini convenience store
- Hyper convenience store
- Expanded convenience store
- Others
- Product type
- Food and beverages
- Tobacco products
- Health and beauty products
- Home and office supplies
- Others
- Geography
- North America
- US
- Canada
- Mexico
- APAC
- China
- Japan
- India
- Europe
- Germany
- UK
- France
- Middle East and Africa
- Saudi Arabia
- UAE
- South Africa
- South America
- Brazil
- Argentina
- Rest of World (ROW)
- North America
By Ownership Insights
The independent retailer segment is estimated to witness significant growth during the forecast period.
The independent retailer segment remains a cornerstone of community-centric commerce, defined by agility and localized customer relationship management.
These operators are increasingly adopting digital payment systems to improve service speed, with some achieving a 15% reduction in transaction times during peak hours. While facing procurement challenges, many are exploring simplified supply chain optimization through shared logistics networks.
To compete with larger chains, a focus on differentiated c-store foodservice models and robust food safety compliance is critical.
The integration of workforce management software and end-to-end retail platforms is becoming essential for managing real-time stock management and streamlining operations, allowing these businesses to maintain their unique neighborhood appeal while enhancing efficiency.
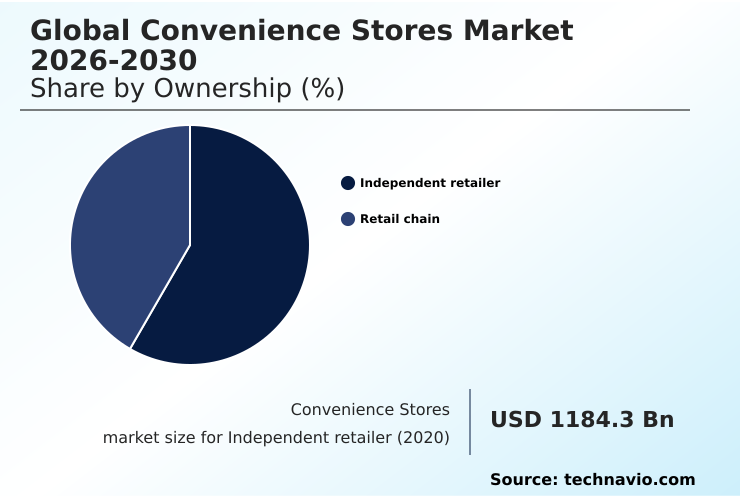
The Independent retailer segment was valued at USD 1433.8 billion in 2024 and showed a gradual increase during the forecast period.
Regional Analysis
North America is estimated to contribute 37.9% to the growth of the global market during the forecast period.Technavio’s analysts have elaborately explained the regional trends and drivers that shape the market during the forecast period.
See How Convenience Stores Market Demand is Rising in North America Get Free Sample
The market's geographic landscape is characterized by varied regional dynamics and growth trajectories. North America, contributing to nearly 38% of the market's incremental growth, leads due to its mature retail infrastructure and high adoption of convenience retail technology.
This region shows significant investment in forecourt retail solutions and EV charging infrastructure to cater to evolving mobility trends.
In contrast, APAC is the fastest-growing region, with countries like China and Japan pioneering the deployment of unmanned retail stores and advanced mobile wallet integration. European markets are focusing on sustainable retail operations and enhancing c-store foodservice models.
The successful deployment of an end-to-end retail platform has been shown to improve supply chain efficiency by 15% across diverse geographies. These regional distinctions highlight the importance of localized strategies in a globally expanding market.
Market Dynamics
Our researchers analyzed the data with 2025 as the base year, along with the key drivers, trends, and challenges. A holistic analysis of drivers will help companies refine their marketing strategies to gain a competitive advantage.
- The strategic evolution of the convenience stores market is increasingly centered on sophisticated operational and customer-facing initiatives. The role of private-label goods in convenience store strategy has shifted from a low-cost alternative to a key differentiator for brand loyalty and margin enhancement.
- To support this, operators must excel at optimizing fresh food inventory in c-stores, a task where precision is paramount to profitability and waste reduction. Success in this area often hinges on implementing frictionless checkout in small format retail, which improves the customer experience and provides valuable data on purchasing habits.
- As mobility patterns change, understanding the impact of EV charging on convenience store profits becomes a critical component of future-proofing store locations and diversifying revenue streams. For instance, retailers that have integrated charging stations have seen non-fuel in-store sales increase by more than 10% during charging periods.
- Underpinning these shifts is the need for advanced analytics, particularly using AI for demand forecasting in convenience retail, which allows for more accurate stock management. Furthermore, the challenge of integrating hyperlocal delivery with existing POS systems must be overcome to compete with online players and enhance customer convenience.
What are the key market drivers leading to the rise in the adoption of Convenience Stores Industry?
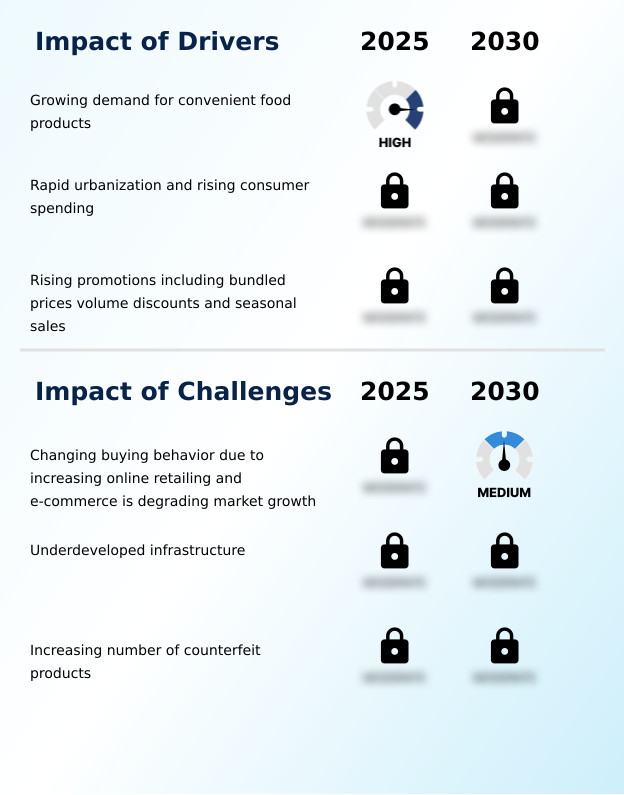
- The rising demand for convenient food products, fueled by fast-paced modern lifestyles and urbanization, stands as a primary driver propelling market growth.
- Market growth is fundamentally driven by consumer demand for speed and accessibility, which retailers are meeting through enhanced foodservice offerings and technological integration.
- The on-the-go consumption trend continues to fuel demand for fresh food and beverages, making an efficient fresh food supply chain a critical operational component.
- The integration of mobile ordering platforms has been directly linked to a 15% increase in average order value as consumers add more items. Moreover, the adoption of self-checkout technologies and advanced cloud-based POS systems streamlines the transaction process.
- On the back end, retailers utilizing predictive demand forecasting have successfully reduced food spoilage by up to 25%, improving both profitability and sustainability. These drivers collectively redefine the convenience store as a primary destination for immediate needs.
What are the market trends shaping the Convenience Stores Industry?
- The growing consumer demand for private-label brands is a key market trend, driven by the pursuit of value and retailers' strategies to enhance profit margins and customer loyalty.
- Key market trends are centered on enhancing customer experience and operational agility through technology. The adoption of a comprehensive omnichannel retail strategy, which integrates physical and digital channels, is paramount. Retailers employing this approach have seen customer retention rates improve by over 20% compared to their single-channel counterparts.
- This is complemented by the rise of private-label brands, which offer higher margins and foster loyalty. In-store, the implementation of scan-and-go pay system and other retail automation systems is accelerating, with some stores reducing average checkout times by as much as 60% during peak hours.
- Furthermore, personalized marketing engines and digital loyalty programs are leveraging data from shopper analytics platforms to deliver targeted offers, driving repeat business in an increasingly competitive landscape.
What challenges does the Convenience Stores Industry face during its growth?
- A primary challenge impacting market growth is the significant shift in consumer purchasing habits toward online retailing and e-commerce platforms.
- The primary challenge facing the market is heightened competition from digital-native players specializing in quick commerce and hyperlocal delivery. These services have intensified pressure on traditional retailers, capturing up to 15% of impulse-purchase occasions in some dense urban markets. To counteract this, brick-and-mortar stores are investing heavily in technologies that replicate a seamless experience, such as frictionless checkout systems.
- Success depends on sophisticated in-store traffic analysis and data-driven inventory management to ensure product availability. Furthermore, rising operational costs necessitate the use of supply chain efficiency tools and smart refrigeration systems. The focus on last-mile delivery optimization is also crucial for stores looking to compete directly with online platforms by offering their own rapid delivery services.
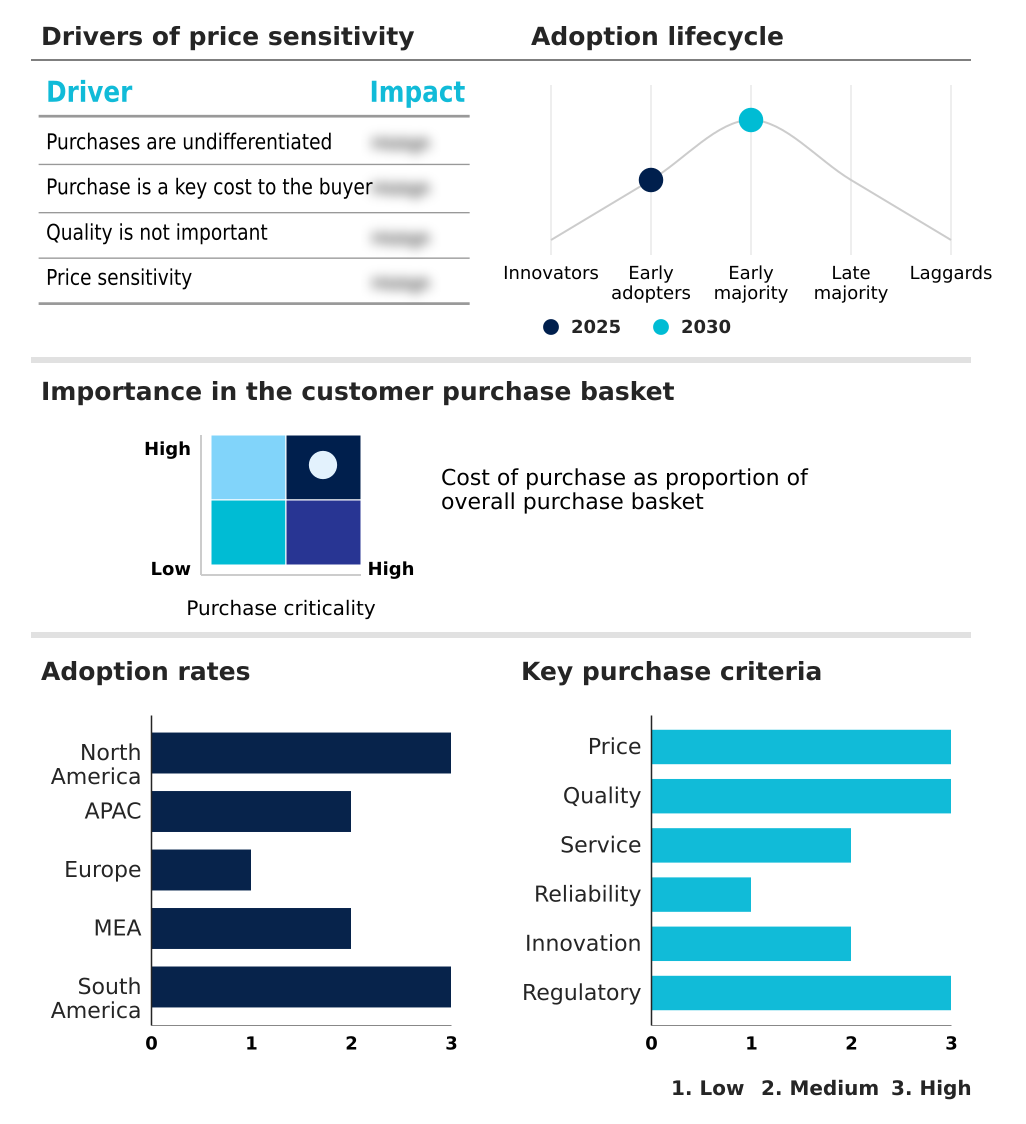
Exclusive Technavio Analysis on Customer Landscape
The convenience stores market forecasting report includes the adoption lifecycle of the market, covering from the innovator’s stage to the laggard’s stage. It focuses on adoption rates in different regions based on penetration. Furthermore, the convenience stores market report also includes key purchase criteria and drivers of price sensitivity to help companies evaluate and develop their market growth analysis strategies.
Customer Landscape of Convenience Stores Industry
Competitive Landscape
Companies are implementing various strategies, such as strategic alliances, convenience stores market forecast, partnerships, mergers and acquisitions, geographical expansion, and product/service launches, to enhance their presence in the industry.
Alimentation Couche Tard Inc. - The company offers convenience stores with food services and fuel retailing.
The industry research and growth report includes detailed analyses of the competitive landscape of the market and information about key companies, including:
- Alimentation Couche Tard Inc.
- Amazon.com Inc.
- BP Plc
- Caseys General Stores Inc.
- Coop Group
- CP ALL PCL
- EG Group Ltd
- GPM Investments LLC
- GS Retail Co Ltd
- ITOCHU Corp.
- Krause Group
- Kwik Trip
- Lulu Group International
- Maverik Inc
- Mitsubishi Corp.
- Parkland Fuel Corp.
- PT Sumber Alfaria Trijaya Tbk
- QuikTrip Corp
- Shell plc
- Walmart Inc.
Qualitative and quantitative analysis of companies has been conducted to help clients understand the wider business environment as well as the strengths and weaknesses of key industry players. Data is qualitatively analyzed to categorize companies as pure play, category-focused, industry-focused, and diversified; it is quantitatively analyzed to categorize companies as dominant, leading, strong, tentative, and weak.
Recent Development and News in Convenience stores market
- In August, 2024, Alimentation Couche-Tard Inc. announced a strategic partnership with a leading technology firm to deploy AI-driven inventory management systems across 1,000 of its Circle K stores, aiming to reduce stockouts and food waste.
- In November, 2024, Casey's General Stores Inc. completed its acquisition of a 63-store chain in the Midwestern United States, expanding its market presence and integrating the new locations into its distribution network.
- In February, 2025, Shell plc launched a new initiative to install over 500 ultra-fast electric vehicle charging stations at its retail locations across Europe, coupled with an upgraded convenience store experience featuring enhanced food and beverage options.
- In May, 2025, 7-Eleven Inc. rolled out a new mobile application feature allowing for frictionless, scan-and-go payments in an additional 2,000 stores, significantly reducing checkout times for customers.
Dive into Technavio’s robust research methodology, blending expert interviews, extensive data synthesis, and validated models for unparalleled Convenience Stores Market insights. See full methodology.
| Market Scope | |
|---|---|
| Page number | 306 |
| Base year | 2025 |
| Historic period | 2020-2024 |
| Forecast period | 2026-2030 |
| Growth momentum & CAGR | Accelerate at a CAGR of 7.2% |
| Market growth 2026-2030 | USD 1121.9 billion |
| Market structure | Fragmented |
| YoY growth 2025-2026(%) | 6.7% |
| Key countries | US, Canada, Mexico, China, Japan, India, South Korea, Australia, Indonesia, Germany, UK, France, Italy, Spain, The Netherlands, Saudi Arabia, UAE, South Africa, Israel, Turkey, Brazil, Argentina and Chile |
| Competitive landscape | Leading Companies, Market Positioning of Companies, Competitive Strategies, and Industry Risks |
Research Analyst Overview
- The convenience stores market is navigating a period of intense transformation, moving beyond traditional retail to become multifaceted service hubs. This pivot is evident in the emphasis on foodservice offerings and in-store kitchens, which now act as primary revenue drivers.
- Supporting this shift requires a robust technological backbone, encompassing everything from AI-driven inventory management and cloud-based POS systems to full e-commerce platform integration. The deployment of automated checkout systems is critical, with early adopters reporting a reduction in average transaction times by over 40% in high-traffic urban locations.
- Strategic capital allocation is also being redirected towards new opportunities like EV charging infrastructure, a boardroom-level decision reflecting long-term shifts in consumer behavior. Simultaneously, operators are implementing frictionless checkout systems, scan-and-go pay system technology, and sophisticated digital loyalty programs to foster customer retention.
- The entire operation, from last-mile delivery optimization to ensuring food safety compliance, relies on data-driven decision-making and continuous supply chain optimization to remain competitive.
What are the Key Data Covered in this Convenience Stores Market Research and Growth Report?
-
What is the expected growth of the Convenience Stores Market between 2026 and 2030?
-
USD 1121.9 billion, at a CAGR of 7.2%
-
-
What segmentation does the market report cover?
-
The report is segmented by Ownership (Independent retailer, and Retail chain), Type (Traditional convenience store, Mini convenience store, Hyper convenience store, Expanded convenience store, and Others), Product Type (Food and beverages, Tobacco products, Health and beauty products, Home and office supplies, and Others) and Geography (North America, APAC, Europe, Middle East and Africa, South America)
-
-
Which regions are analyzed in the report?
-
North America, APAC, Europe, Middle East and Africa and South America
-
-
What are the key growth drivers and market challenges?
-
Growing demand for convenient food products, Changing buying behavior due to increasing online retailing and e-commerce is degrading market growth
-
-
Who are the major players in the Convenience Stores Market?
-
Alimentation Couche Tard Inc., Amazon.com Inc., BP Plc, Caseys General Stores Inc., Coop Group, CP ALL PCL, EG Group Ltd, GPM Investments LLC, GS Retail Co Ltd, ITOCHU Corp., Krause Group, Kwik Trip, Lulu Group International, Maverik Inc, Mitsubishi Corp., Parkland Fuel Corp., PT Sumber Alfaria Trijaya Tbk, QuikTrip Corp, Shell plc and Walmart Inc.
-
Market Research Insights
- Market dynamics are increasingly shaped by technological adoption and strategic diversification. Retailers leveraging shopper analytics platforms report up to a 20% increase in the effectiveness of targeted promotions compared to traditional methods. The implementation of cohesive convenience retail technology, including advanced retail automation systems, is critical for operational efficiency.
- Furthermore, businesses that have integrated comprehensive energy management systems have achieved an average operational cost reduction of 12% in energy expenditures. As urban retail logistics become more complex, a sophisticated omnichannel retail strategy is no longer optional but essential for survival.
- The focus is shifting towards creating seamless customer experience platforms that unify online and in-store interactions, driving both loyalty and higher transaction values in a competitive environment.
We can help! Our analysts can customize this convenience stores market research report to meet your requirements.
 RIA -
RIA - 
