
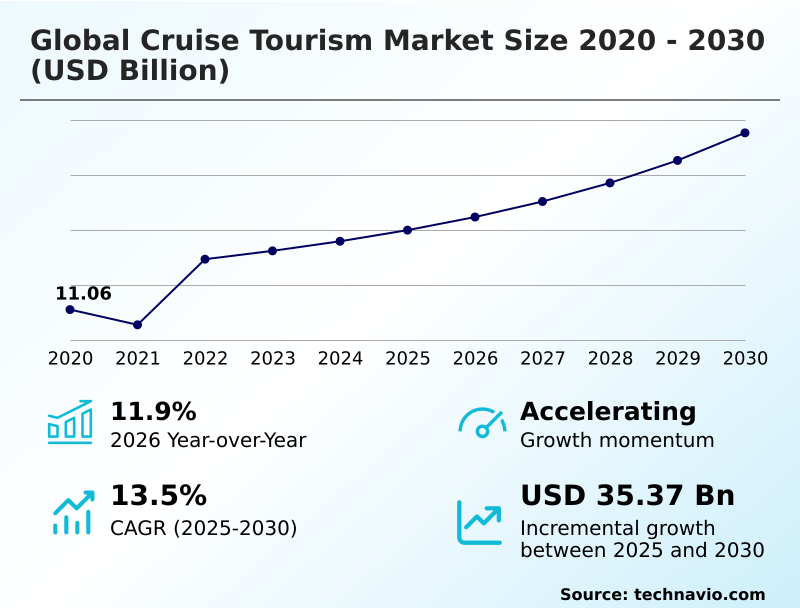
Cruise Tourism Market Size 2026-2030
The cruise tourism market size is valued to increase by USD 35.37 billion, at a CAGR of 13.5% from 2025 to 2030. Strategic expansion of fleet capacity and proliferation of next-generation megaships will drive the cruise tourism market.
Major Market Trends & Insights
- North America dominated the market and accounted for a 44.2% growth during the forecast period.
- By Product - Passenger tickets segment was valued at USD 21.94 billion in 2024
- By Application - Ocean cruising segment accounted for the largest market revenue share in 2024
Market Size & Forecast
- Market Opportunities: USD 64.27 billion
- Market Future Opportunities: USD 35.37 billion
- CAGR from 2025 to 2030 : 13.5%
Market Summary
- The cruise tourism market is undergoing a significant transformation driven by a dual focus on capacity expansion and operational sustainability. Operators are introducing technologically advanced megaships to meet escalating consumer demand for floating resort experiences, while simultaneously investing heavily in liquefied natural gas propulsion and other green technologies to align with stringent international environmental regulations.
- This evolution is complemented by a diversification of the passenger base, as the industry successfully attracts younger demographics with unique experiential luxury and expedition cruising options. As an example of operational adaptation, a cruise line facing potential port closures due to regional instability can leverage AI-driven logistical platforms to reroute vessels in real-time.
- This system dynamically recalculates fuel consumption, provisions, and passenger transit to an alternative port, preserving the vacation experience while mitigating financial losses from canceled itineraries. The integration of advanced data analytics for hyper-personalization, from bespoke dining recommendations to curated shore excursions, is further enhancing guest satisfaction.
- This focus on delivering high-value, personalized, and adventurous experiences, balanced with a commitment to environmental stewardship, defines the competitive landscape of the cruise tourism market.
What will be the Size of the Cruise Tourism Market during the forecast period?
Get Key Insights on Market Forecast (PDF) Get Free Sample
How is the Cruise Tourism Market Segmented?
The cruise tourism industry research report provides comprehensive data (region-wise segment analysis), with forecasts and estimates in "USD million" for the period 2026-2030, as well as historical data from 2020-2024 for the following segments.
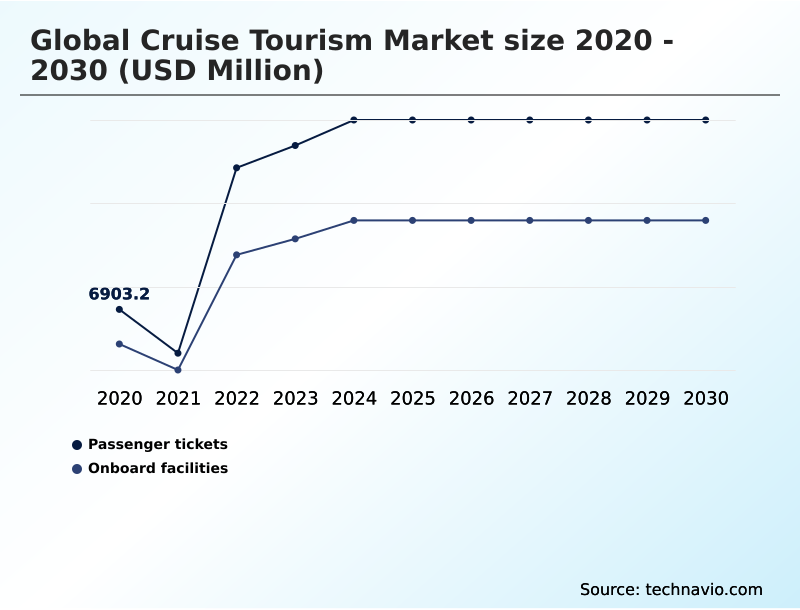
- Product
- Passenger tickets
- Onboard facilities
- Application
- Ocean cruising
- River cruising
- Consumer
- Mainstream
- Premium
- Budget
- Luxury
- Geography
- North America
- US
- Canada
- Mexico
- Europe
- Germany
- UK
- France
- APAC
- China
- Australia
- Japan
- South America
- Brazil
- Argentina
- Middle East and Africa
- UAE
- South Africa
- Saudi Arabia
- Rest of World (ROW)
- North America
By Product Insights
The passenger tickets segment is estimated to witness significant growth during the forecast period.
The passenger tickets segment is foundational to the cruise tourism market, encompassing the primary fare for accommodations and core onboard services.
Strategic yield management of passenger tickets, supported by dynamic pricing models and predictive inventory management, is crucial for optimizing vessel occupancy across seasons.
Modern strategies are evolving beyond simple fares to include bundled value propositions, particularly in the premium cruise segment and luxury cruise segment, to enhance the guest experience.
The North America market remains a significant focus, contributing over 44% of incremental growth, influencing pricing structures and itinerary planning.
Effective management of this segment, including the integration of hyper-personalization and flexible itinerary planning, is essential for maintaining profitability amid fluctuating energy market fluctuations and operational costs.
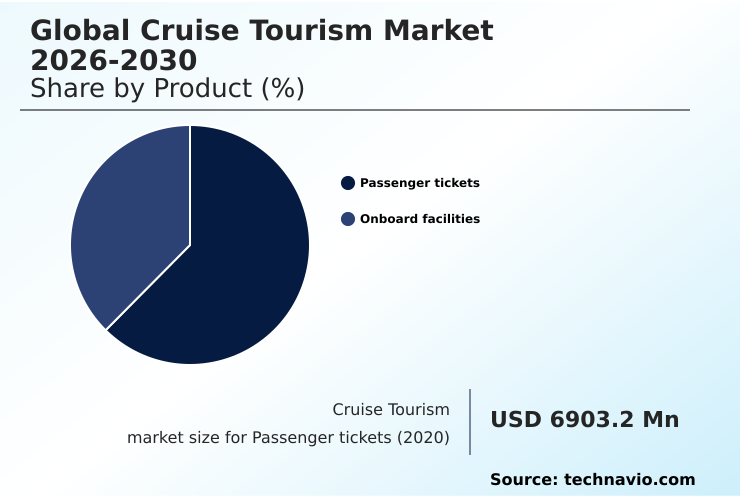
The Passenger tickets segment was valued at USD 21.94 billion in 2024 and showed a gradual increase during the forecast period.
Regional Analysis
North America is estimated to contribute 44.2% to the growth of the global market during the forecast period.Technavio’s analysts have elaborately explained the regional trends and drivers that shape the market during the forecast period.
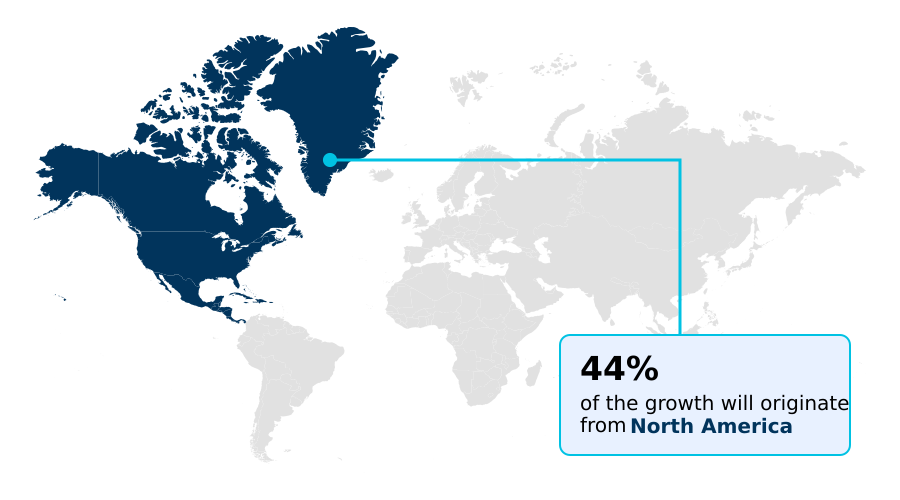
See How Cruise Tourism Market Demand is Rising in North America Get Free Sample
The geographic landscape of the cruise tourism market is led by North America, which accounts for over 44% of the industry's incremental growth, driven by high demand for Caribbean and Alaskan itineraries.
Europe remains a critical market, with operators focused on environmental regulatory compliance and shoreside power integration to meet stringent regional mandates.
The APAC region is the fastest-growing market, with significant investments in port infrastructure development and passenger flow management to accommodate new deployments.
In this region, a focus on digital transformation in cruising and immersive shore excursions is key to attracting a rapidly expanding middle class.
Meanwhile, emerging regions in South America and the Middle East are expanding their roles, particularly in expedition cruising and as winter sun destinations, diversifying global itineraries and mitigating the risks of human capital retention challenges in any single region.
Market Dynamics
Our researchers analyzed the data with 2025 as the base year, along with the key drivers, trends, and challenges. A holistic analysis of drivers will help companies refine their marketing strategies to gain a competitive advantage.
- Strategic decision-making in the cruise tourism market is increasingly complex, shaped by technological and operational trade-offs. The debate over LNG vs methanol cruise ship propulsion highlights the industry's long-term capital investment in sustainability, with choices directly influencing vessel sanitation program compliance cost and brand perception.
- Onboard, the deployment of AI for dynamic cruise pricing models and the integration of AI virtual assistants are revolutionizing revenue management and service delivery. This push for hyper-personalization in the luxury cruise segment is complemented by the widespread adoption of wearable tech for contactless cruise payments, enhancing the guest experience.
- This tech-forward approach is critical as operators balance the different demands of the river cruising vs ocean cruising market. Fleet expansion impact on occupancy rates is a constant concern, managed through sophisticated yield strategies. At the destination level, private island destination revenue optimization is becoming a core part of financial planning.
- However, the industry's growth is tempered by external factors, including the persistent impact of geopolitical risk on itineraries and the need to manage cruise labor supply shortages. The evolution of next-generation megaship entertainment options continues to attract new demographics, but challenges of over-tourism in cruise ports require careful management.
- Ultimately, sustainability as a cruise marketing tool is proving effective, with fleets demonstrating green credentials reporting higher booking interest, sometimes by a margin of 10-15% over conventional offerings.
What are the key market drivers leading to the rise in the adoption of Cruise Tourism Industry?
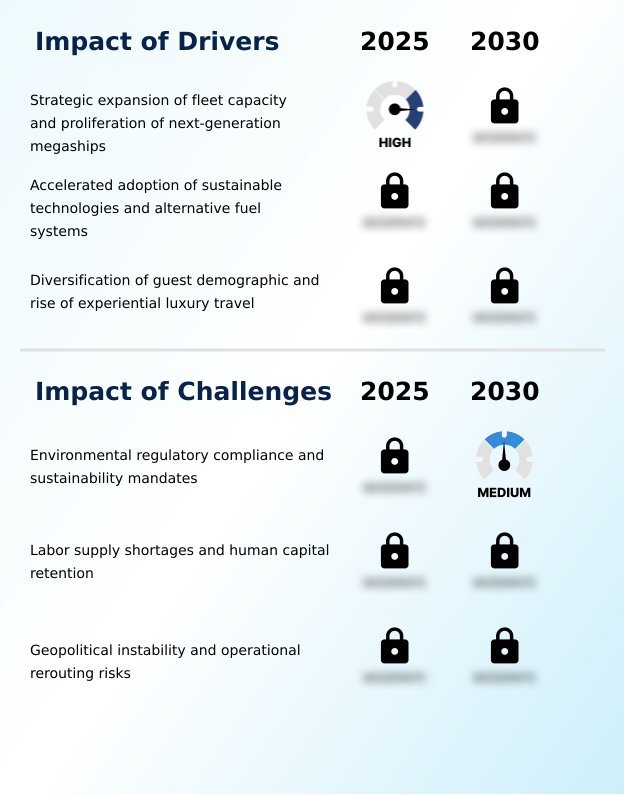
- The strategic expansion of fleet capacity, marked by the proliferation of next-generation megaships, is a key driver for the market.
- Market growth is propelled by several key drivers, beginning with aggressive fleet capacity expansion through the introduction of next-generation megaships, which feature an average of 20% more cabin capacity than the models they replace.
- A second driver is the industry-wide adoption of sustainable maritime technologies and alternative fuel systems, driven by both regulatory pressure and consumer demand, with over 50% of new builds now featuring LNG or multi-fuel propulsion systems.
- The third driver is the diversification of the passenger base, with a notable increase in millennial and Gen Z travelers attracted to high-tech onboard environments and unique experiential luxury travel.
- This demographic shift is expanding demand for both the budget cruise segment and niche adventure voyages.
What are the market trends shaping the Cruise Tourism Industry?
- A key market trend involves the strategic expansion of exclusive private destination portfolios. This allows cruise lines to create controlled, brand-immersive environments and capture more shoreside revenue.
- Key trends are reshaping the cruise tourism market, led by the development of private destination portfolios, which can increase ancillary revenue by over 25% per passenger compared to public ports.
- The second major trend is the adoption of hyper-personalization through generative artificial intelligence; platforms that analyze guest data to provide bespoke recommendations have been shown to boost repeat booking rates by up to 15%. This is enabled by onboard facilities management systems that integrate with guest-facing applications.
- A third trend is the strategic diversification into ultra-luxury niche segments and expedition cruising, which attract a high-yield demographic. These shifts toward a vertically integrated vacation model are supported by digital transformation in cruising and a focus on wellness-focused itineraries to meet evolving consumer demands.
What challenges does the Cruise Tourism Industry face during its growth?
- Adherence to stringent environmental regulatory compliance and sustainability mandates presents a key challenge affecting the industry's growth.
- The cruise tourism market confronts several significant challenges, foremost being the stringent environmental regulatory compliance and sustainability mandates. The capital investment for retrofitting a mid-size vessel with compliant multi-fuel propulsion systems can be substantial, impacting operational budgets.
- Concurrently, a critical labor supply shortage and issues with human capital retention are intensifying, with industry analysis indicating a need for 20,000 new crew members annually to staff new vessels. This gap increases recruitment costs by an estimated 10-15%.
- Finally, geopolitical rerouting risks remain a persistent threat, forcing operators to make costly itinerary changes that can affect fuel consumption and passenger satisfaction, highlighting the need for robust operational resilience strategies and managing passenger ticket yield management under volatile conditions.
Exclusive Technavio Analysis on Customer Landscape
The cruise tourism market forecasting report includes the adoption lifecycle of the market, covering from the innovator’s stage to the laggard’s stage. It focuses on adoption rates in different regions based on penetration. Furthermore, the cruise tourism market report also includes key purchase criteria and drivers of price sensitivity to help companies evaluate and develop their market growth analysis strategies.
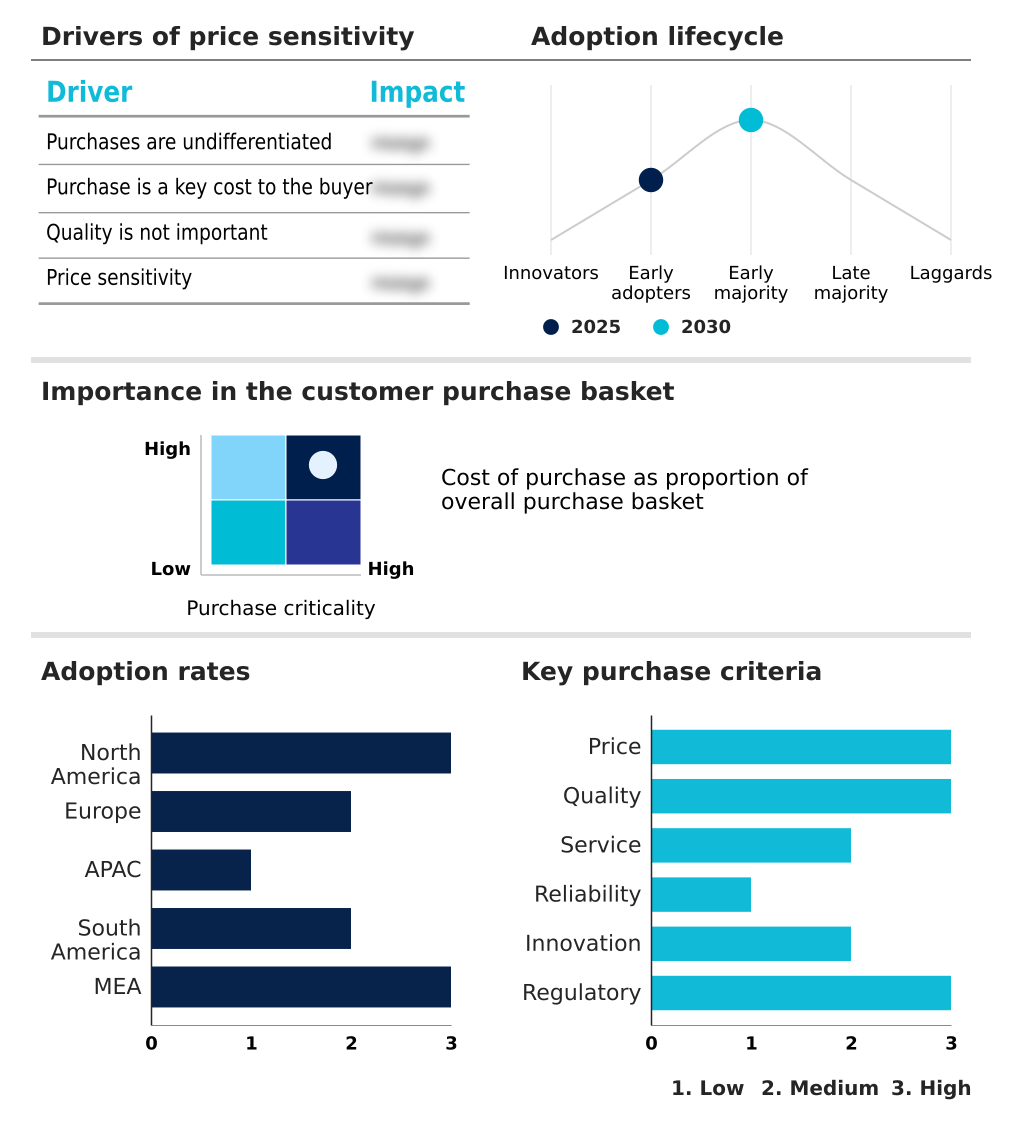
Customer Landscape of Cruise Tourism Industry
Competitive Landscape
Companies are implementing various strategies, such as strategic alliances, cruise tourism market forecast, partnerships, mergers and acquisitions, geographical expansion, and product/service launches, to enhance their presence in the industry.
AmaWaterways - Analysis indicates a portfolio of multi-brand cruise tourism offerings, targeting diverse passenger segments from contemporary to luxury travel experiences.
The industry research and growth report includes detailed analyses of the competitive landscape of the market and information about key companies, including:
- AmaWaterways
- Ambassador Cruise Holidays Ltd.
- American Cruise Lines
- Atlas Ocean Voyages
- Azamara
- Carnival Corp. and Plc
- CroisiEurope SA
- CRYSTAL CRUISES LTD
- Fred Olsen Cruise Lines Ltd
- Hurtigruten Group AS
- KSINC
- Lindblad Expeditions
- MSC Mediterranean Co. SA
- Norwegian Cruise Line Holdings
- Royal Caribbean Group
- SAGA PLC
- Tallink Grupp AS
- The Walt Disney Co.
- TUI AG
- Viking Holdings Ltd
Qualitative and quantitative analysis of companies has been conducted to help clients understand the wider business environment as well as the strengths and weaknesses of key industry players. Data is qualitatively analyzed to categorize companies as pure play, category-focused, industry-focused, and diversified; it is quantitatively analyzed to categorize companies as dominant, leading, strong, tentative, and weak.
Recent Development and News in Cruise tourism market
- In April 2025, Royal Caribbean Group inaugurated its first net-zero energy cruise terminal in Galveston, Texas, which is fully powered by on-site solar panels, setting a new benchmark for sustainable port infrastructure.
- In May 2025, The Cruise Lines International Association (CLIA) published its annual State of the Cruise Industry report, highlighting a marked industry-wide pivot toward sustainable growth and the adoption of alternative fuel systems to meet 2050 net-zero emission targets.
- In January 2025, Viking Holdings Ltd. confirmed an order for two new expedition vessels from Fincantieri, reinforcing its strategic focus on the high-yield polar and remote-region exploration market segment.
- In October 2024, Carnival Corp. and Plc announced a strategic partnership with a leading technology firm to integrate generative AI-powered virtual assistants across its fleet, aiming to enhance real-time guest engagement and personalize onboard services.
Dive into Technavio’s robust research methodology, blending expert interviews, extensive data synthesis, and validated models for unparalleled Cruise Tourism Market insights. See full methodology.
| Market Scope | |
|---|---|
| Page number | 293 |
| Base year | 2025 |
| Historic period | 2020-2024 |
| Forecast period | 2026-2030 |
| Growth momentum & CAGR | Accelerate at a CAGR of 13.5% |
| Market growth 2026-2030 | USD 35373.0 million |
| Market structure | Fragmented |
| YoY growth 2025-2026(%) | 11.9% |
| Key countries | US, Canada, Mexico, Germany, UK, France, Italy, Spain, The Netherlands, China, Australia, Japan, India, South Korea, Indonesia, Brazil, Argentina, Chile, UAE, South Africa, Saudi Arabia, Turkey and Israel |
| Competitive landscape | Leading Companies, Market Positioning of Companies, Competitive Strategies, and Industry Risks |
Research Analyst Overview
- The cruise tourism market exhibits a robust yet complex evolutionary path, defined by significant capital expenditure in both hardware and software. A primary focus is on fleet modernization through next-generation megaships and a strategic pivot towards sustainable operations with methanol-ready engines and liquefied natural gas propulsion.
- Boardroom decisions increasingly center on balancing the high cost of advanced wastewater treatment systems and waste-to-energy technology with long-term regulatory compliance. Vessels integrating shoreside power capabilities can reduce port emissions by over 90%, a critical metric for accessing environmentally sensitive regions.
- This technological push extends to the passenger experience, where generative artificial intelligence, edge computing, and low-earth orbit satellite connectivity enable unprecedented hyper-personalization and the use of virtual concierge services. The market is also bifurcating, with simultaneous growth in both high-capacity mainstream cruise segment ships and specialized vessels for expedition cruising and experiential luxury travel.
- This diversification is supported by dynamic pricing models and predictive inventory management to optimize yield across all segments, including the premium cruise segment and luxury cruise segment.
What are the Key Data Covered in this Cruise Tourism Market Research and Growth Report?
-
What is the expected growth of the Cruise Tourism Market between 2026 and 2030?
-
USD 35.37 billion, at a CAGR of 13.5%
-
-
What segmentation does the market report cover?
-
The report is segmented by Product (Passenger tickets, and Onboard facilities), Application (Ocean cruising, and River cruising), Consumer (Mainstream, Premium, Budget, and Luxury) and Geography (North America, Europe, APAC, South America, Middle East and Africa)
-
-
Which regions are analyzed in the report?
-
North America, Europe, APAC, South America and Middle East and Africa
-
-
What are the key growth drivers and market challenges?
-
Strategic expansion of fleet capacity and proliferation of next-generation megaships, Environmental regulatory compliance and sustainability mandates
-
-
Who are the major players in the Cruise Tourism Market?
-
AmaWaterways, Ambassador Cruise Holidays Ltd., American Cruise Lines, Atlas Ocean Voyages, Azamara, Carnival Corp. and Plc, CroisiEurope SA, CRYSTAL CRUISES LTD, Fred Olsen Cruise Lines Ltd, Hurtigruten Group AS, KSINC, Lindblad Expeditions, MSC Mediterranean Co. SA, Norwegian Cruise Line Holdings, Royal Caribbean Group, SAGA PLC, Tallink Grupp AS, The Walt Disney Co., TUI AG and Viking Holdings Ltd
-
Market Research Insights
- The cruise tourism market is shaped by a dynamic interplay of technological adoption and strategic diversification. The push toward sustainable maritime technologies is clear, with new vessels featuring alternative fuel systems achieving up to a 20% reduction in greenhouse gas emissions compared to older ships.
- Simultaneously, AI-powered guest personalization platforms are enhancing real-time guest engagement, leading to guest satisfaction scores that are 15% higher on digitally integrated ships. This technological shift supports the expansion into boutique yacht-style cruising and remote destination access, where high guest-to-crew ratios are a key differentiator.
- Operators are building operational resilience strategies to manage market volatility, ensuring that investments in port infrastructure development and fleet modernization deliver consistent returns.
We can help! Our analysts can customize this cruise tourism market research report to meet your requirements.
 RIA -
RIA - 
