
Data Entry Outsourcing Services Market Size 2026-2030
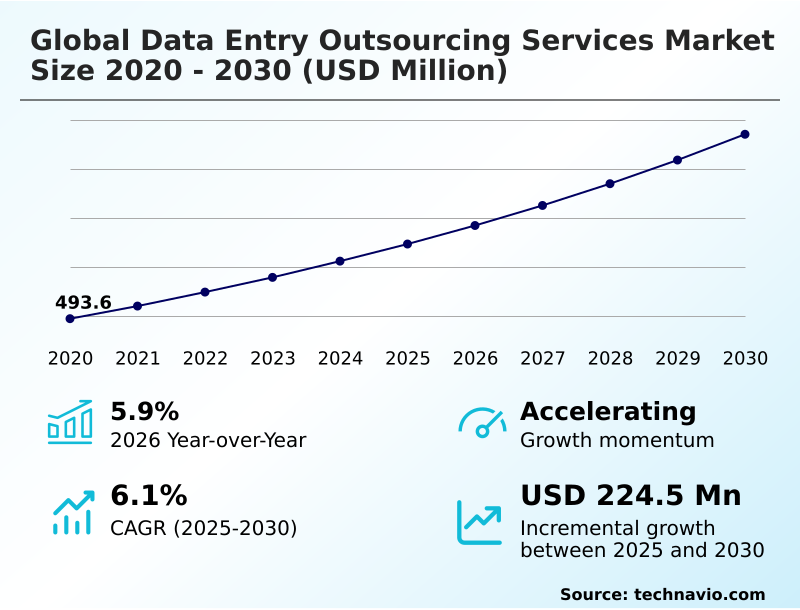
The data entry outsourcing services market size is valued to increase by USD 224.5 million, at a CAGR of 6.1% from 2025 to 2030. Rapid digital transformation and data proliferation will drive the data entry outsourcing services market.
Major Market Trends & Insights
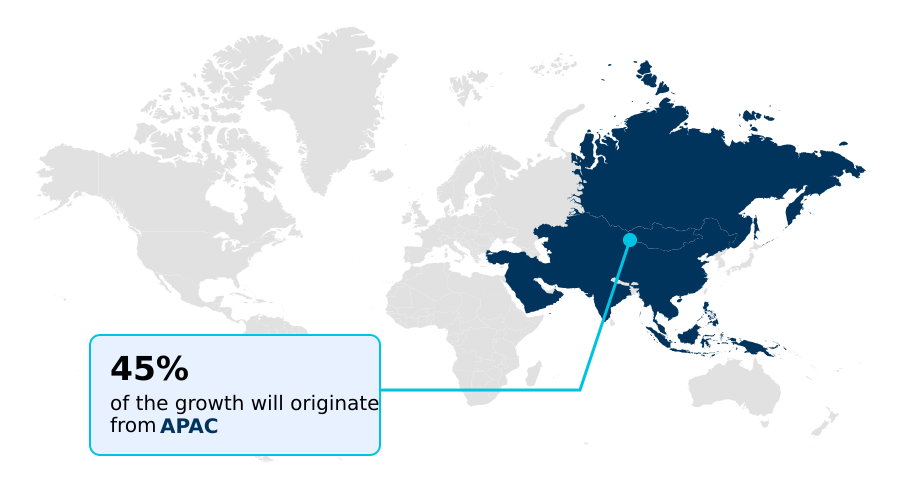
- APAC dominated the market and accounted for a 45.1% growth during the forecast period.
- By Type - E-commerce products segment was valued at USD 203.6 million in 2024
- By End-user - BFSI segment accounted for the largest market revenue share in 2024
Market Size & Forecast
- Market Opportunities: USD 377.2 million
- Market Future Opportunities: USD 224.5 million
- CAGR from 2025 to 2030 : 6.1%
Market Summary
- The data entry outsourcing services market is undergoing a fundamental shift from labor-intensive transcription to technology-centric data management. This evolution is driven by the corporate imperative to convert vast quantities of unstructured information into structured assets for advanced analytics.
- The integration of intelligent document processing (IDP) and robotic process automation (RPA) is central to this change, enabling the handling of complex data with enhanced speed and accuracy. For instance, a financial institution can leverage these services for Know Your Customer (KYC) compliance, automating the verification of identity documents to reduce onboarding time by over 50% while improving audit trails.
- This human-in-the-loop (HITL) model, where automation handles initial processing and human experts validate exceptions, has become the industry standard. However, this reliance on third-party data handling elevates the importance of robust data security and governance protocols, pushing providers to adopt zero-trust architectures to protect sensitive information and maintain client trust in a data-driven economy.
- The market's trajectory is toward providing high-value data enrichment and analytics, moving far beyond simple clerical tasks.
What will be the Size of the Data Entry Outsourcing Services Market during the forecast period?
Get Key Insights on Market Forecast (PDF) Get Free Sample
How is the Data Entry Outsourcing Services Market Segmented?
The data entry outsourcing services industry research report provides comprehensive data (region-wise segment analysis), with forecasts and estimates in "USD million" for the period 2026-2030, as well as historical data from 2020-2024 for the following segments.
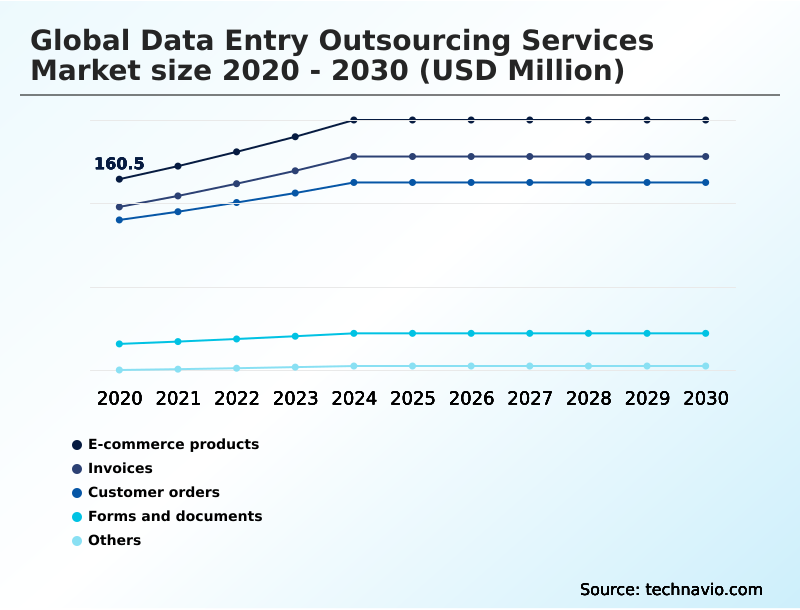
- Type
- E-commerce products
- Invoices
- Customer orders
- Forms and documents
- Others
- End-user
- BFSI
- IT and telecom
- Manufacturing
- Healthcare
- Others
- Application
- Large enterprises
- Small and medium-sized enterprises
- Customer type
- Long-term contracts
- Short-term contracts
- Geography
- APAC
- China
- India
- Japan
- North America
- US
- Canada
- Mexico
- South America
- Brazil
- Argentina
- Europe
- Germany
- UK
- France
- Middle East and Africa
- UAE
- Saudi Arabia
- South Africa
- Rest of World (ROW)
- APAC
By Type Insights
The e-commerce products segment is estimated to witness significant growth during the forecast period.
The e-commerce products segment is foundational to the data entry outsourcing services market, driven by the need for precise catalog management. As online retailers expand, the demand for accurate product data, including SEO-optimized descriptions and metadata, intensifies.
Outsourcing provides scalable workforces for managing thousands of SKUs, ensuring data consistency for a better user experience and minimizing cart abandonment. Utilizing advanced optical character recognition and robotic process automation, providers streamline unstructured data ingestion from manufacturers, which accelerates time-to-market.
A hybrid model for e-commerce catalog management is common, focusing on multi-language product localization and invoice processing automation.
This strategic delegation of back-office administrative support, including medical records digitization and accounts payable automation, allows e-commerce enterprises to focus on core competencies, improving data accuracy for product listings by over 98%.
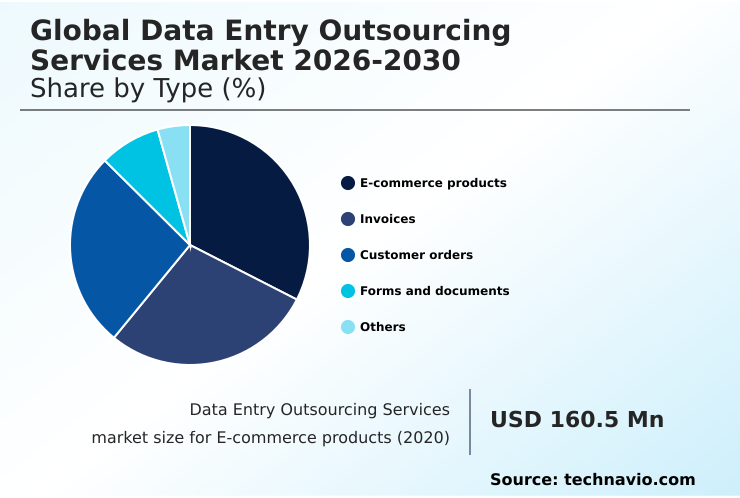
The E-commerce products segment was valued at USD 203.6 million in 2024 and showed a gradual increase during the forecast period.
Regional Analysis
APAC is estimated to contribute 45.1% to the growth of the global market during the forecast period.Technavio’s analysts have elaborately explained the regional trends and drivers that shape the market during the forecast period.
See How Data Entry Outsourcing Services Market Demand is Rising in APAC Get Free Sample
The geographic landscape of the market is defined by a dual focus on global delivery and regional compliance.
APAC, particularly India and the Philippines, remains the primary hub for service delivery, handling an estimated 60% of all outsourced data entry tasks due to its vast talent pool and cost advantages.
North America and Europe function as the principal demand centers, with a growing emphasis on data residency solutions to comply with strict privacy regulations.
This has spurred the growth of nearshore locations in Latin America and Eastern Europe, which offer time-zone alignment and cultural affinity. These nearshore centers have seen a 15% year-over-year increase in contract volumes from US firms.
The market is also seeing the rise of transaction processing services that support real-time data entry and provide a clear data entry audit trail to meet stringent regulatory requirements across jurisdictions.
Market Dynamics
Our researchers analyzed the data with 2025 as the base year, along with the key drivers, trends, and challenges. A holistic analysis of drivers will help companies refine their marketing strategies to gain a competitive advantage.
- The strategic application of data entry outsourcing services is evolving, with businesses seeking specialized solutions that deliver measurable ROI. The impact of RPA on data entry efficiency is a primary consideration, as firms look to automate repetitive tasks and free up internal resources.
- AI-driven data capture solutions for finance are particularly in demand, enabling higher accuracy in transaction processing and compliance. The role of data entry in digital transformation is now a boardroom-level conversation, moving beyond simple cost savings. Human-in-the-loop for medical data annotation highlights the market's shift toward high-value, specialized tasks that power complex AI models.
- Many companies are realizing the benefits of outsourcing e-commerce product data to maintain competitive online catalogs. Simultaneously, secure data entry for PII and compliance has become non-negotiable. Businesses are actively comparing data entry outsourcing pricing models, with many moving toward outcome-based data entry service agreements.
- The challenges of unstructured data extraction are being met with intelligent character recognition for handwritten forms and advanced data annotation services for machine learning. This has proven vital for data entry outsourcing for small business, which can now access enterprise-grade technology.
- Best practices for data entry quality assurance, including robust data validation and cleansing, are critical for improving data entry accuracy with automation. Ultimately, data entry workflow automation benefits are realized through seamless integration with data entry services for ERP systems, supporting broader data migration outsourcing services and ensuring cloud-based data entry platform security.
What are the key market drivers leading to the rise in the adoption of Data Entry Outsourcing Services Industry?
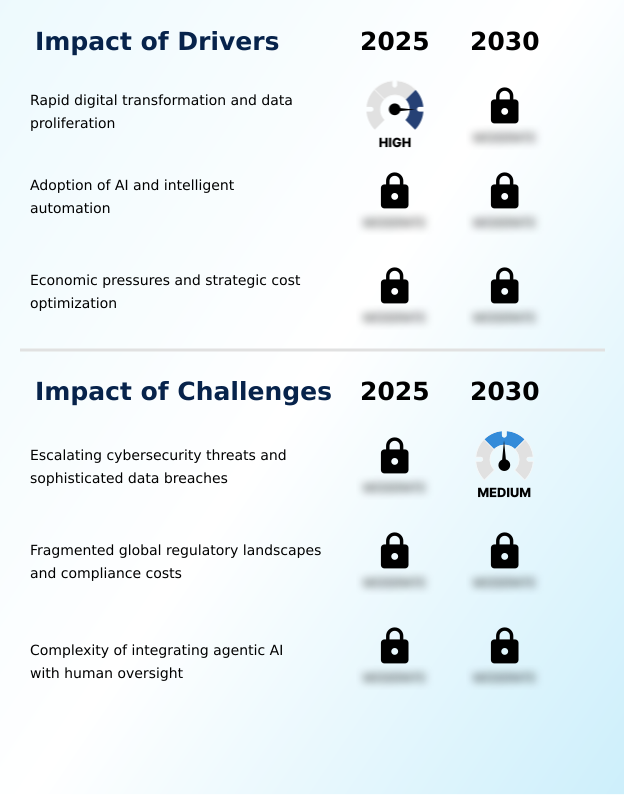
- The rapid pace of digital transformation, coupled with the proliferation of data across industries, serves as the primary driver for market growth.
- The market's growth is fundamentally driven by the enterprise-wide push for digital transformation and operational efficiency.
- Organizations are leveraging outsourcing to manage the massive influx of unstructured data, using specialized services for unstructured data conversion and handwritten document entry to populate core business systems.
- The adoption of advanced workflow automation tools reduces manual processing times for tasks like audio transcription services by up to 70%.
- This technological integration ensures higher data integrity and security, which are critical for maintaining the reliability of customer relationship management (CRM) platforms.
- Furthermore, strategic cost optimization remains a powerful motivator, with companies achieving an average cost reduction of 45% on back-office functions by outsourcing forms processing services and image data entry services to global delivery centers, thus improving data governance.
What are the market trends shaping the Data Entry Outsourcing Services Industry?
- The market is experiencing a significant pivot toward AI-assisted data annotation. This trend is characterized by the adoption of human-in-the-loop frameworks to enhance the quality of machine learning training datasets.
- Key market trends are reshaping service delivery, with a notable pivot toward AI-assisted frameworks and value-centric commercial models. The adoption of intelligent document processing (IDP) combined with human-in-the-loop (HITL) validation is becoming standard for complex tasks like insurance claims processing and legal document management. This hybrid approach improves data validation accuracy by over 30% compared to purely automated systems.
- Concurrently, there is a significant shift from traditional business process outsourcing (BPO) pricing to outcome-based contracts, which now account for nearly 20% of new enterprise agreements. This model incentivizes providers to optimize supply chain data management and KYC compliance processing.
- Furthermore, the rise of digital mailroom services and stricter data sovereignty rules are compelling providers to establish localized data centers that integrate seamlessly with client enterprise resource planning (ERP) systems.
What challenges does the Data Entry Outsourcing Services Industry face during its growth?
- Escalating cybersecurity threats and the increasing sophistication of data breaches present a key challenge affecting industry growth.
- The primary challenges facing the market stem from rising operational complexity and a stringent regulatory environment. Integrating advanced machine learning (ML) models for data classification requires significant investment in data entry for AI training and specialized talent, which can be a barrier for smaller providers.
- Maintaining a high data entry accuracy rate is a constant struggle, with error rates in unverified automated systems being up to 15% higher than in human-validated workflows. Furthermore, ensuring compliance across multiple jurisdictions introduces significant overhead, with robust database management services and data entry quality control protocols becoming a major cost center.
- The technical difficulty of tasks like data extraction from legacy systems and the need for strict service level agreements (SLAs) for data enrichment further complicate service delivery, making knowledge process outsourcing (KPO) a high-stakes endeavor.
Exclusive Technavio Analysis on Customer Landscape
The data entry outsourcing services market forecasting report includes the adoption lifecycle of the market, covering from the innovator’s stage to the laggard’s stage. It focuses on adoption rates in different regions based on penetration. Furthermore, the data entry outsourcing services market report also includes key purchase criteria and drivers of price sensitivity to help companies evaluate and develop their market growth analysis strategies.
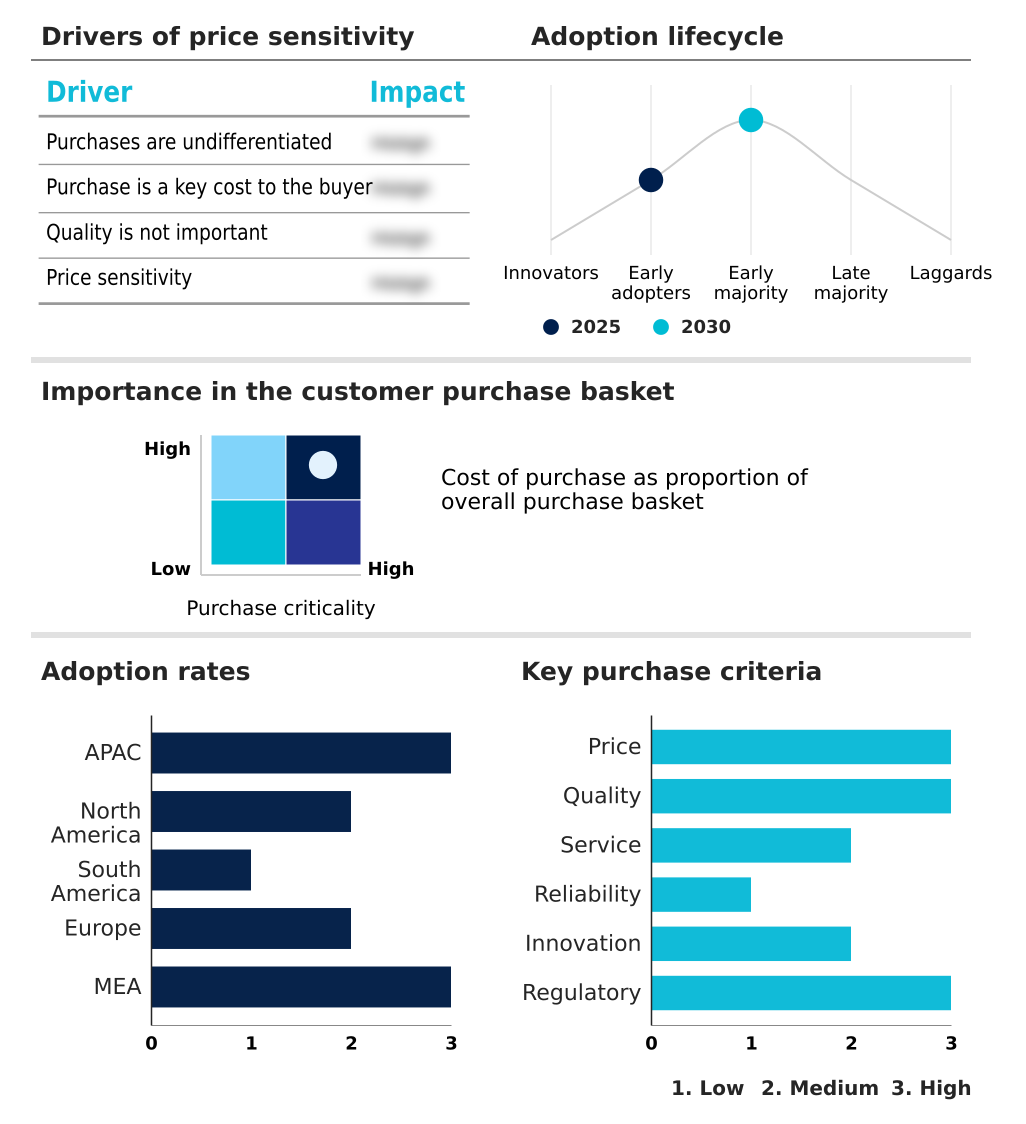
Customer Landscape of Data Entry Outsourcing Services Industry
Competitive Landscape
Companies are implementing various strategies, such as strategic alliances, data entry outsourcing services market forecast, partnerships, mergers and acquisitions, geographical expansion, and product/service launches, to enhance their presence in the industry.
Accenture Plc - Delivers intelligent data capture and high-volume processing solutions, integrating automation to enhance data validation and enterprise client workflows across multiple industries.
The industry research and growth report includes detailed analyses of the competitive landscape of the market and information about key companies, including:
- Accenture Plc
- Capgemini SE
- Cognizant Technology Solution
- Concentrix Corp.
- ExlService Holdings Inc.
- Flatworld Solutions Inc.
- Genpact Ltd.
- HCL Technologies Ltd.
- IBM Corp.
- Infosys BPM Ltd.
- Invensis Technologies Pvt. Ltd.
- Outsource2india
- SunTec Web Services Pvt. Ltd.
- Sutherland Global Services
- Tata Consultancy Services
- Tech Mahindra Ltd.
- Trupp Global Technologies Ltd
- Unity Communications LLC
- Wipro Ltd.
- WNS Holdings Ltd.
Qualitative and quantitative analysis of companies has been conducted to help clients understand the wider business environment as well as the strengths and weaknesses of key industry players. Data is qualitatively analyzed to categorize companies as pure play, category-focused, industry-focused, and diversified; it is quantitatively analyzed to categorize companies as dominant, leading, strong, tentative, and weak.
Recent Development and News in Data entry outsourcing services market
- In September 2024, Accenture announced the acquisition of a leading data annotation firm to enhance its AI-driven data services, aiming to improve training data quality for enterprise machine learning models.
- In November 2024, Infosys BPM Ltd. launched a new intelligent document processing platform that leverages generative AI to achieve over 99% accuracy in extracting data from complex, unstructured financial documents.
- In February 2025, Wipro Ltd. secured a multi-year contract with a major European retailer to manage its entire e-commerce catalog data, utilizing an AI-powered workflow to reduce time-to-market for new products by 40%.
- In April 2025, Cognizant expanded its partnership with a global pharmaceutical company to provide end-to-end data management for clinical trials, ensuring compliance with evolving international data privacy regulations.
Dive into Technavio’s robust research methodology, blending expert interviews, extensive data synthesis, and validated models for unparalleled Data Entry Outsourcing Services Market insights. See full methodology.
| Market Scope | |
|---|---|
| Page number | 330 |
| Base year | 2025 |
| Historic period | 2020-2024 |
| Forecast period | 2026-2030 |
| Growth momentum & CAGR | Accelerate at a CAGR of 6.1% |
| Market growth 2026-2030 | USD 224.5 million |
| Market structure | Fragmented |
| YoY growth 2025-2026(%) | 5.9% |
| Key countries | China, India, Japan, Philippines, Australia, South Korea, US, Canada, Mexico, Brazil, Argentina, Chile, Germany, UK, France, Italy, Spain, The Netherlands, UAE, Saudi Arabia, South Africa, Israel and Egypt |
| Competitive landscape | Leading Companies, Market Positioning of Companies, Competitive Strategies, and Industry Risks |
Research Analyst Overview
- The data entry outsourcing services market has transformed into a technology-driven ecosystem where service providers are differentiated by their intelligent automation capabilities rather than labor arbitrage. The integration of optical character recognition (OCR), intelligent character recognition (ICR), and robotic process automation (RPA) has become standard, facilitating high-volume data extraction and workflow automation.
- This technological shift supports complex data migration projects and ensures data integrity within enterprise resource planning (ERP) and customer relationship management (CRM) systems. Boardroom decisions now focus on data governance and data security, compelling providers to implement zero trust architecture to protect personally identifiable information (PII).
- The industry has moved toward sophisticated knowledge process outsourcing (KPO) functions, including data annotation and data enrichment for machine learning (ML) models. The use of human-in-the-loop (HITL) frameworks for data validation and data cleansing ensures high quality, supported by stringent service level agreements (SLA).
- Leveraging these hybrid models for intelligent document processing (IDP) has reduced data error rates to below 0.1% for complex document sets, a critical factor for maintaining data provenance in regulated industries.
What are the Key Data Covered in this Data Entry Outsourcing Services Market Research and Growth Report?
-
What is the expected growth of the Data Entry Outsourcing Services Market between 2026 and 2030?
-
USD 224.5 million, at a CAGR of 6.1%
-
-
What segmentation does the market report cover?
-
The report is segmented by Type (E-commerce products, Invoices, Customer orders, Forms and documents, and Others), End-user (BFSI, IT and telecom, Manufacturing, Healthcare, and Others), Application (Large enterprises, and Small and medium-sized enterprises), Customer Type (Long-term contracts, and Short-term contracts) and Geography (APAC, North America, South America, Europe, Middle East and Africa)
-
-
Which regions are analyzed in the report?
-
APAC, North America, South America, Europe and Middle East and Africa
-
-
What are the key growth drivers and market challenges?
-
Rapid digital transformation and data proliferation, Escalating cybersecurity threats and sophisticated data breaches
-
-
Who are the major players in the Data Entry Outsourcing Services Market?
-
Accenture Plc, Capgemini SE, Cognizant Technology Solution, Concentrix Corp., ExlService Holdings Inc., Flatworld Solutions Inc., Genpact Ltd., HCL Technologies Ltd., IBM Corp., Infosys BPM Ltd., Invensis Technologies Pvt. Ltd., Outsource2india, SunTec Web Services Pvt. Ltd., Sutherland Global Services, Tata Consultancy Services, Tech Mahindra Ltd., Trupp Global Technologies Ltd, Unity Communications LLC, Wipro Ltd. and WNS Holdings Ltd.
-
Market Research Insights
- The market dynamic is shifting from labor arbitrage to technology-led value creation, with a focus on outcome-based partnerships. Service providers are embedding automation into core offerings like invoice processing automation and back-office administrative support, leading to significant efficiency gains. Enterprises adopting these services have reported over a 40% reduction in document processing times.
- The demand for specialized e-commerce catalog management continues to grow, where maintaining high data accuracy is critical. In this area, sophisticated data validation techniques have helped clients achieve a 99.5% accuracy rate in financial reporting.
- This move toward intelligent automation allows organizations to convert fixed operational costs into variable expenses, aligning service provider incentives with business outcomes and enhancing overall operational agility.
We can help! Our analysts can customize this data entry outsourcing services market research report to meet your requirements.
 RIA -
RIA - 
