
Data Visualization Tools Market Size 2026-2030
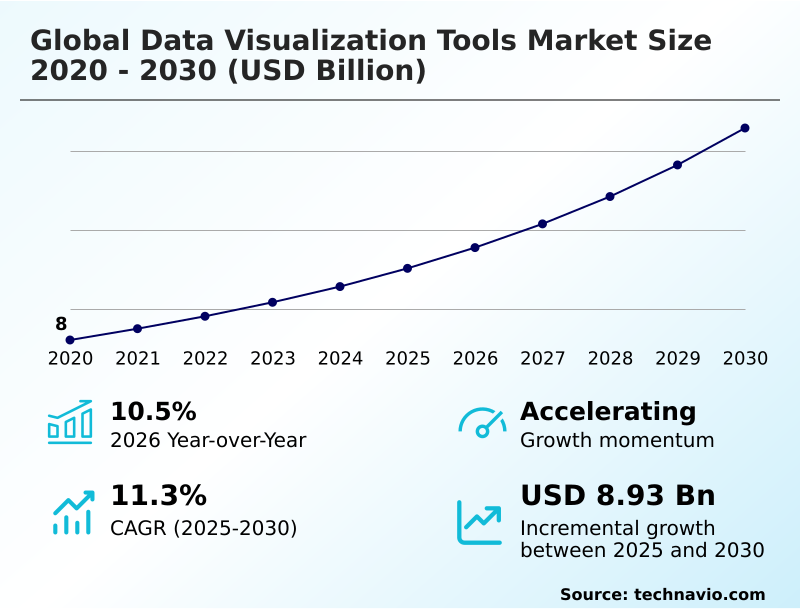
The data visualization tools market size is valued to increase by USD 8.93 billion, at a CAGR of 11.3% from 2025 to 2030. Proliferation of big data and complex datasets will drive the data visualization tools market.
Major Market Trends & Insights
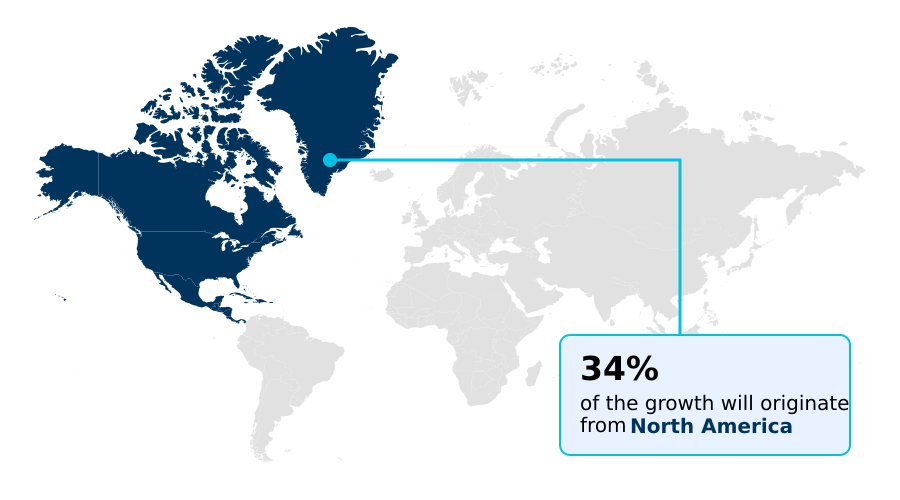
- North America dominated the market and accounted for a 33.6% growth during the forecast period.
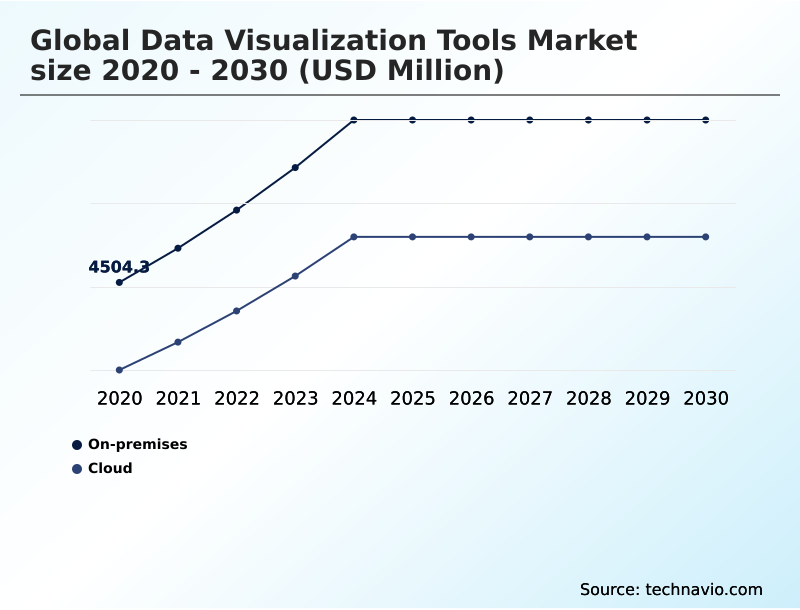
- By Deployment - On-premises segment was valued at USD 6.37 billion in 2024
- By Customer Type - Large enterprises segment accounted for the largest market revenue share in 2024
Market Size & Forecast
- Market Opportunities: USD 13.48 billion
- Market Future Opportunities: USD 8.93 billion
- CAGR from 2025 to 2030 : 11.3%
Market Summary
- The data visualization tools market is central to modern enterprise strategy, enabling organizations to translate vast, complex data streams into actionable intelligence. The market is evolving beyond traditional static reporting, with a significant shift toward interactive platforms that support dynamic data exploration.
- This transformation is driven by the explosive growth of data from diverse sources and the pressing need for businesses to make faster, more informed decisions. A key trend is the rise of self-service business intelligence, which empowers non-technical users to conduct their own analyses, fostering a data-literate culture.
- For instance, in supply chain management, a logistics manager can use an interactive dashboard to monitor real-time shipment data, identify bottlenecks through geospatial analysis, and run predictive models to forecast delays, all without deep technical expertise.
- The integration of augmented analytics, leveraging AI and machine learning, further accelerates this process by automating insight discovery and proactively highlighting critical trends and anomalies that might otherwise be missed. This shift democratizes analytics and embeds data-driven decision-making into the core operational fabric of the enterprise.
What will be the Size of the Data Visualization Tools Market during the forecast period?
Get Key Insights on Market Forecast (PDF) Get Free Sample
How is the Data Visualization Tools Market Segmented?
The data visualization tools industry research report provides comprehensive data (region-wise segment analysis), with forecasts and estimates in "USD million" for the period 2026-2030, as well as historical data from 2020-2024 for the following segments.
- Deployment
- On-premises
- Cloud
- Customer type
- Large enterprises
- SMEs
- Component
- Software
- Services
- Geography
- North America
- US
- Canada
- Mexico
- Europe
- Germany
- UK
- France
- APAC
- China
- Japan
- India
- South America
- Brazil
- Argentina
- Middle East and Africa
- UAE
- Saudi Arabia
- South Africa
- Rest of World (ROW)
- North America
By Deployment Insights
The on-premises segment is estimated to witness significant growth during the forecast period.
On-premises deployment offers enterprises superior control, aligning with stringent data sovereignty compliance and internal security protocols for enterprise-grade security. This model is essential for organizations where data governance is paramount.
It allows for optimized query performance and direct data access, which is crucial for complex ad-hoc analysis and data exploration without external network dependencies.
Although this approach requires careful management of the total cost of ownership, it provides a high return on investment through enhanced security and performance.
This architecture supports intensive data aggregation and data harmonization from various internal systems, empowering decision-making support and fostering cross-functional data access in a highly controlled environment.
Firms leveraging this model have reported a 20% improvement in query response times for large, localized datasets.
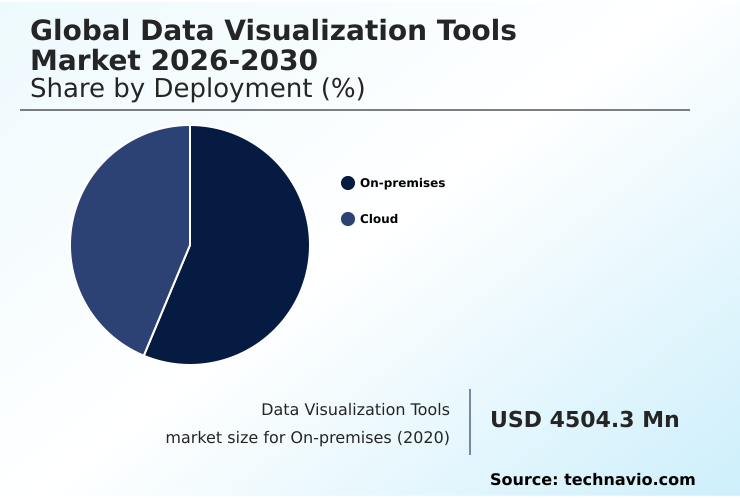
The On-premises segment was valued at USD 6.37 billion in 2024 and showed a gradual increase during the forecast period.
Regional Analysis
North America is estimated to contribute 33.6% to the growth of the global market during the forecast period.Technavio’s analysts have elaborately explained the regional trends and drivers that shape the market during the forecast period.
See How Data Visualization Tools Market Demand is Rising in North America Get Free Sample
The market landscape is shaped by regional technology adoption rates, with a strong shift toward cloud analytics and cloud-native solutions. North America leads due to early adoption, while APAC shows the fastest growth, driven by digitalization.
In Europe, adoption of hybrid cloud environments and multi-cloud platforms is common to address data residency rules. Organizations are leveraging geospatial analysis for marketing campaign analysis and visual analytics for financial risk management.
The focus is on effective data storytelling through analytics dashboards that track key performance metrics. A strong user experience design is crucial for adoption, with well-designed platforms improving user engagement by over 60%.
Advanced data modeling capabilities are essential for delivering actionable insights.
Market Dynamics
Our researchers analyzed the data with 2025 as the base year, along with the key drivers, trends, and challenges. A holistic analysis of drivers will help companies refine their marketing strategies to gain a competitive advantage.
- The adoption of specialized visualization solutions is accelerating as organizations demand tailored insights. For instance, a real-time dashboard for sales enables immediate performance assessment, while embedded analytics for SaaS platforms creates stickier product experiences. The finance department benefits from self-service BI for finance to conduct independent analysis, and the use of augmented analytics in healthcare is improving patient outcomes.
- Marketing teams rely on interactive dashboards for marketing to gauge campaign effectiveness, and logistics divisions use data visualization for supply chain to identify inefficiencies. Across all applications, data security in cloud BI and robust data governance in BI tools are paramount.
- Effective KPI tracking with dashboards is now standard, supported by strong data integration for large enterprises and ETL process automation tools. Use cases like geospatial visualization for retail site planning and predictive modeling visualization tools for forecasting are becoming widespread. The ability to perform ad-hoc reporting for operations and practice effective data storytelling for executives sets leading companies apart.
- A superior mobile dashboard user experience is no longer optional. Firms leveraging these tools for operational planning, particularly with data blending from multiple sources and strong user access control in analytics, report decision-making speeds twice as fast as those using traditional methods.
- The use of natural language query for BI is further simplifying interaction, while tracking performance metrics for manufacturing becomes more precise.
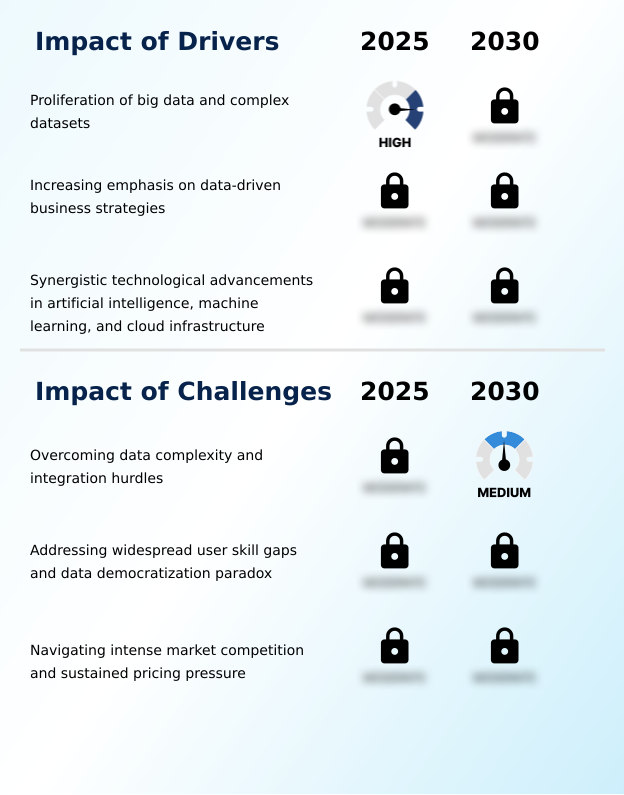
What are the key market drivers leading to the rise in the adoption of Data Visualization Tools Industry?
- The proliferation of big data and the increasing complexity of datasets are key drivers fueling the demand for advanced data visualization tools across industries.
- The increasing need for operational efficiency and strategic business intelligence is a primary market driver. Organizations leverage data visualization for supply chain optimization and to enhance customer relationship management and enterprise resource planning systems.
- Effective data integration is key, streamlining complex ETL processes and reducing manual data wrangling by up to 50%. This allows teams to focus on value-added activities like dashboard design for KPI monitoring.
- Modern reporting tools are moving beyond simple metrics to include predictive analytics, empowering sales force automation by providing actionable insights. A well-designed system can improve operational reporting speed by 35%, directly impacting business agility.
What are the market trends shaping the Data Visualization Tools Industry?
- The integration of artificial intelligence and machine learning is creating a significant market trend known as augmented analytics. This evolution transforms data visualization from passive reporting into an active, intelligent data discovery process.
- The integration of augmented analytics is reshaping the market, driving a shift toward automated insight generation. This evolution is powered by machine learning algorithms and natural language processing, enabling conversational queries through natural language querying. The result is a greater level of data democratization, fostering a data-driven culture across organizations.
- Tools are increasingly featuring embedded analytics and real-time data visualization within core business applications. This allows users to perform data discovery using interactive dashboards and self-service business intelligence tools, reducing reliance on specialized analysts by 40%. The adoption of these capabilities improves forecast accuracy by over 18%, making advanced analysis accessible to a wider audience.
What challenges does the Data Visualization Tools Industry face during its growth?
- Overcoming the challenges of data complexity and integration hurdles is critical for unlocking the full potential and continued growth of the data visualization tools market.
- A significant challenge involves managing data complexity and ensuring security. Implementing robust data security protocols and granular user access controls is critical, especially with the rise of mobile business intelligence and collaborative dashboards. Organizations struggle with data blending from disparate sources and ensuring data quality through rigorous data cleansing.
- Maintaining clear data lineage and effective data cataloging with proper metadata management adds to the complexity. Successful API customization to connect different systems can be difficult, while poor user interface elements can hinder adoption. Firms report that inadequate audit trail functionality increases compliance risks by 25%, making statistical analysis outputs less trustworthy.
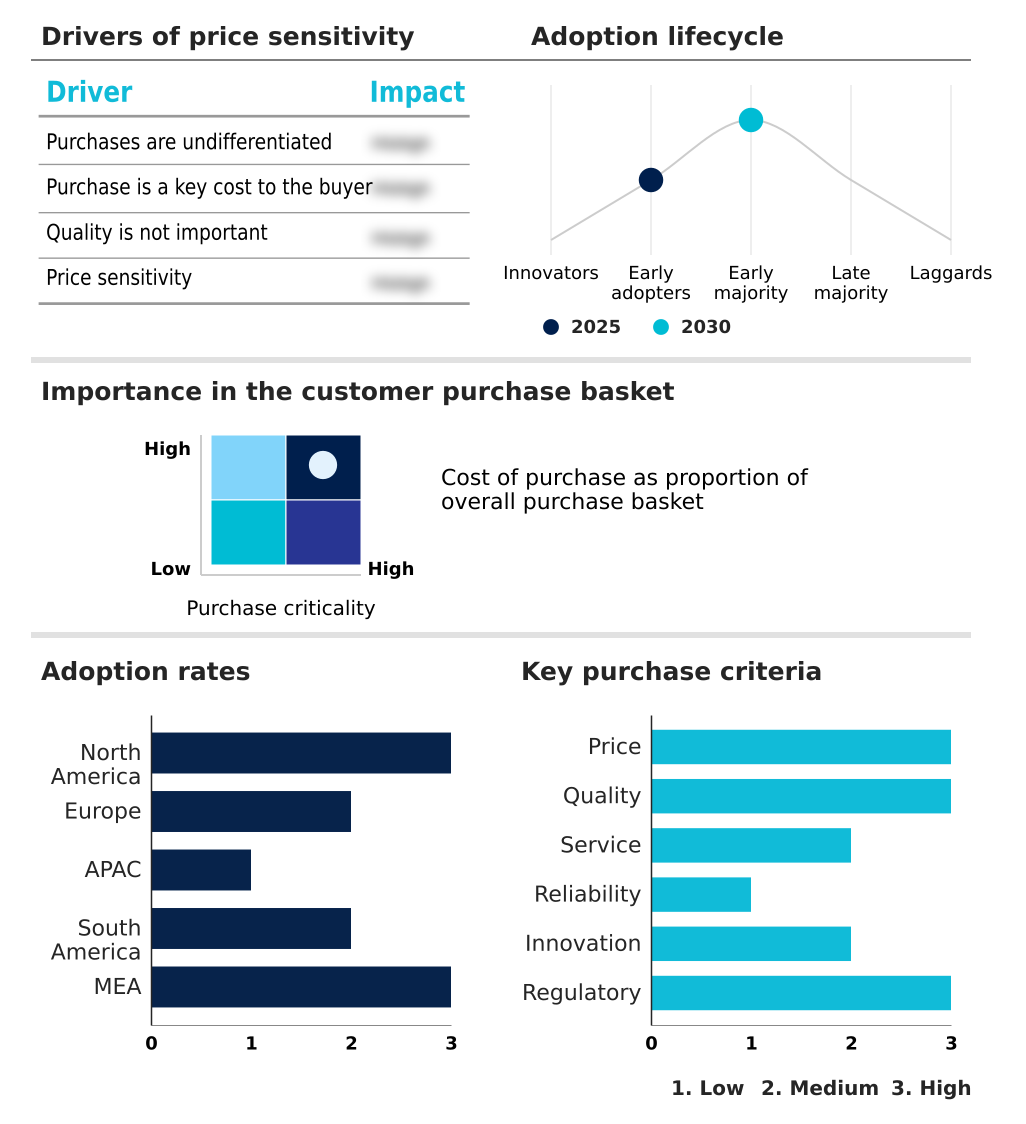
Exclusive Technavio Analysis on Customer Landscape
The data visualization tools market forecasting report includes the adoption lifecycle of the market, covering from the innovator’s stage to the laggard’s stage. It focuses on adoption rates in different regions based on penetration. Furthermore, the data visualization tools market report also includes key purchase criteria and drivers of price sensitivity to help companies evaluate and develop their market growth analysis strategies.
Customer Landscape of Data Visualization Tools Industry
Competitive Landscape
Companies are implementing various strategies, such as strategic alliances, data visualization tools market forecast, partnerships, mergers and acquisitions, geographical expansion, and product/service launches, to enhance their presence in the industry.
Alibaba Cloud - A provider of enterprise-level data visualization and BI analytics tools, transforming complex datasets into actionable insights via its advanced analytics and visualization platform.
The industry research and growth report includes detailed analyses of the competitive landscape of the market and information about key companies, including:
- Alibaba Cloud
- Alteryx Inc.
- Amazon.com Inc.
- Cluvio GmbH
- Databox Inc.
- Domo Inc.
- GoodData Corp.
- Google LLC
- IBM Corp.
- insightsoftware
- Klipfolio Inc.
- Microsoft Corp.
- Oracle Corp.
- QlikTech International AB
- Salesforce Inc.
- SAP SE
- SAS Institute Inc.
- Sisense Ltd.
- TIBCO Software Inc.
- Zoho Corp. Pvt. Ltd.
Qualitative and quantitative analysis of companies has been conducted to help clients understand the wider business environment as well as the strengths and weaknesses of key industry players. Data is qualitatively analyzed to categorize companies as pure play, category-focused, industry-focused, and diversified; it is quantitatively analyzed to categorize companies as dominant, leading, strong, tentative, and weak.
Recent Development and News in Data visualization tools market
- In November 2024, Microsoft Corp. enhanced its mobile analytics capabilities by integrating its AI-powered Copilot into Power BI Mobile apps, allowing users to perform data exploration using natural language on mobile devices.
- In January 2025, QlikTech International AB formed a strategic partnership with a major North American cloud provider to embed its scalable data visualization tools within hybrid cloud environments, focusing on enhanced performance and security for enterprise clients.
- In April 2025, Salesforce Inc. launched an AI-augmented data visualization suite for its Tableau platform, featuring enhanced automation and natural language querying to support enterprise-wide data-driven decision-making.
- In September 2024, Alteryx Inc. announced the acquisition of a data governance startup, aiming to integrate advanced data lineage and compliance features directly into its analytics automation platform to address growing enterprise security needs.
Dive into Technavio’s robust research methodology, blending expert interviews, extensive data synthesis, and validated models for unparalleled Data Visualization Tools Market insights. See full methodology.
| Market Scope | |
|---|---|
| Page number | 288 |
| Base year | 2025 |
| Historic period | 2020-2024 |
| Forecast period | 2026-2030 |
| Growth momentum & CAGR | Accelerate at a CAGR of 11.3% |
| Market growth 2026-2030 | USD 8926.6 million |
| Market structure | Fragmented |
| YoY growth 2025-2026(%) | 10.5% |
| Key countries | US, Canada, Mexico, Germany, UK, France, The Netherlands, Italy, Spain, China, Japan, India, South Korea, Australia, Indonesia, Brazil, Argentina, Chile, UAE, Saudi Arabia, South Africa, Israel and Egypt |
| Competitive landscape | Leading Companies, Market Positioning of Companies, Competitive Strategies, and Industry Risks |
Research Analyst Overview
- The data visualization tools market is integral to modern enterprise operations, evolving from simple reporting tools to sophisticated business intelligence platforms. The core function has shifted from static reports to dynamic visual analytics and data exploration, driven by the need to interpret complex datasets.
- A critical trend is the integration of augmented analytics, which automates data discovery and surfaces insights through predictive analytics. This directly impacts boardroom strategy, as interactive dashboards provide executives with real-time KPI monitoring and performance metrics for critical decision-making. For instance, the use of these tools in operational planning has enabled a 30% reduction in analysis time.
- The ability to perform data blending, data cleansing, and data modeling efficiently is paramount. Effective data storytelling, supported by strong dashboard design and geospatial analysis, is becoming a key competitive differentiator, while robust data governance and data security protocols ensure trust and compliance throughout the analytical process from ETL processes to final visualization.
What are the Key Data Covered in this Data Visualization Tools Market Research and Growth Report?
-
What is the expected growth of the Data Visualization Tools Market between 2026 and 2030?
-
USD 8.93 billion, at a CAGR of 11.3%
-
-
What segmentation does the market report cover?
-
The report is segmented by Deployment (On-premises, and Cloud), Customer Type (Large enterprises, and SMEs), Component (Software, and Services) and Geography (North America, Europe, APAC, South America, Middle East and Africa)
-
-
Which regions are analyzed in the report?
-
North America, Europe, APAC, South America and Middle East and Africa
-
-
What are the key growth drivers and market challenges?
-
Proliferation of big data and complex datasets, Overcoming data complexity and integration hurdles
-
-
Who are the major players in the Data Visualization Tools Market?
-
Alibaba Cloud, Alteryx Inc., Amazon.com Inc., Cluvio GmbH, Databox Inc., Domo Inc., GoodData Corp., Google LLC, IBM Corp., insightsoftware, Klipfolio Inc., Microsoft Corp., Oracle Corp., QlikTech International AB, Salesforce Inc., SAP SE, SAS Institute Inc., Sisense Ltd., TIBCO Software Inc. and Zoho Corp. Pvt. Ltd.
-
Market Research Insights
- The market is characterized by a rapid evolution toward intelligent, accessible analytics, fostering a data-driven culture. Organizations are leveraging these tools to improve operational efficiency and gain strategic business intelligence. The adoption of cloud-native solutions has seen a 60% increase in deployment speed compared to legacy systems.
- This shift is enabling better decision-making support across departments, from marketing campaign analysis to financial risk management. The trend of data democratization empowers more users, with companies reporting that self-service business intelligence tools reduce report generation times by up to 75%.
- Collaborative dashboards further enhance team productivity, integrating insights from customer relationship management and enterprise resource planning data to provide a holistic business view, thereby increasing the overall return on investment.
We can help! Our analysts can customize this data visualization tools market research report to meet your requirements.
 RIA -
RIA - 
