
Digital Publishing Market Size 2026-2030
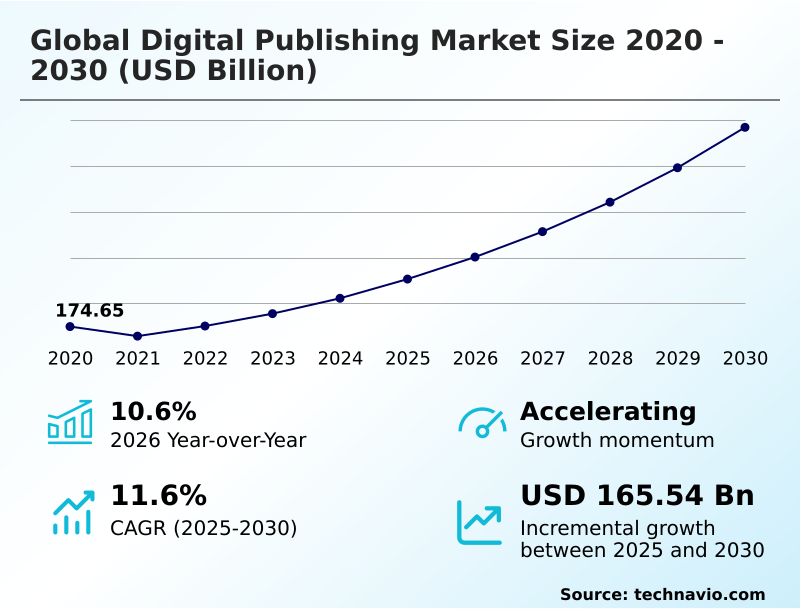
The digital publishing market size is valued to increase by USD 165.54 billion, at a CAGR of 11.6% from 2025 to 2030. Rise in penetration of smartphones and easy access to internet will drive the digital publishing market.
Major Market Trends & Insights
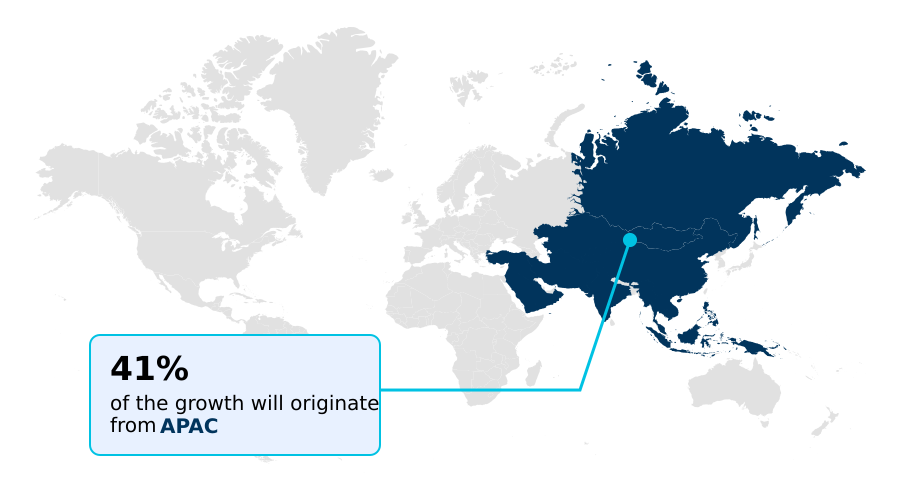
- APAC dominated the market and accounted for a 40.8% growth during the forecast period.
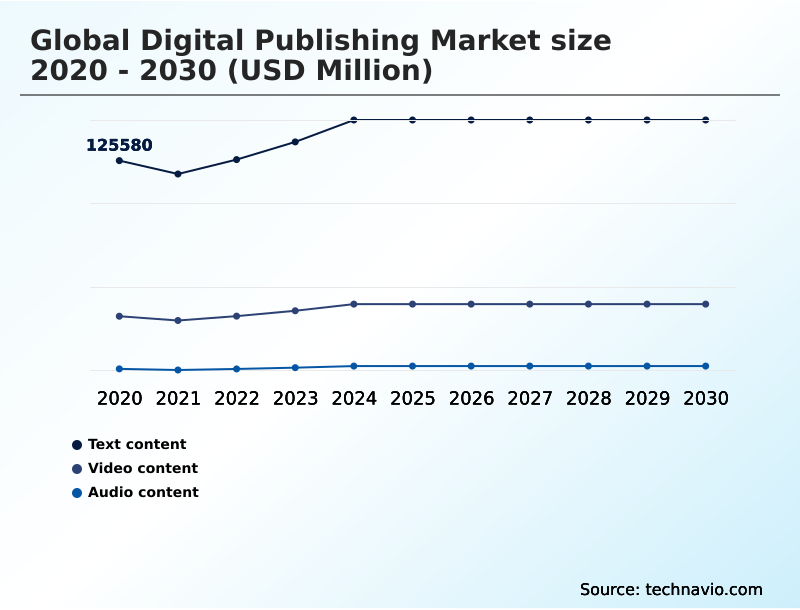
- By Product - Text content segment was valued at USD 148.15 billion in 2024
- By Application - Smartphones segment accounted for the largest market revenue share in 2024
Market Size & Forecast
- Market Opportunities: USD 217.35 billion
- Market Future Opportunities: USD 165.54 billion
- CAGR from 2025 to 2030 : 11.6%
Market Summary
- The digital publishing market is undergoing a significant transformation, driven by the convergence of technology and evolving consumer preferences. Key drivers include the ubiquitous adoption of mobile devices and high-speed internet, which have made digital content more accessible than ever.
- This shift is compelling publishers to move beyond static formats, embracing interactive multimedia elements and dynamic content delivery to enhance reader engagement. A major trend is the adoption of subscription models, where platforms offer unlimited access to vast content libraries for a monthly fee. However, this model introduces the challenge of subscription fatigue and intense competition for consumer attention.
- In a real-world scenario, a media house utilizes personalization algorithms to curate unique news feeds for its users, tracking reader engagement metrics to refine its content strategy and boost retention. This data-driven approach allows for better audience segmentation and targeted content monetization, illustrating the industry's move toward highly personalized and value-driven experiences.
- Balancing high-quality content production with sustainable revenue models remains a central focus for participants in this dynamic market.
What will be the Size of the Digital Publishing Market during the forecast period?
Get Key Insights on Market Forecast (PDF) Get Free Sample
How is the Digital Publishing Market Segmented?
The digital publishing industry research report provides comprehensive data (region-wise segment analysis), with forecasts and estimates in "USD million" for the period 2026-2030, as well as historical data from 2020-2024 for the following segments.
- Product
- Text content
- Video content
- Audio content
- Application
- Smartphones
- Laptops
- PCs
- Component
- Software
- Services
- Geography
- APAC
- China
- Japan
- India
- North America
- US
- Canada
- Mexico
- Europe
- Germany
- UK
- France
- Middle East and Africa
- UAE
- Saudi Arabia
- South Africa
- South America
- Brazil
- Argentina
- Colombia
- Rest of World (ROW)
- APAC
By Product Insights
The text content segment is estimated to witness significant growth during the forecast period.
The global digital publishing market is segmented by product, application, and geography, reflecting a multi-faceted industry structure. Key product segments include text, video, and audio content, with text content holding a dominant share.
The application landscape is shaped by consumption on smartphones, laptops, and PCs. Geographically, segmentation spans across North America, Europe, APAC, South America, and the Middle East and Africa, with each region showing distinct growth dynamics.
Strategic audience segmentation and the implementation of robust content management systems (CMS) are critical for navigating these segments. Effective content syndication enables publishers to reach diverse audiences, while advanced data analytics provides insights for refining content monetization strategies.
User behavior tracking informs mobile-first design, and interactive multimedia elements enhance engagement. One firm improved reader retention by 25% after optimizing its digital subscription management.
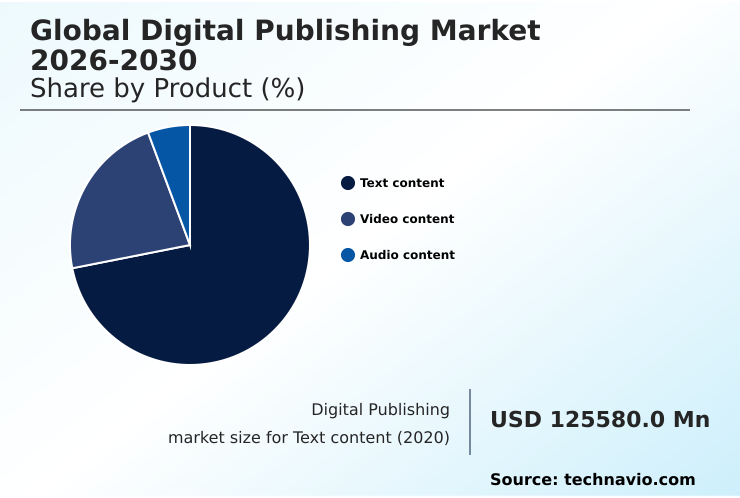
The Text content segment was valued at USD 148.15 billion in 2024 and showed a gradual increase during the forecast period.
Regional Analysis
APAC is estimated to contribute 40.8% to the growth of the global market during the forecast period.Technavio’s analysts have elaborately explained the regional trends and drivers that shape the market during the forecast period.
See How Digital Publishing Market Demand is Rising in APAC Get Free Sample
The geographic landscape of the digital publishing market is characterized by diverse regional dynamics, with North America and Europe representing mature markets and APAC emerging as the fastest-growing region.
In North America, high e-reader technology adoption and sophisticated digital watermarking practices drive the market. Europe focuses on strong digital rights management (DRM) and regulatory compliance, with an emphasis on data privacy.
APAC's growth is fueled by mobile-first design and the explosion of e-learning content development, with countries like China and India leading in mobile consumption.
Successful cross-regional expansion hinges on understanding local preferences, leading some publishers to achieve a 40% increase in user acquisition by localizing content.
Implementing robust content aggregation platforms and semantic search capabilities are crucial for managing diverse content libraries, while dynamic content delivery ensures a personalized experience across all regions.
Market Dynamics
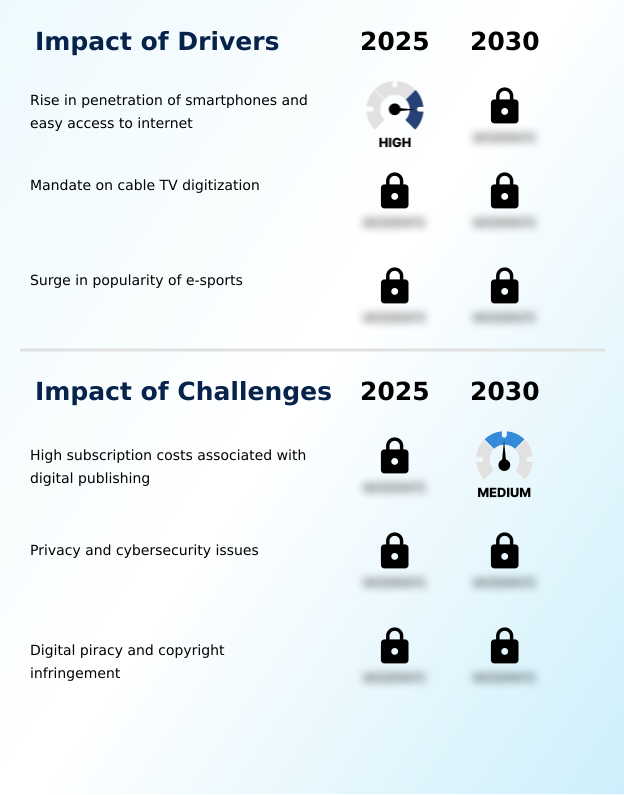
Our researchers analyzed the data with 2025 as the base year, along with the key drivers, trends, and challenges. A holistic analysis of drivers will help companies refine their marketing strategies to gain a competitive advantage.
- Achieving success in the modern digital publishing landscape requires a multifaceted strategy that addresses both content and technology. For instance, integrating DRM in EPUB files is no longer optional but a baseline for protecting intellectual property. Publishers are also adopting OTT standards for text-based media to compete with video-centric platforms, creating more immersive experiences.
- A key area of innovation is the deployment of AR applications in digital magazines, which has been shown to increase reader interaction time by over 40% compared to static pages. Forward-thinking companies are now using AI for content summarization, making long-form content more accessible to mobile users. To enhance discoverability, optimizing content for voice search is becoming critical.
- Monetization strategies are also evolving, with many exploring how to effectively monetize content with micropayments for single articles. Furthermore, digital publishing for corporate training is a rapidly growing B2B segment. To manage this complexity, firms rely on cross-platform analytics for publishers to gain a unified view of user behavior.
- This data informs the use of dynamic content for personalized news feeds and helps in implementing paywalls for niche content. Effectively managing digital subscriptions and refining mobile app strategies for publishers are central to retention. Video integration in digital textbooks is another key trend, alongside improving reader engagement with gamification.
- To combat revenue loss, securing content from digital piracy through advanced analytics for audience segmentation is a top priority. Finally, innovations like print-on-demand for independent authors, optimizing content delivery for 5G, and automating royalty payment systems are reshaping the operational backbone of the industry, with a strong focus on user experience design for readers.
What are the key market drivers leading to the rise in the adoption of Digital Publishing Industry?
- The increasing penetration of smartphones combined with widespread and easy access to the internet serves as the key driver for the market.
- Market growth is primarily driven by technological advancements and shifting consumer habits. The widespread adoption of smartphones has made mobile-first design a fundamental requirement for publishers, leading to a 50% increase in content consumption on handheld devices.
- This is complemented by the expansion of high-speed networks, which facilitates the seamless streaming of video and audio content. The surge in e-learning content development, accelerated by global shifts in education and remote work, has opened substantial new revenue streams.
- Furthermore, the increasing use of cross-platform advertising allows publishers to monetize their audience more effectively across different devices and formats.
- The integration of data analytics into editorial workflows enables publishers to make more informed decisions, with some reporting an 18% improvement in article performance after implementing data-driven strategies.
- This synergy between technology and content is a powerful force propelling the market forward.
What are the market trends shaping the Digital Publishing Industry?
- The proliferation of mobile applications is redefining how users interact with content, creating a dominant trend in the digital publishing market.
- Key trends are reshaping the digital content landscape, with an emphasis on interactive and personalized experiences. The adoption of augmented reality (AR) features in digital publications is a significant trend, with early adopters reporting a 30% increase in user session duration.
- Publishers are heavily investing in mobile publishing platforms that offer sophisticated push notifications and offline reading capabilities to enhance user convenience. Another major trend is the move toward over-the-top (OTT) content delivery, mirroring the video streaming industry to provide a more fluid and engaging experience. This shift has led to a 25% rise in multi-format content delivery.
- Content monetization strategies are also evolving, with a greater focus on flexible subscription models and programmatic advertising to maximize revenue. The rise of podcast distribution platforms and social reading platforms highlights the growing importance of community and audio-based content in the digital ecosystem.
What challenges does the Digital Publishing Industry face during its growth?
- High subscription costs associated with digital publishing present a key challenge affecting the industry's growth.
- The market faces several significant challenges, primarily centered on security, cost, and competition. Digital piracy remains a persistent threat, with unauthorized distribution eroding revenue streams despite the use of digital watermarking and DRM technologies.
- Another major challenge is subscription fatigue, as consumers become overwhelmed by the sheer number of paywalls, with studies showing an average churn rate of 15% for services that increase prices. This forces publishers to innovate with their content monetization strategies, such as offering tiered access or micropayments.
- Privacy concerns are also paramount, as the user behavior tracking required for personalization must comply with stringent data protection regulations. A single data breach can lead to significant financial and reputational damage. Publishers must continuously invest in cybersecurity measures and transparent data practices to maintain user trust and navigate this complex regulatory environment.
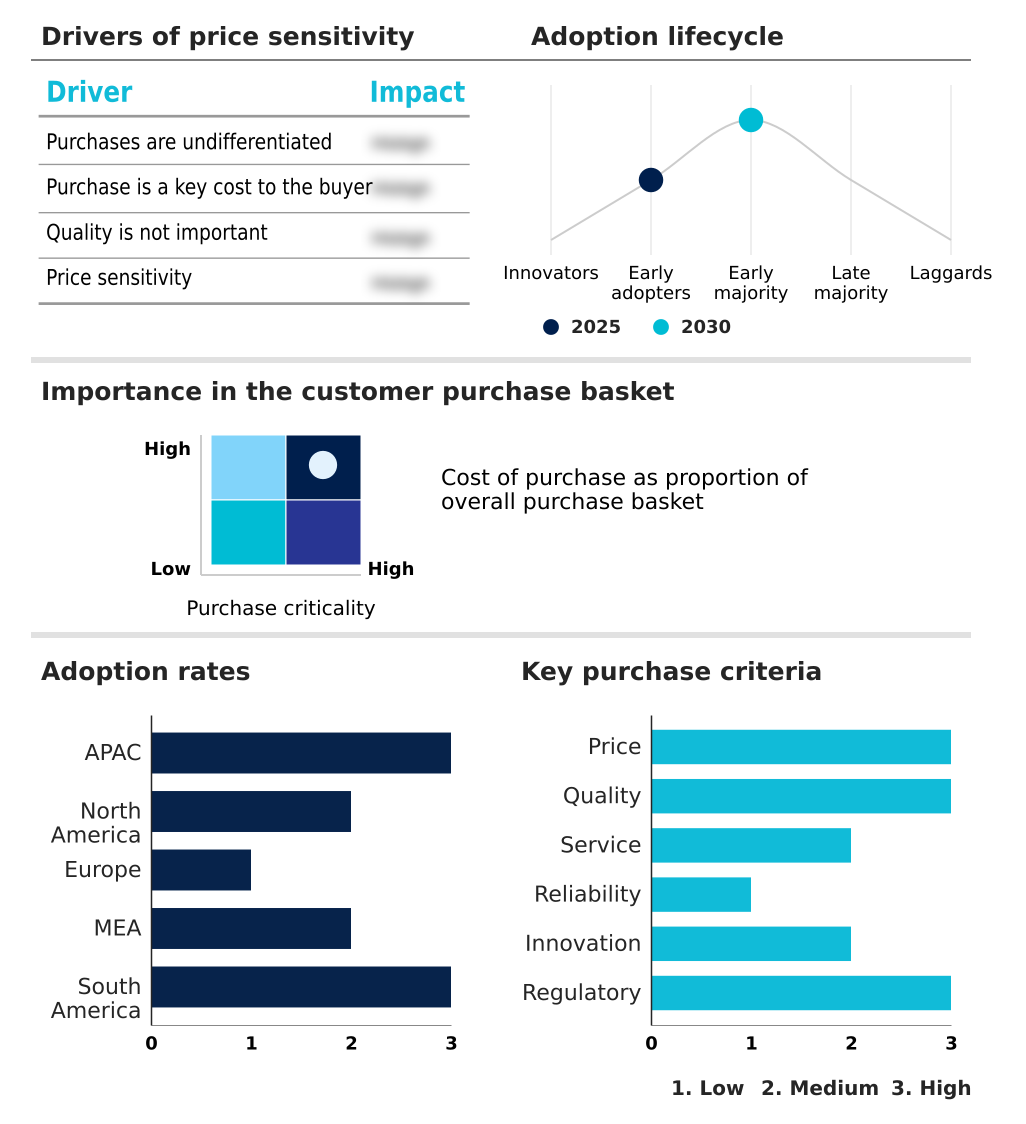
Exclusive Technavio Analysis on Customer Landscape
The digital publishing market forecasting report includes the adoption lifecycle of the market, covering from the innovator’s stage to the laggard’s stage. It focuses on adoption rates in different regions based on penetration. Furthermore, the digital publishing market report also includes key purchase criteria and drivers of price sensitivity to help companies evaluate and develop their market growth analysis strategies.
Customer Landscape of Digital Publishing Industry
Competitive Landscape
Companies are implementing various strategies, such as strategic alliances, digital publishing market forecast, partnerships, mergers and acquisitions, geographical expansion, and product/service launches, to enhance their presence in the industry.
Adobe Inc. - Key offerings include cloud-based tools enabling the creation, management, and delivery of interactive content across web, mobile, and document formats for a global audience.
The industry research and growth report includes detailed analyses of the competitive landscape of the market and information about key companies, including:
- Adobe Inc.
- Amazon.com Inc.
- Apple Inc.
- Bloomberg LP
- Comcast Corp.
- Georg von Holtzbrinck GmbH
- Google LLC
- Graham Holdings Co.
- Guardian Media Group plc
- Hearst Communications Inc.
- Ingram Book Group LLC
- News Corp.
- Nine Entertainment Co.
- Penguin Random House LLC
- RELX Plc
- The New York Times Co.
- The Washington Post
- Thomson Reuters Corp.
Qualitative and quantitative analysis of companies has been conducted to help clients understand the wider business environment as well as the strengths and weaknesses of key industry players. Data is qualitatively analyzed to categorize companies as pure play, category-focused, industry-focused, and diversified; it is quantitatively analyzed to categorize companies as dominant, leading, strong, tentative, and weak.
Recent Development and News in Digital publishing market
- In August 2024, Adobe Inc. announced an update to its digital experience platform, integrating new generative AI features to help publishers automate content personalization and streamline cross-platform advertising.
- In November 2024, Amazon.com Inc. expanded its Kindle Direct Publishing service to include enhanced tools for creating interactive children's e-books with animated elements and read-aloud functionalities.
- In February 2025, Google LLC partnered with several major news organizations to launch a new initiative aimed at combating digital piracy through shared blockchain-based digital rights management technology.
- In May 2025, Apple Inc. revealed that its Apple News+ subscription service had achieved a 30% year-over-year growth in subscribers, driven by exclusive content deals and an improved user interface.
Dive into Technavio’s robust research methodology, blending expert interviews, extensive data synthesis, and validated models for unparalleled Digital Publishing Market insights. See full methodology.
| Market Scope | |
|---|---|
| Page number | 293 |
| Base year | 2025 |
| Historic period | 2020-2024 |
| Forecast period | 2026-2030 |
| Growth momentum & CAGR | Accelerate at a CAGR of 11.6% |
| Market growth 2026-2030 | USD 165544.5 million |
| Market structure | Fragmented |
| YoY growth 2025-2026(%) | 10.6% |
| Key countries | China, Japan, India, South Korea, Australia, Indonesia, US, Canada, Mexico, Germany, UK, France, Italy, Spain, The Netherlands, UAE, Saudi Arabia, South Africa, Israel, Egypt, Brazil, Argentina and Colombia |
| Competitive landscape | Leading Companies, Market Positioning of Companies, Competitive Strategies, and Industry Risks |
Research Analyst Overview
- The digital publishing market is defined by a strategic shift towards technology-driven content creation and distribution. At its core, the industry relies on sophisticated content management systems (CMS) and robust digital asset management (DAM) to handle the increasing volume of interactive multimedia elements.
- A primary boardroom-level decision revolves around selecting the right content monetization strategies, balancing subscription models with programmatic advertising and micropayments. The implementation of effective digital rights management (DRM) and advanced digital watermarking is crucial for protecting assets. Key trends include the adoption of mobile-first design, single-source publishing, and dynamic content delivery, which are essential for personalizing user experiences.
- Publishers are leveraging real-time analytics and personalization algorithms to refine audience segmentation and improve engagement. For instance, firms using AI-powered semantic search have reported a 15% improvement in content discoverability. Technologies like text-to-speech (TTS) and voice search optimization are opening new channels for consumption, while content aggregation platforms and syndication networks expand reach.
- The technical backbone involves everything from e-reader technology and push notifications to paywall technology and offline reading capabilities, all aimed at creating a seamless user journey.
What are the Key Data Covered in this Digital Publishing Market Research and Growth Report?
-
What is the expected growth of the Digital Publishing Market between 2026 and 2030?
-
USD 165.54 billion, at a CAGR of 11.6%
-
-
What segmentation does the market report cover?
-
The report is segmented by Product (Text content, Video content, and Audio content), Application (Smartphones, Laptops, and PCs), Component (Software, and Services) and Geography (APAC, North America, Europe, Middle East and Africa, South America)
-
-
Which regions are analyzed in the report?
-
APAC, North America, Europe, Middle East and Africa and South America
-
-
What are the key growth drivers and market challenges?
-
Rise in penetration of smartphones and easy access to internet, High subscription costs associated with digital publishing
-
-
Who are the major players in the Digital Publishing Market?
-
Adobe Inc., Amazon.com Inc., Apple Inc., Bloomberg LP, Comcast Corp., Georg von Holtzbrinck GmbH, Google LLC, Graham Holdings Co., Guardian Media Group plc, Hearst Communications Inc., Ingram Book Group LLC, News Corp., Nine Entertainment Co., Penguin Random House LLC, RELX Plc, The New York Times Co., The Washington Post and Thomson Reuters Corp.
-
Market Research Insights
- Market dynamics are increasingly shaped by data-driven editorial decisions and sophisticated content recommendation engines, which have improved user engagement rates by up to 35%. The focus on digital content distribution is pushing organizations to adopt robust digital archiving solutions and social reading platforms to build communities.
- Investments in authoring and editing tools that support multi-format content delivery are critical, as is the implementation of effective digital subscription management systems. For instance, platforms that master cross-device content synchronization report a 20% higher daily active user rate. Furthermore, adherence to content accessibility standards (WCAG) is becoming a competitive differentiator, expanding audience reach and ensuring compliance.
- As the industry evolves, the ability to leverage reader engagement metrics for strategic planning will define market leaders.
We can help! Our analysts can customize this digital publishing market research report to meet your requirements.
 RIA -
RIA - 
