Dried Food Market Size 2026-2030
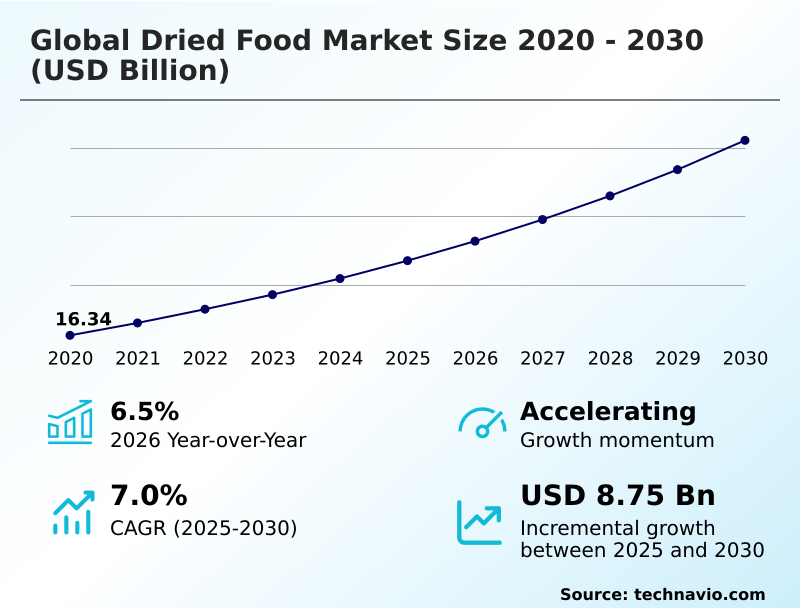
The dried food market size is valued to increase by USD 8.75 billion, at a CAGR of 7% from 2025 to 2030. Intensifying demand for convenience and on-the-go nutrition will drive the dried food market.
Major Market Trends & Insights
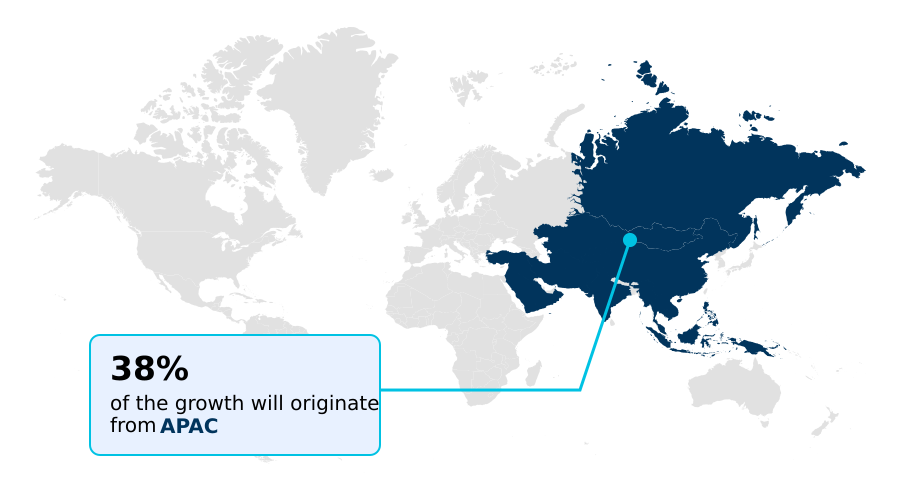
- APAC dominated the market and accounted for a 38.2% growth during the forecast period.
- By Product - Fruits segment was valued at USD 7.32 billion in 2024
- By Distribution Channel - Supermarkets and hypermarkets segment accounted for the largest market revenue share in 2024
Market Size & Forecast
- Market Opportunities: USD 14.18 billion
- Market Future Opportunities: USD 8.75 billion
- CAGR from 2025 to 2030 : 7%
Market Summary
- The dried food market is shaped by the convergence of consumer demand for convenience and heightened health awareness. Key drivers include the need for portable, on-the-go nutrition and the logistical benefits of shelf-stable products, which significantly aid in food waste mitigation.
- A primary trend is the premiumization of offerings, with a focus on organic certification, clean-label formulations, and innovative flavor profiles. This movement is pushing manufacturers to adopt advanced dehydration technology that better preserves nutrient density and sensory appeal.
- For instance, a food manufacturer can leverage freeze-drying processes to launch a new line of high-quality, ready-to-eat meal kits, optimizing their supply chain logistics by reducing the need for cold chain infrastructure. However, the industry faces challenges from the high capital investment required for such technologies and the persistent consumer preference for fresh alternatives.
- Success hinges on effectively communicating the value proposition of dried foods, which includes their convenience, long shelf life, and concentrated nutritional benefits, while navigating raw material volatility and evolving food safety regulations.
What will be the Size of the Dried Food Market during the forecast period?
Get Key Insights on Market Forecast (PDF) Request Free Sample
How is the Dried Food Market Segmented?
The dried food industry research report provides comprehensive data (region-wise segment analysis), with forecasts and estimates in "USD million" for the period 2026-2030, as well as historical data from 2020-2024 for the following segments.
- Product
- Fruits
- Vegetables
- Meat
- Poultry and seafood
- Distribution channel
- Supermarkets and hypermarkets
- Convenience stores
- Online
- Product type
- Conventional
- Organic
- Geography
- APAC
- China
- India
- Japan
- North America
- US
- Canada
- Mexico
- Europe
- Germany
- UK
- France
- Middle East and Africa
- Saudi Arabia
- UAE
- South Africa
- South America
- Brazil
- Argentina
- Rest of World (ROW)
- APAC
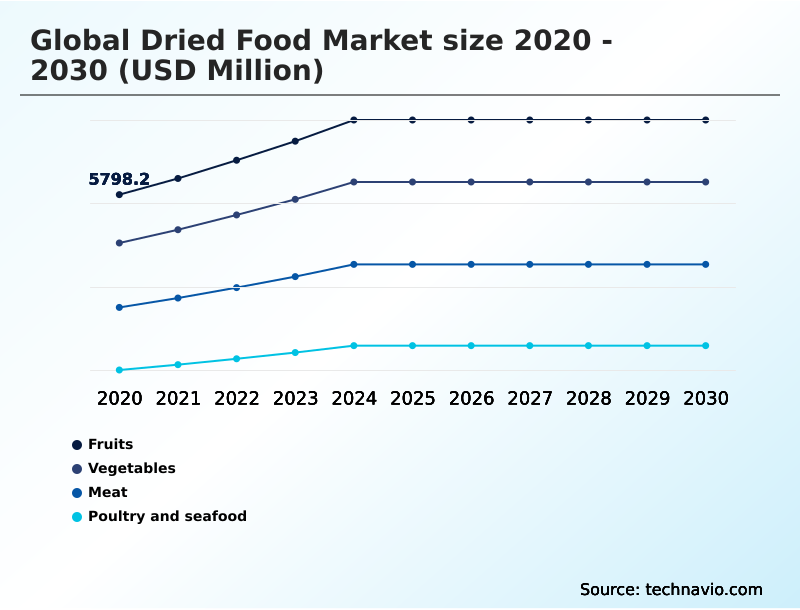
By Product Insights
The fruits segment is estimated to witness significant growth during the forecast period.
The fruits segment is driven by demand for healthy snacks and a clean label formulation. This category's growth hinges on product differentiation and flavor profile innovation.
Manufacturers are using dehydration technology to create nutrient-dense options, focusing on sensory appeal to compete with fresh alternatives. This premiumization strategy appeals to consumers seeking value-added products.
Adherence to organic certification standards has become crucial, with advanced drying techniques improving nutrient retention by over 15% compared to traditional methods.
The use of fortified dried food and ethnic flavor profiles is expanding, as companies leverage brand loyalty and on-the-go nutrition formats like single-serving packs to capture market share. These factors underscore the shift towards sophisticated, convenient food solutions.
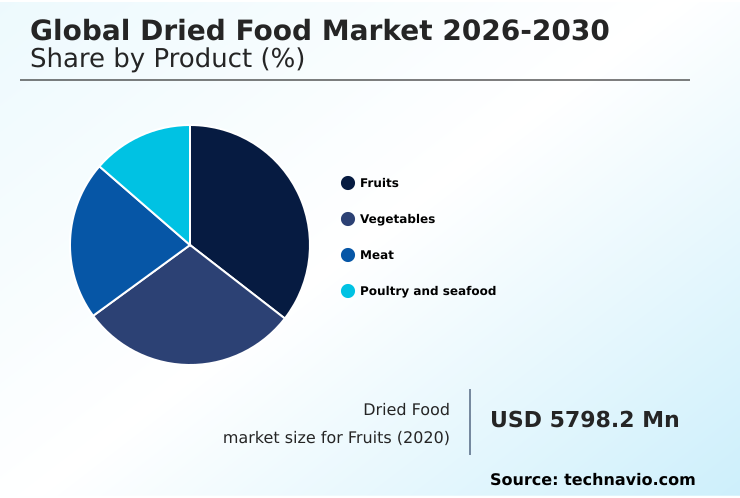
The Fruits segment was valued at USD 7.32 billion in 2024 and showed a gradual increase during the forecast period.
Regional Analysis
APAC is estimated to contribute 38.2% to the growth of the global market during the forecast period.Technavio’s analysts have elaborately explained the regional trends and drivers that shape the market during the forecast period.
See How Dried Food Market Demand is Rising in APAC Request Free Sample
The geographic landscape is led by APAC, which accounts for 38.2% of incremental growth, driven by demand for convenience food solutions and ready-to-eat meal kits. North America's market focuses on plant-based protein source items and snackification.
Europe’s market is diverse, emphasizing sustainable sourcing and food waste mitigation in its supply chain logistics. In the Middle East, shelf stability is key, with developments in cold chain infrastructure reducing spoilage by up to 25%.
The rise of the direct-to-consumer model is changing retail, supported by digital marketing strategy and customer data analytics. This shift requires robust food traceability and ethical sourcing certification to build trust.
Market Dynamics
Our researchers analyzed the data with 2025 as the base year, along with the key drivers, trends, and challenges. A holistic analysis of drivers will help companies refine their marketing strategies to gain a competitive advantage.
- A comprehensive analysis of the global dried food market 2026-2030 requires examining the technical and strategic nuances that define its trajectory. The discussion around the impact of dehydration on vitamins is central to consumer education, directly countering the perception that processing diminishes nutritional value.
- Similarly, the freeze-drying vs air-drying quality debate influences capital expenditure decisions, as superior quality often justifies higher costs. A key operational focus is reducing energy costs in dehydration, which can account for a significant portion of production expenses. On the product front, clean label jerky formulation trends and advanced plant-based protein texturization methods are driving innovation.
- The market is not without its risks; supply chain risks for dried fruit and raw material price hedging strategies are critical boardroom topics. Overcoming negative consumer perception of dried vegetables and addressing the sensory gaps in dried food are ongoing marketing challenges. Furthermore, navigating food safety regulations globally and overcoming market entry barriers for dehydrators are essential for new players.
- The growth of the direct-to-consumer dried food business, fueled by effective e-commerce strategies for food brands and sustainable packaging for dried snacks, is reshaping the competitive landscape. Improving the rehydration properties of vegetables and the fortification of dried food products are key R&D goals.
- Meanwhile, the upcycling produce for dried ingredients and the role of dried foods in food security highlight the market's alignment with sustainability, while innovations in on-the-go nutrition and premiumization trends in dried foods cater to modern consumer demands. Firms adopting advanced planning have seen a 20% greater alignment with these evolving market dynamics compared to those using traditional forecasting.
What are the key market drivers leading to the rise in the adoption of Dried Food Industry?
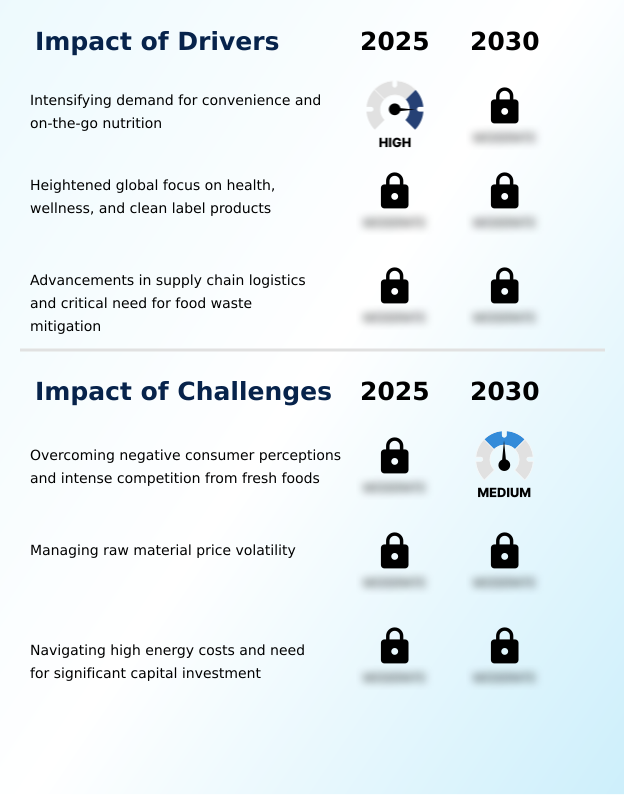
- The market's primary driver is the intensifying consumer demand for convenience and on-the-go nutritional solutions that align with modern, fast-paced lifestyles.
- Market drivers are centered on food preservation science, focusing on moisture content analysis and microbial growth inhibition for enhanced shelf stability. This helps manage raw material volatility linked to agricultural seasonality.
- Processes like osmotic dehydration and microwave-vacuum drying increase processing throughput by over 30%. Contract farming agreements and commodity price hedging further stabilize supply.
- The development of nutrient-enriched powder, ingredient upcycling, and a focus on ingredient traceability supports the clean label movement and a transparent supply chain.
- This has led to a 10% rise in repeat purchases for compliant brands, proving the value of capital investment in quality systems.
What are the market trends shaping the Dried Food Industry?
- A defining market trend is the accelerated innovation in product formulation, coupled with a distinct movement toward premium offerings.
- Key trends are changing consumer perception, with a focus on nutrient density and the adoption of texturized vegetable protein, reflecting broader market fragmentation. Innovation includes plant-based jerky and gourmet snacking options using vacuum-frying technology. This premiumization is supported by co-packing services for new value-added products.
- Packaging is also evolving, with sustainable packaging solutions and resealable pouches becoming standard, reducing material waste by up to 18%. The adoption of a subscription box model and e-commerce platform integration drives growth, with some brands seeing a 40% increase in customer retention through improved energy efficiency in logistics.
What challenges does the Dried Food Industry face during its growth?
- A key industry challenge is overcoming negative consumer perceptions of nutritional value and navigating intense competition from the fresh food sector.
- Key challenges include navigating stringent food safety regulations and the high capital investment for advanced dehydration technology like the freeze-drying process. The industry must address consumer perceptions related to rehydration ratio and water activity level, which impact brand loyalty. Adhering to front-of-pack labeling rules while communicating benefits requires effective brand narrative control.
- Companies are implementing robust HACCP systems, reducing compliance incidents by over 50%. Managing first-party data collection and customer data analytics without violating privacy is another hurdle. The cost of the freeze-drying process requires significant efficiencies, with some targeting a 20% reduction in cycle times, often through private label manufacturing contracts.
Exclusive Technavio Analysis on Customer Landscape
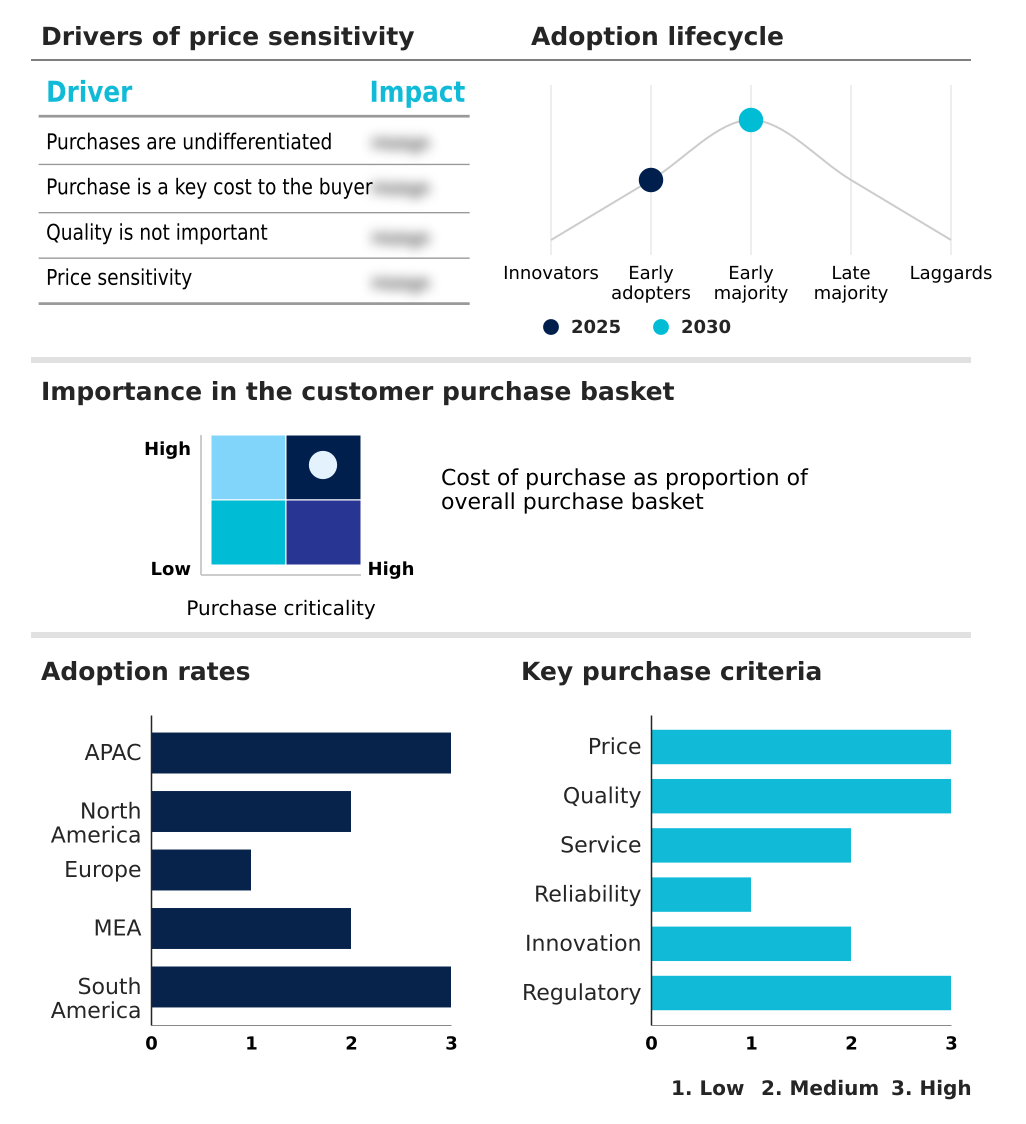
The dried food market forecasting report includes the adoption lifecycle of the market, covering from the innovator’s stage to the laggard’s stage. It focuses on adoption rates in different regions based on penetration. Furthermore, the dried food market report also includes key purchase criteria and drivers of price sensitivity to help companies evaluate and develop their market growth analysis strategies.
Customer Landscape of Dried Food Industry
Competitive Landscape
Companies are implementing various strategies, such as strategic alliances, dried food market forecast, partnerships, mergers and acquisitions, geographical expansion, and product/service launches, to enhance their presence in the industry.
Ajinomoto Co. Inc. - A provider of dehydrated food ingredients, focusing on flavor, nutrition, and functional properties for food manufacturing applications.
The industry research and growth report includes detailed analyses of the competitive landscape of the market and information about key companies, including:
- Ajinomoto Co. Inc.
- Asahi Group Holdings Ltd.
- B and G Foods Inc.
- Barilla G and R Fratelli SpA
- Bobs Red Mill Natural Foods
- Chaucer Foods Ltd.
- Conagra Brands Inc.
- European Freeze Dry
- General Mills Inc.
- Hormel Foods Corp.
- Kerry Group Plc
- Link Snacks Inc.
- McCormick and Co. Inc.
- Mercer Foods LLC
- Nestle SA
- Nissin Foods Holdings Co. Ltd.
- Ocean Spray Cranberries Inc.
- Saraf Foods Pvt. Ltd.
- The Kraft Heinz Co.
- Unilever PLC
Qualitative and quantitative analysis of companies has been conducted to help clients understand the wider business environment as well as the strengths and weaknesses of key industry players. Data is qualitatively analyzed to categorize companies as pure play, category-focused, industry-focused, and diversified; it is quantitatively analyzed to categorize companies as dominant, leading, strong, tentative, and weak.
Recent Development and News in Dried food market
- In February, 2025, Kraft Heinz initiated a major reformulation of its dehydrated and powdered product lines, targeting the removal of all artificial preservatives and synthetic additives to meet clean-label demands.
- In March, 2025, Nestle's European division responded to new EU sustainability labeling regulations by committing to source 100% of vegetables for its Maggi brand from regenerative agriculture farms by 2030.
- In April, 2025, Agthia Group PJSC, in partnership with the UAE Ministry of Climate Change and Environment, began construction on a large-scale, solar-powered food dehydration facility to process surplus local vegetables.
- In May, 2025, Olam International entered a joint venture with Indonesian super-app Gojek to integrate and distribute a new line of fortified dried food products via the GoFood and GoMart platforms.
Dive into Technavio’s robust research methodology, blending expert interviews, extensive data synthesis, and validated models for unparalleled Dried Food Market insights. See full methodology.
| Market Scope | |
|---|---|
| Page number | 335 |
| Base year | 2025 |
| Historic period | 2020-2024 |
| Forecast period | 2026-2030 |
| Growth momentum & CAGR | Accelerate at a CAGR of 7% |
| Market growth 2026-2030 | USD 8745.4 million |
| Market structure | Fragmented |
| YoY growth 2025-2026(%) | 6.5% |
| Key countries | China, India, Japan, South Korea, Australia, Indonesia, US, Canada, Mexico, Germany, UK, France, Italy, Spain, The Netherlands, Saudi Arabia, UAE, South Africa, Egypt, Turkey, Brazil, Argentina and Chile |
| Competitive landscape | Leading Companies, Market Positioning of Companies, Competitive Strategies, and Industry Risks |
Research Analyst Overview
- The dried food market's evolution is defined by a strategic pivot towards value-added products and enhanced operational efficiency. Boardroom decisions are increasingly shaped by the need for significant capital investment in advanced dehydration technology, such as the freeze-drying process, which improves nutrient density and sensory appeal.
- This focus on quality addresses consumer perception and strengthens brand loyalty through superior product differentiation. Adherence to stringent food safety regulations and achieving organic certification are no longer optional but essential for market access. Managing raw material volatility through a transparent supply chain and sustainable sourcing is critical for maintaining stable production.
- Firms that successfully integrate these elements, from controlling water activity level to optimizing rehydration ratio, are better positioned. For example, investment in systems that improve moisture content analysis has been shown to reduce batch rejection rates by up to 30%.
- The landscape is also characterized by market fragmentation and the rise of private label manufacturing, pushing brands to innovate in flavor profile and convenience food solutions to remain competitive.
What are the Key Data Covered in this Dried Food Market Research and Growth Report?
-
What is the expected growth of the Dried Food Market between 2026 and 2030?
-
USD 8.75 billion, at a CAGR of 7%
-
-
What segmentation does the market report cover?
-
The report is segmented by Product (Fruits, Vegetables, Meat, and Poultry and seafood), Distribution Channel (Supermarkets and hypermarkets, Convenience stores, and Online), Product Type (Conventional, and Organic) and Geography (APAC, North America, Europe, Middle East and Africa, South America)
-
-
Which regions are analyzed in the report?
-
APAC, North America, Europe, Middle East and Africa and South America
-
-
What are the key growth drivers and market challenges?
-
Intensifying demand for convenience and on-the-go nutrition, Overcoming negative consumer perceptions and intense competition from fresh foods
-
-
Who are the major players in the Dried Food Market?
-
Ajinomoto Co. Inc., Asahi Group Holdings Ltd., B and G Foods Inc., Barilla G and R Fratelli SpA, Bobs Red Mill Natural Foods, Chaucer Foods Ltd., Conagra Brands Inc., European Freeze Dry, General Mills Inc., Hormel Foods Corp., Kerry Group Plc, Link Snacks Inc., McCormick and Co. Inc., Mercer Foods LLC, Nestle SA, Nissin Foods Holdings Co. Ltd., Ocean Spray Cranberries Inc., Saraf Foods Pvt. Ltd., The Kraft Heinz Co. and Unilever PLC
-
Market Research Insights
- Market dynamics are increasingly influenced by strategic shifts in distribution and product development. The integration of e-commerce platforms and the adoption of a direct-to-consumer model, underpinned by sophisticated digital marketing strategy and first-party data collection, have allowed brands to gain greater brand narrative control. This shift improves customer retention by an average of 25% compared to traditional retail models.
- In product innovation, the focus on fortified dried food and nutrient-enriched powder is growing, especially within the gourmet snacking category. The development of plant-based jerky and ready-to-eat meal kits using advanced drying techniques has expanded offerings.
- Concurrently, the implementation of sustainable packaging solutions and resealable pouches has become a key differentiator, with some companies reporting a 15% reduction in packaging-related costs.
We can help! Our analysts can customize this dried food market research report to meet your requirements.