Drip Irrigation Systems Market Size 2025-2029
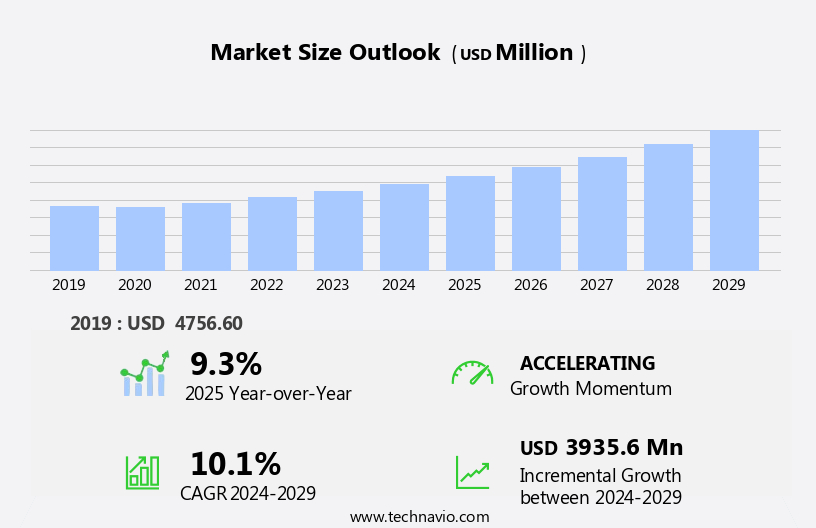
The drip irrigation systems market size is forecast to increase by USD 3.94 billion, at a CAGR of 10.1% between 2024 and 2029.
- The market is experiencing significant growth due to increasing government initiatives promoting sustainable agriculture practices. These initiatives prioritize water management and conservation and efficient use of resources, making drip irrigation systems an attractive solution for farmers. Furthermore, the rising demand for automated features in agriculture is driving the market forward, as drip irrigation systems offer precision and control over water usage. However, the high initial and maintenance costs of these systems pose a challenge for smaller-scale farmers and may hinder market penetration.
- Companies seeking to capitalize on market opportunities should focus on developing cost-effective solutions while maintaining the efficiency and automation features that appeal to farmers and support sustainable agricultural practices. Effective collaboration with governments and agricultural organizations can also help expand market reach and promote the adoption of drip irrigation systems.
What will be the Size of the Drip Irrigation Systems Market during the forecast period?
Explore in-depth regional segment analysis with market size data - historical 2019-2023 and forecasts 2025-2029 - in the full report.
Request Free Sample
The market continues to evolve, driven by the increasing demand for water conservation and precision agriculture. Project planning and irrigation management software play a crucial role in optimizing water usage and enhancing crop health. Smart irrigation solutions, such as soil moisture sensors, data acquisition systems, and weather stations, enable real-time monitoring and adjustment of irrigation schedules. PVC pipe and polypropylene pipe are commonly used for drip irrigation systems due to their durability and UV resistance. Drip tape and lateral lines ensure efficient nutrient delivery and water usage. Drought tolerance and variable rate irrigation technologies help farmers adapt to changing environmental conditions.
Irrigation efficiency is a key focus area, with flow rate control, pressure compensation, and water sensors ensuring optimal water usage. IoT integration and scheduling devices enable remote monitoring and automated irrigation. Backflow preventers and maintenance services ensure system reliability and longevity. Municipal water management and municipal water conservation techniques are also driving the market, with drip irrigation systems offering significant water savings. Environmental impact, water quality, and water recycling are becoming increasingly important considerations. Fertilizer application, pest control, and yield optimization are other key applications of drip irrigation systems. The market is expected to continue its dynamic growth, with ongoing innovation in areas such as self-cleaning emitters, energy consumption, and crop health monitoring.
How is this Drip Irrigation Systems Industry segmented?
The drip irrigation systems industry research report provides comprehensive data (region-wise segment analysis), with forecasts and estimates in "USD million" for the period 2025-2029, as well as historical data from 2019-2023 for the following segments.
- End-user
- Agriculture
- Others
- Type
- Inline
- Online
- Technology
- Automation technologies
- Smart watering controllers
- IoT-based systems
- Digital flow meters
- Crop Type
- Fruits and nuts
- Field crops
- Vegetable crops
- Others
- Geography
- North America
- US
- Canada
- Europe
- France
- Germany
- Italy
- UK
- APAC
- China
- India
- Japan
- South Korea
- Rest of World (ROW)
- North America
By End-user Insights
The agriculture segment is estimated to witness significant growth during the forecast period.
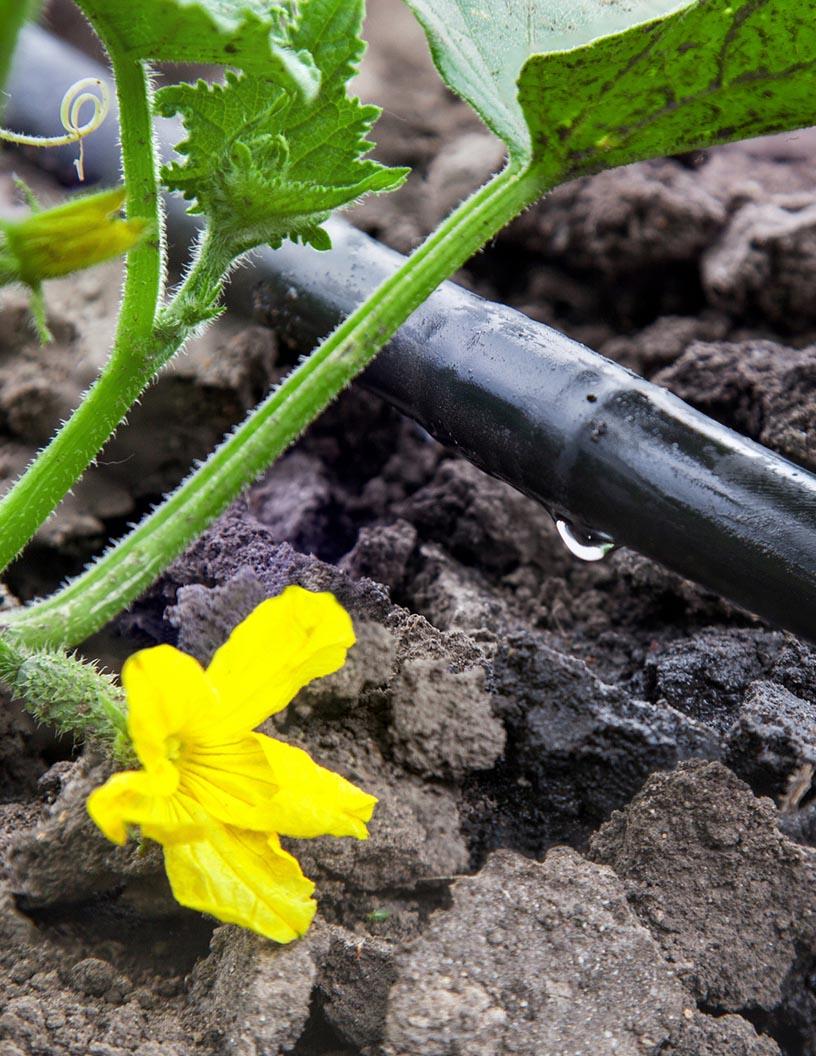
Irrigation systems play a vital role in modern agriculture as the global population's food demand continues to rise. Drip irrigation systems, in particular, have gained significant traction due to their precision and water conservation capabilities. These systems utilize small emitters in PVC or polypropylene tubing to deliver water directly to plant roots, reducing water loss through evaporation and runoff. Above-ground or subsurface installation options cater to various farming conditions. Drip irrigation's efficiency is a significant advantage, with field application efficiency surpassing that of sprinkler and surface irrigation systems. Energy consumption is minimized through UV-resistant tubing and self-cleaning emitters.
Soil moisture sensors, data acquisition systems, and weather stations enable remote monitoring and adjustments, optimizing crop health and yield. Nutrient injection and pest control are facilitated through integrated fertilizer application and pest management systems. Water conservation techniques, such as rainwater harvesting and recycling, further enhance the environmental sustainability of drip irrigation. Maintenance services, including repair, replacement, and system design, ensure optimal system performance. Pressure compensation and flow rate control systems maintain consistent water supply, while backflow preventers protect against contamination. Municipal water management and irrigation scheduling software facilitate large-scale irrigation projects, integrating with IoT platforms for real-time monitoring and analysis.
Smart irrigation systems employ variable rate irrigation, irrigation efficiency, and pressure regulators to optimize water usage and reduce costs. Drought tolerance and surface drip irrigation systems expand the application scope, catering to diverse agricultural needs.
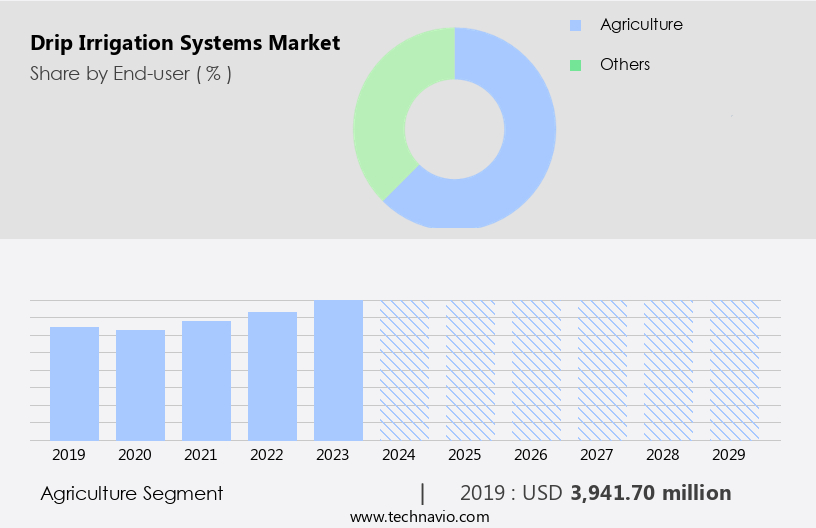
The Agriculture segment was valued at USD 3.94 billion in 2019 and showed a gradual increase during the forecast period.
Regional Analysis
APAC is estimated to contribute 38% to the growth of the global market during the forecast period. Technavio's analysts have elaborately explained the regional trends and drivers that shape the market during the forecast period.
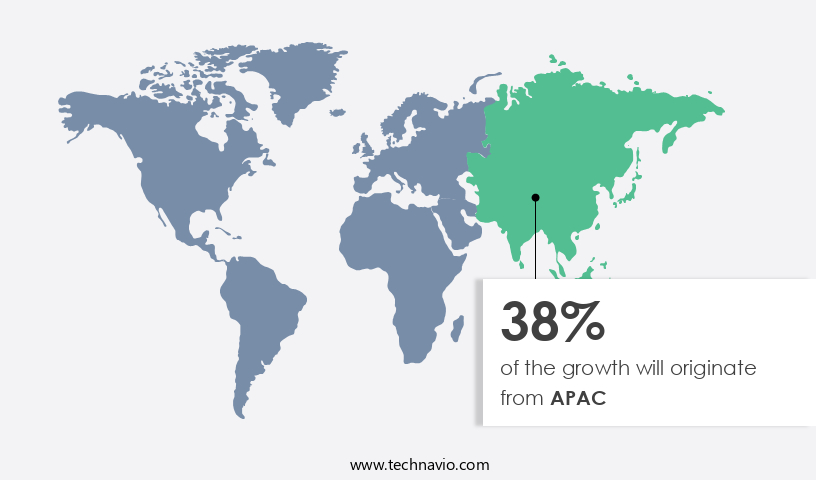
In the agricultural sector across APAC, particularly in countries like China and India with expansive farmlands, governments are collaborating to develop drip irrigation systems. For instance, the Government of India and the Japan International Cooperation Agency (JICA) signed a loan agreement in May 2023, worth 128 million Japanese Official Development Assistance, for the Rajasthan Water Sector Livelihood Improvement Project (II). This project aims to enhance water usage and agricultural productivity, thereby improving farmers' livelihoods and promoting gender equality in the irrigation and agriculture sectors in Rajasthan. Governments in the region are encouraging end-users to invest in precision irrigation systems, such as drip irrigation, to conserve water and increase crop health.
Drip irrigation systems, including PVC and polypropylene pipes, self-cleaning emitters, and solenoid valves, enable efficient water usage and nutrient application. Weather stations, soil moisture sensors, and rainfall sensors facilitate data acquisition and flow rate control for optimal crop health monitoring. Environmental impact is a significant concern, and water recycling, water quality management, and pest control are essential aspects of drip irrigation systems. Maintenance services, repair, and replacement of components, such as backflow preventers and pressure regulators, are crucial for system longevity. Irrigation scheduling software and smart irrigation systems, integrated with IoT, enable efficient irrigation management and yield optimization. Subsurface drip irrigation and surface drip irrigation systems cater to various agricultural needs, with pressure compensation and flow meters ensuring consistent water delivery.
Municipal water management and project planning are essential aspects of large-scale irrigation projects. Irrigation efficiency, drought tolerance, and variable rate irrigation are essential considerations for farmers and agricultural organizations. The drip irrigation market in APAC is evolving, with a focus on cost analysis, energy consumption, UV resistance, and weed control. The market is expected to grow, driven by the need for water conservation techniques and the adoption of advanced irrigation technologies.
Market Dynamics
Our researchers analyzed the data with 2024 as the base year, along with the key drivers, trends, and challenges. A holistic analysis of drivers will help companies refine their marketing strategies to gain a competitive advantage.
Drip irrigation systems have gained significant popularity in modern agriculture due to their water-efficient and cost-effective nature. These innovative systems utilize drip tubing or piping to deliver water and nutrients directly to plant roots, reducing water waste and promoting healthier growth. The market trends include the use of micro-irrigation technology, pressure-compensating emitters, and subsurface drip irrigation. Farmers increasingly prefer these systems for their precision, flexibility, and ability to save water in arid regions. Drip irrigation systems also offer environmental benefits, such as reduced leaching of fertilizers and pesticides, making them an eco-friendly choice. Additionally, the market for drip irrigation systems is driven by the growing demand for sustainable farming practices and the increasing global population's food requirements. Advanced technologies, such as solar-powered drip irrigation systems and smart irrigation controllers, further enhance the market's growth potential. Overall, the market is poised for continued expansion as farmers seek efficient, cost-effective, and sustainable solutions for irrigating their crops.
What are the key market drivers leading to the rise in the adoption of Drip Irrigation Systems Industry?
- The surge in government initiatives promoting sustainable agricultural practices serves as the primary catalyst for market growth in this sector.
- Drip irrigation systems are essential for sustainable agriculture, as they promote efficient water use and yield optimization. Governments worldwide encourage the adoption of these systems through various initiatives, including farm assistance loans. For instance, the USDA's Farm Service Agency (FSA) offers operating loans to farmers to purchase drip irrigation equipment. These loans help farmers maintain and strengthen their farms. Drip irrigation systems consist of scheduling devices, lateral lines, flow meters, and rainfall sensors. Regular maintenance services and repair are crucial to ensure the system's optimal performance. Additionally, water quality and water recycling are essential factors in the system's design.
- Pressure compensation and surface drip irrigation are essential features that enhance system efficiency. The market for drip irrigation systems is driven by the need for sustainable agriculture practices and the increasing focus on water conservation. The integration of technology, such as precision agriculture and IoT, further enhances system performance and efficiency. As the demand for food security and sustainable agriculture practices grows, the market for drip irrigation systems is expected to continue its growth trajectory.
What are the market trends shaping the Drip Irrigation Systems Industry?
- The increasing demand for automated features in drip irrigation systems is a notable market trend. This preference reflects the growing recognition of the benefits of precision watering and labor savings that automated systems provide.
- Drip irrigation systems have gained significant attention in the agricultural sector due to their efficiency and precision. Manufacturers are continuously innovating to enhance the features of these systems, with a focus on automation and water conservation. Integration of irrigation management software and IoT technology enables smart irrigation, allowing real-time monitoring and analysis of irrigation data. Drip tape, a key component of drip irrigation systems, is being developed with enhanced drought tolerance and variable rate irrigation capabilities. Pressure regulators ensure consistent water pressure, while irrigation scheduling software optimizes water usage based on plant requirements.
- Municipal water management entities also benefit from drip irrigation systems due to their water conservation properties. Overall, these advancements in drip irrigation systems contribute to improved irrigation efficiency and reduced water wastage.
What challenges does the Drip Irrigation Systems Industry face during its growth?
- The high initial and ongoing costs of drip irrigation systems represent a significant challenge to the industry's growth trajectory.
- Drip irrigation systems offer precision irrigation, enabling water and nutrient delivery directly to plant roots. However, their adoption is influenced by cost. The initial investment for drip irrigation systems is higher than traditional irrigation methods, such as pivot irrigation, which costs between USD800 to USD1,200 per hectare. Drip irrigation systems, on the other hand, can cost 20% to 100% more, with additional expenses for components like PVC pipe, soil moisture sensors, data acquisition systems, weather stations, energy consumption monitoring, and nutrient injection. Furthermore, the maintenance cost of drip irrigation systems is around 7% to 10% of the initial investment, compared to 1% to 2% for pivot systems.
- The high number of emitters in drip irrigation systems necessitates more frequent management. To mitigate these costs, consider the long-term benefits, such as water savings, energy efficiency, and increased crop yields. Additionally, advancements in technology, including remote monitoring, self-cleaning emitters, and UV resistance, contribute to a better return on investment. Installation services can also help offset the initial investment. By carefully analyzing the costs and benefits, businesses can make informed decisions about implementing drip irrigation systems.
Exclusive Customer Landscape
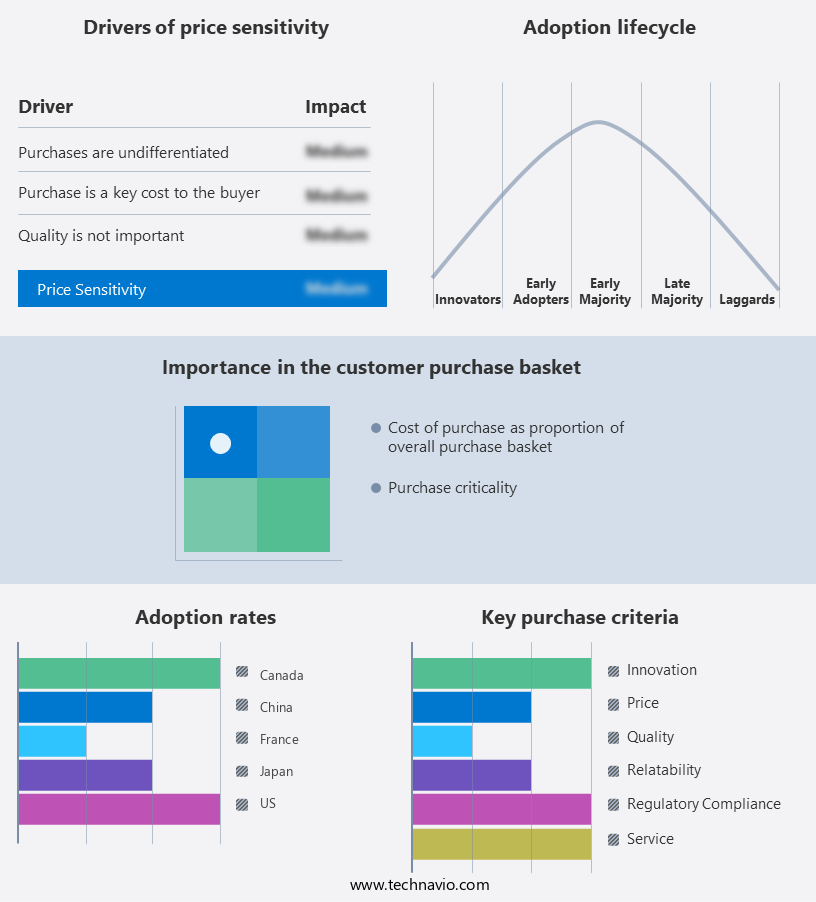
The drip irrigation systems market forecasting report includes the adoption lifecycle of the market, covering from the innovator's stage to the laggard's stage. It focuses on adoption rates in different regions based on penetration. Furthermore, the drip irrigation systems market report also includes key purchase criteria and drivers of price sensitivity to help companies evaluate and develop their market growth analysis strategies.
Customer Landscape
Key Companies & Market Insights
Companies are implementing various strategies, such as strategic alliances, drip irrigation systems market forecast, partnerships, mergers and acquisitions, geographical expansion, and product/service launches, to enhance their presence in the industry.
AGRODRIP S.A. - The company specializes in advanced irrigation solutions, providing innovative systems such as Bluetooth battery-operated 410BT irrigation controllers, energy-efficient driplines, and LEIT ambient light-powered irrigation controllers.
The industry research and growth report includes detailed analyses of the competitive landscape of the market and information about key companies, including:
- AGRODRIP S.A.
- Astha Polymers Pvt. Ltd.
- BC Hardscapes, LLC
- DIG Corp.
- DripWorks Inc.
- Golden Key Middle East FZE
- Hunter Industries Inc.
- Husqvarna AB
- Irritec SpA
- Jain Irrigation Systems Ltd.
- KSNM DRIP
- Lindsay Corp.
- Mahindra and Mahindra Ltd.
- Nelson Irrigation Corp.
- Netafim Ltd.
- NORMA Group SE
- Rain Bird Corp.
- Rivulis Irrigation Ltd.
- The Toro Co.
- Valmont Industries Inc.
Qualitative and quantitative analysis of companies has been conducted to help clients understand the wider business environment as well as the strengths and weaknesses of key industry players. Data is qualitatively analyzed to categorize companies as pure play, category-focused, industry-focused, and diversified; it is quantitatively analyzed to categorize companies as dominant, leading, strong, tentative, and weak.
Recent Development and News in Drip Irrigation Systems Market
- In January 2024, Netafim, a leading drip irrigation solutions provider, announced the launch of its new SmartFarm IoT platform, integrating real-time data analytics and precision agriculture technology into their drip irrigation systems (Netafim Press Release, 2024).
- In March 2024, Jain Irrigation Systems, a major player in the drip irrigation market, entered into a strategic partnership with Microsoft to digitally transform their irrigation operations using Microsoft Azure and AI technology (Microsoft News Center, 2024).
- In April 2024, Rain Bird Corporation, a prominent drip irrigation systems manufacturer, completed the acquisition of Hydro-Rain, a leading provider of irrigation controllers and weather-based irrigation management systems (Rain Bird Corporation Press Release, 2024).
- In May 2025, the Israeli Ministry of Agriculture and Rural Development announced a significant investment of USD 15 million in a research and development project to enhance the efficiency and sustainability of drip irrigation systems (Israeli Ministry of Agriculture and Rural Development Press Release, 2025).
Research Analyst Overview
- Drip irrigation systems have gained significant traction in modern agriculture due to their water-efficient and precise delivery methods. The market for these systems is dynamic, with several trends shaping its growth. One such trend is the integration of reporting tools and wireless sensors for real-time data collection and analysis. Pipeline design and component testing ensure regulatory compliance and system optimization. Turnkey solutions, maintenance protocols, and training programs facilitate easier implementation and management. Predictive analytics, water audit, and simulation software enable farmers to make informed decisions based on hydraulic calculations and soil composition analysis. Automated irrigation, quality control, and supply chain management ensure efficient operations.
- Leak detection, repair procedures, and warranty services minimize downtime and maintenance costs. Safety standards, data analytics, water chemistry, and precision agriculture are crucial aspects of drip irrigation systems. Failure analysis, mobile app control, smart irrigation controllers, root zone management, pressure drop calculations, installation best practices, and custom design services further enhance system performance. Agricultural technology, cloud-based monitoring, and system modeling are driving innovation and improving irrigation infrastructure.
Dive into Technavio's robust research methodology, blending expert interviews, extensive data synthesis, and validated models for unparalleled Drip Irrigation Systems Market insights. See full methodology.
|
Market Scope |
|
|
Report Coverage |
Details |
|
Page number |
241 |
|
Base year |
2024 |
|
Historic period |
2019-2023 |
|
Forecast period |
2025-2029 |
|
Growth momentum & CAGR |
Accelerate at a CAGR of 10.1% |
|
Market growth 2025-2029 |
USD 3935.6 million |
|
Market structure |
Fragmented |
|
YoY growth 2024-2025(%) |
9.3 |
|
Key countries |
US, China, Japan, Canada, India, UK, Germany, South Korea, Italy, and France |
|
Competitive landscape |
Leading Companies, Market Positioning of Companies, Competitive Strategies, and Industry Risks |
What are the Key Data Covered in this Drip Irrigation Systems Market Research and Growth Report?
- CAGR of the Drip Irrigation Systems industry during the forecast period
- Detailed information on factors that will drive the growth and forecasting between 2025 and 2029
- Precise estimation of the size of the market and its contribution of the industry in focus to the parent market
- Accurate predictions about upcoming growth and trends and changes in consumer behaviour
- Growth of the market across APAC, Europe, North America, South America, and Middle East and Africa
- Thorough analysis of the market's competitive landscape and detailed information about companies
- Comprehensive analysis of factors that will challenge the drip irrigation systems market growth of industry companies
We can help! Our analysts can customize this drip irrigation systems market research report to meet your requirements.
 RIA -
RIA - 
