
Electronic Waste Recycling Market Size 2026-2030
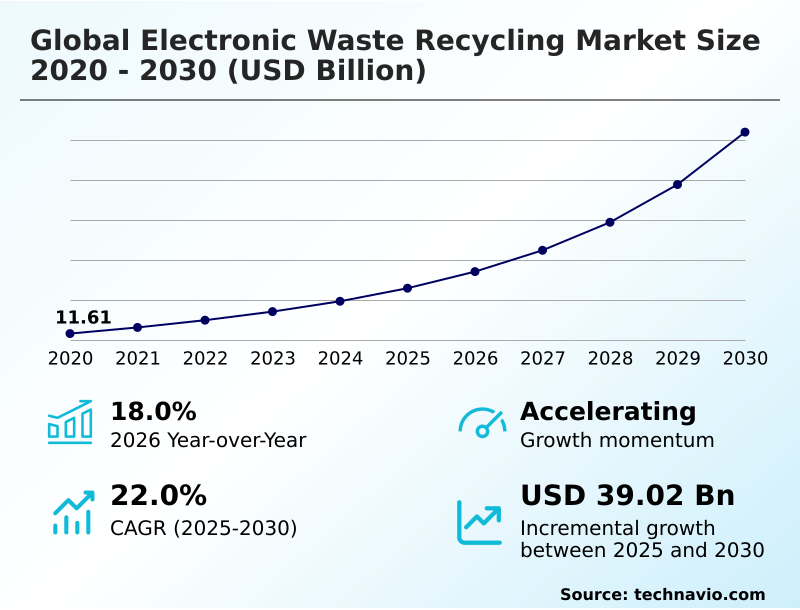
The electronic waste recycling market size is valued to increase by USD 39.02 billion, at a CAGR of 22% from 2025 to 2030. Favorable government regulations for e-waste management will drive the electronic waste recycling market.
Major Market Trends & Insights
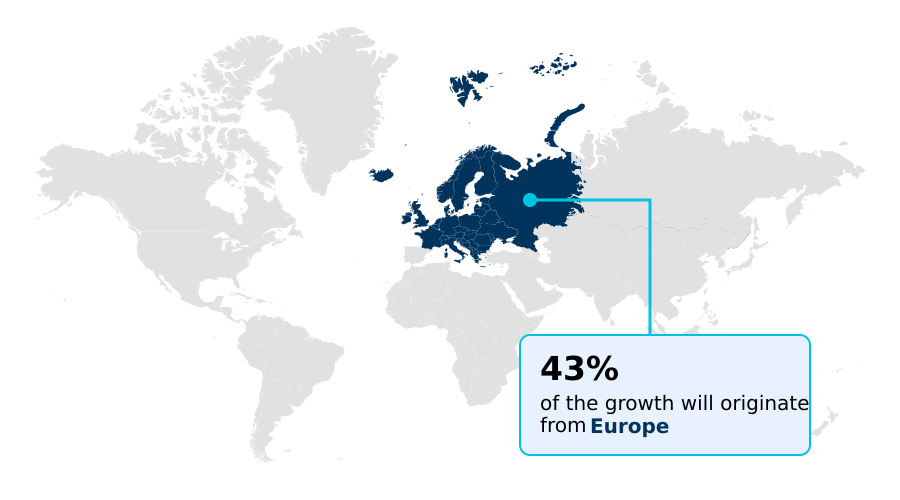
- Europe dominated the market and accounted for a 43% growth during the forecast period.
- By Material - Metals and chemicals segment was valued at USD 9.78 billion in 2024
- By Source - Household appliances segment accounted for the largest market revenue share in 2024
Market Size & Forecast
- Market Opportunities: USD 50.36 billion
- Market Future Opportunities: USD 39.02 billion
- CAGR from 2025 to 2030 : 22%
Market Summary
- The electronic waste recycling market is shaped by a confluence of regulatory pressures, technological advancements, and the growing imperative for a circular economy. Favorable government mandates, such as extended producer responsibility, are compelling manufacturers to design for recyclability and fund end-of-life management, creating a consistent feedstock for recyclers.
- This is complemented by a market trend toward industry consolidation, where mergers and acquisitions are creating integrated service providers with specialized capabilities in areas like lithium-ion battery recycling and precious metal recovery.
- For instance, a multinational corporation can implement a comprehensive IT asset disposition program that ensures secure data destruction while maximizing the recovery of valuable materials from decommissioned servers and networking equipment, thereby meeting compliance standards and corporate sustainability goals.
- However, the high capital cost of advanced sorting and refining technologies remains a significant hurdle, alongside the logistical complexity of managing disparate and often contaminated waste streams.
- The industry's evolution depends on balancing these economic challenges with the clear environmental and resource benefits of effective e-waste management, pushing innovation in both process efficiency and business models to unlock the full value of urban mining.
What will be the Size of the Electronic Waste Recycling Market during the forecast period?
Get Key Insights on Market Forecast (PDF) Get Free Sample
How is the Electronic Waste Recycling Market Segmented?
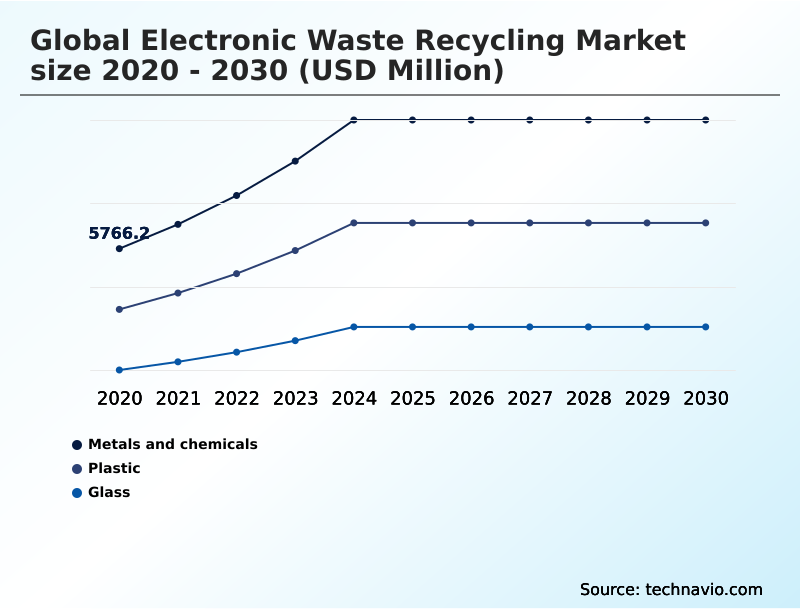
The electronic waste recycling industry research report provides comprehensive data (region-wise segment analysis), with forecasts and estimates in "USD million" for the period 2026-2030, as well as historical data from 2020-2024 for the following segments.
- Material
- Metals and chemicals
- Plastic
- Glass
- Source
- Household appliances
- Entertainment and consumer electronics
- IT and telecom
- Medical equipment
- Others
- Method
- Mechanical recycling
- Pyrolysis
- Others
- Geography
- Europe
- Germany
- France
- UK
- APAC
- China
- Japan
- India
- North America
- US
- Canada
- Mexico
- South America
- Brazil
- Argentina
- Middle East and Africa
- Saudi Arabia
- UAE
- South Africa
- Rest of World (ROW)
- Europe
By Material Insights
The metals and chemicals segment is estimated to witness significant growth during the forecast period.
The metals and chemicals segment is pivotal, concentrating on the high-value recovery of materials essential for modern hardware. This industrial field leverages advanced metallurgical techniques for the extraction of precious metals from complex electronic scrap.
The process involves sophisticated smelting and refining to separate elements and return them to manufacturing supply chains with high purity, with some facilities achieving over 95% recovery rates.
Innovative chemical leaching and precipitation methods are also enabling the extraction of rare earth elements, previously difficult to recycle.
As demand for sophisticated electronics grows, this segment drives profitability and technological advancement, ensuring valuable resources are kept in a continuous industrial loop.
Effective management of hazardous substances, including brominated flame retardants found on printed circuit boards, remains critical for producing high-quality secondary raw materials and non-ferrous metals.
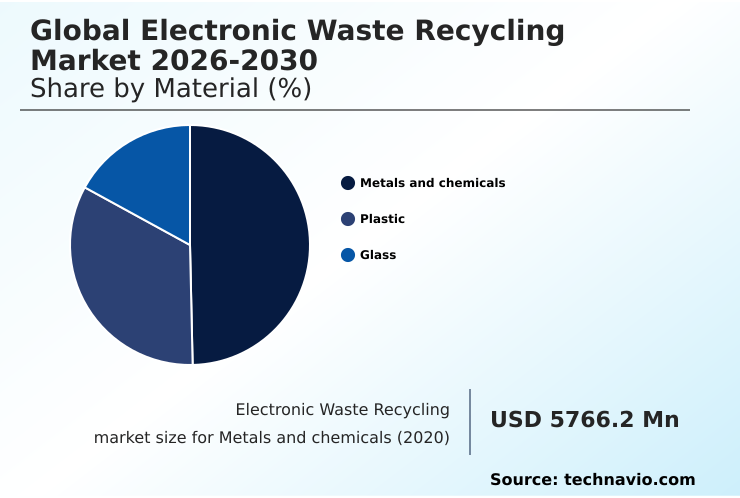
The Metals and chemicals segment was valued at USD 9.78 billion in 2024 and showed a gradual increase during the forecast period.
Regional Analysis
Europe is estimated to contribute 43% to the growth of the global market during the forecast period.Technavio’s analysts have elaborately explained the regional trends and drivers that shape the market during the forecast period.
See How Electronic Waste Recycling Market Demand is Rising in Europe Get Free Sample
The geographic landscape of the market is diverse, with Europe poised to capture over 42% of the incremental growth, driven by stringent regulations and a mature infrastructure.
The region’s market is set to expand at a rate of 22.4%, slightly outpacing North America at 21.2%. In North America, the focus is on secure data destruction and the management of decommissioned equipment from large-scale enterprise operations.
APAC follows as a significant region, projected to contribute nearly 30% of market expansion, fueled by its massive electronics manufacturing and consumption base. Across all regions, advanced techniques like hydrometallurgical processing are being adopted to improve resource recovery.
This enhances the extraction of rare earth elements and ensures high environmental compliance, turning waste streams into valuable resources like glass cullet and supporting new applications like photovoltaic panel recycling, making the urban mine a global reality.
Market Dynamics
Our researchers analyzed the data with 2025 as the base year, along with the key drivers, trends, and challenges. A holistic analysis of drivers will help companies refine their marketing strategies to gain a competitive advantage.
- Strategic approaches within the market are increasingly nuanced, focusing on specific high-value and high-risk segments. The emphasis on recovering precious metals from circuit boards continues to drive technological investment, as does developing more efficient recycling methods for lithium-ion batteries to support the electric vehicle and consumer electronics sectors.
- Simultaneously, managing hazardous materials in e-waste, such as lead and mercury, remains a critical compliance and safety concern, shaping operational protocols. Circular economy initiatives for electronics are transitioning from concept to practice, with major brands committing to using recycled content. However, the high cost of advanced e-waste recycling technologies presents a significant barrier, particularly for small and medium-sized enterprises.
- This financial strain is compounded by the occupational risks in e-waste management, which necessitate costly safety measures and automation. Firms that successfully navigate the complex regulations for transboundary e-waste movement and embrace the principles of extended producer responsibility are better positioned for growth.
- For example, implementing secure data destruction for IT assets can mitigate data breach risks far more effectively than simple hardware disposal, reducing potential compliance penalties by over 90%.
- Innovations in sensor-based sorting in e-waste and robotic dismantling technology are crucial for overcoming these hurdles, highlighting the benefits of urban mining from e-waste and addressing challenges in plastic e-waste recycling through methods like pyrolysis for mixed electronic waste. As the market matures, the ability to balance cost, compliance, and technological innovation will define leadership.
What are the key market drivers leading to the rise in the adoption of Electronic Waste Recycling Industry?
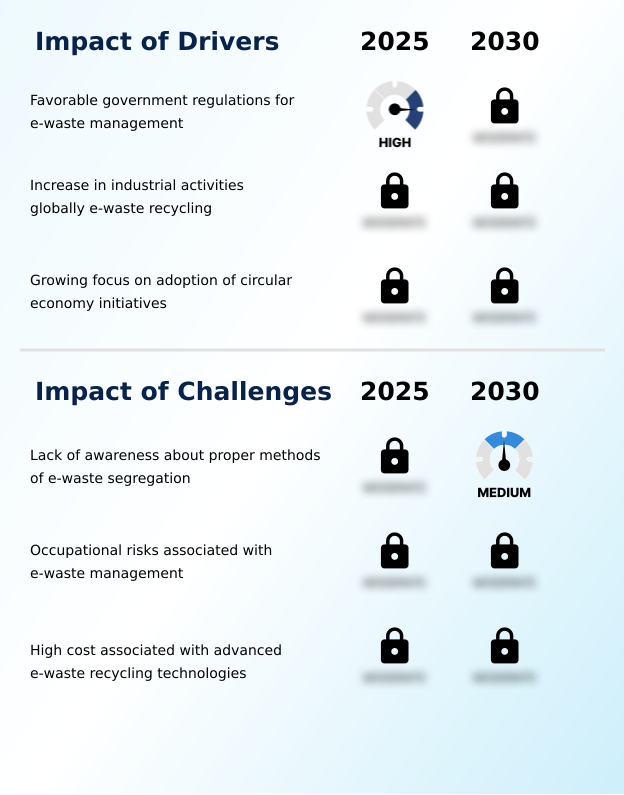
- Favorable government regulations for e-waste management serve as a key driver for market growth.
- Market expansion is primarily propelled by a combination of regulatory mandates and a strategic shift toward a circular economy.
- Favorable government policies, such as extended producer responsibility (EPR) and the WEEE directive, compel manufacturers to engage in product stewardship, which has boosted formal collection of end-of-life electronics by over 25% in some jurisdictions.
- This creates a reliable feedstock for recycling operations. The growing focus on the circular economy and urban mining is transforming e-waste from a liability into a valuable resource, driving demand for secondary raw materials and improving material recovery.
- This, in turn, supports corporate sustainability goals, with some companies now sourcing up to 40% of their inputs from recycled content.
- Furthermore, the emphasis on secure IT asset disposition (ITAD) in the corporate sector provides a high-value, consistent waste stream, reinforcing the need for professional waste stream management.
What are the market trends shaping the Electronic Waste Recycling Industry?
- A notable upcoming trend is the increasing number of mergers and acquisitions. This consolidation is driven by market companies seeking to expand their capabilities and market presence.
- Key market trends are reshaping the operational landscape, driven by a push for greater efficiency and scale. Industry consolidation through mergers and acquisitions is creating integrated service providers capable of managing the entire lifecycle of electronic assets, from collection to final refining, improving logistical efficiency by up to 20%.
- This is complemented by the significant expansion of processing plants, which are incorporating advanced technologies like robotic sorting and sensor-based sorting for more precise material separation. These new facilities are improving recovery rates for materials from shredded electronics by over 15%.
- A growing emphasis on closed-loop recycling is also evident, with manufacturers and recyclers collaborating on take-back programs and robust e-waste collection networks to ensure a consistent supply of materials for dismantling and reuse. This trend is further supported by the increasing adoption of specialized lines for high-growth segments like lithium-ion battery recycling.
What challenges does the Electronic Waste Recycling Industry face during its growth?
- A key challenge affecting industry growth is the lack of awareness regarding proper methods for e-waste segregation.
- Significant challenges constrain market growth, primarily related to cost, awareness, and operational complexity. The high capital investment required for advanced technologies, such as automated pyrolysis or pyrometallurgical processes, creates a substantial barrier to entry, with costs sometimes exceeding initial ROI projections by 50% in the first three years.
- A persistent lack of public awareness regarding proper e-waste segregation leads to contaminated waste streams, which can increase processing costs for recyclers by up to 35%. Furthermore, managing the diverse range of materials, from legacy cathode ray tubes to modern flat panel displays, requires specialized and often costly hazardous waste management protocols for substances like lead and mercury.
- Volatile commodity prices for recovered metals add another layer of economic uncertainty. Emerging techniques like bioleaching and electrochemical recycling offer potential long-term solutions but are not yet commercially viable at scale.
Exclusive Technavio Analysis on Customer Landscape
The electronic waste recycling market forecasting report includes the adoption lifecycle of the market, covering from the innovator’s stage to the laggard’s stage. It focuses on adoption rates in different regions based on penetration. Furthermore, the electronic waste recycling market report also includes key purchase criteria and drivers of price sensitivity to help companies evaluate and develop their market growth analysis strategies.

Customer Landscape of Electronic Waste Recycling Industry
Competitive Landscape
Companies are implementing various strategies, such as strategic alliances, electronic waste recycling market forecast, partnerships, mergers and acquisitions, geographical expansion, and product/service launches, to enhance their presence in the industry.
All Green Recycling - Advanced metallurgical recycling processes are utilized to process electronic scrap and industrial residues, enabling the recovery of copper and other precious metals.
The industry research and growth report includes detailed analyses of the competitive landscape of the market and information about key companies, including:
- All Green Recycling
- Apto Solutions Inc.
- Aurubis AG
- Boliden Group
- Clean Harbors Inc.
- Dynamic Lifecycle Innovations
- ecoATM LLC.
- Electronic Recyclers Inc.
- Enviro Hub Holdings Ltd.
- Glencore Plc
- Iron Mountain Inc.
- Kuusakoski Oy
- Quantum Lifecycle Partners LP
- Sims Lifecycle Services Inc.
- Sipi Asset Recovery
- Stena Recycling AB
- TES Singapore Pte Ltd.
- Umicore SA
- Veolia Environment SA
- Waste Management Inc.
Qualitative and quantitative analysis of companies has been conducted to help clients understand the wider business environment as well as the strengths and weaknesses of key industry players. Data is qualitatively analyzed to categorize companies as pure play, category-focused, industry-focused, and diversified; it is quantitatively analyzed to categorize companies as dominant, leading, strong, tentative, and weak.
Recent Development and News in Electronic waste recycling market
- In February, 2025, Umicore announced the successful completion of its expanded precious metals refining facility designed to process complex e-waste streams with higher efficiency, thereby increasing the recovery rates of critical minerals.
- In January, 2025, Iron Mountain expanded its specialized IT asset disposition services with a new high-tech processing center dedicated to the secure destruction and recycling of enterprise-grade hardware, integrating advanced data wiping and shredding.
- In March, 2025, Philips launched an updated version of its circular healthcare program, which includes the global take-back and refurbishment or recycling of its high-end medical imaging equipment to promote a circular economy.
- In May, 2025, Enviro-Hub Holdings finalized a major industrial e-waste management contract to provide specialized recycling services for a large-scale manufacturing hub, involving the processing of decommissioned industrial automation systems.
Dive into Technavio’s robust research methodology, blending expert interviews, extensive data synthesis, and validated models for unparalleled Electronic Waste Recycling Market insights. See full methodology.
| Market Scope | |
|---|---|
| Page number | 306 |
| Base year | 2025 |
| Historic period | 2020-2024 |
| Forecast period | 2026-2030 |
| Growth momentum & CAGR | Accelerate at a CAGR of 22% |
| Market growth 2026-2030 | USD 39018.9 million |
| Market structure | Fragmented |
| YoY growth 2025-2026(%) | 18.0% |
| Key countries | Germany, France, UK, Italy, Spain, The Netherlands, China, Japan, India, South Korea, Australia, Indonesia, US, Canada, Mexico, Brazil, Argentina, Chile, Saudi Arabia, UAE, South Africa, Israel and Turkey |
| Competitive landscape | Leading Companies, Market Positioning of Companies, Competitive Strategies, and Industry Risks |
Research Analyst Overview
- The electronic waste recycling market is defined by its critical role in the circular economy and its complex operational landscape. At a strategic level, boardroom decisions are increasingly influenced by the need for robust IT asset disposition (ITAD) protocols and secure data destruction to mitigate corporate risk. The industry's evolution is marked by a clear shift toward sophisticated technological solutions.
- Advanced processes such as hydrometallurgical processing, pyrometallurgical processes, and emerging methods like bioleaching and electrochemical recycling are becoming essential for maximizing material recovery. Core activities like shredding, dismantling, and smelting are being enhanced by automated technologies, including robotic sorting and sensor-based sorting, which improve efficiency and safety.
- For instance, firms adopting robotic dismantling have reported a 30% increase in processing throughput. The focus extends to specialized areas like lithium-ion battery recycling and photovoltaic panel recycling, driven by the energy transition. This requires precise refining techniques, including leaching and precipitation, to achieve high-purity outputs.
- Ultimately, effective hazardous waste management and resource recovery are central to turning end-of-life products into a viable form of urban mining, which is crucial for sustainable supply chains.
What are the Key Data Covered in this Electronic Waste Recycling Market Research and Growth Report?
-
What is the expected growth of the Electronic Waste Recycling Market between 2026 and 2030?
-
USD 39.02 billion, at a CAGR of 22%
-
-
What segmentation does the market report cover?
-
The report is segmented by Material (Metals and chemicals, Plastic, and Glass), Source (Household appliances, Entertainment and consumer electronics, IT and telecom, Medical equipment, and Others), Method (Mechanical recycling, Pyrolysis, and Others) and Geography (Europe, APAC, North America, South America, Middle East and Africa)
-
-
Which regions are analyzed in the report?
-
Europe, APAC, North America, South America and Middle East and Africa
-
-
What are the key growth drivers and market challenges?
-
Favorable government regulations for e-waste management, Lack of awareness about proper methods of e-waste segregation
-
-
Who are the major players in the Electronic Waste Recycling Market?
-
All Green Recycling, Apto Solutions Inc., Aurubis AG, Boliden Group, Clean Harbors Inc., Dynamic Lifecycle Innovations, ecoATM LLC., Electronic Recyclers Inc., Enviro Hub Holdings Ltd., Glencore Plc, Iron Mountain Inc., Kuusakoski Oy, Quantum Lifecycle Partners LP, Sims Lifecycle Services Inc., Sipi Asset Recovery, Stena Recycling AB, TES Singapore Pte Ltd., Umicore SA, Veolia Environment SA and Waste Management Inc.
-
Market Research Insights
- The market is evolving through a focus on comprehensive product stewardship and sophisticated waste stream management for all end-of-life electronics. Efficient e-waste collection networks, often part of manufacturer take-back programs, are crucial for securing a consistent feedstock for recycling.
- Certified recycling facilities are essential for handling items from decommissioned equipment to obsolete cathode ray tubes and modern flat panel displays, ensuring environmental compliance. These facilities manage complex materials, including those with brominated flame retardants and require specialized refrigerant recovery, with some achieving a 35% improvement in processing efficiency.
- A shift toward a closed-loop recycling model is supported by policies like the WEEE directive, which has increased formal collection rates by over 20%. This supports stable commodity prices for recovered metals, including rare earth elements, making the urban mine a viable resource.
We can help! Our analysts can customize this electronic waste recycling market research report to meet your requirements.
 RIA -
RIA - 
