
Epharmacy Market Size 2026-2030
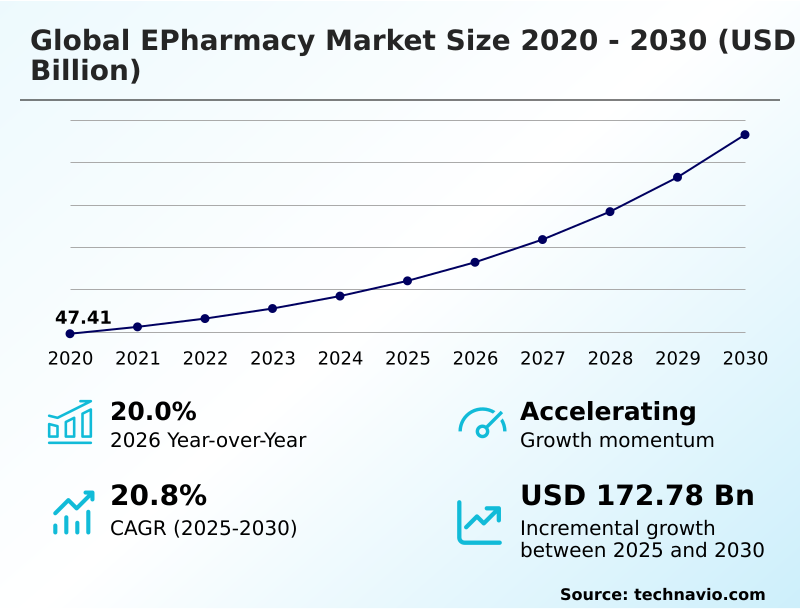
The epharmacy market size is valued to increase by USD 172.78 billion, at a CAGR of 20.8% from 2025 to 2030. Rising prevalence of chronic diseases and aging global demographics will drive the epharmacy market.
Major Market Trends & Insights
- North America dominated the market and accounted for a 41.4% growth during the forecast period.
- By Product Type - Medications segment was valued at USD 70.06 billion in 2024
- By Drug Class - Prescription drugs segment accounted for the largest market revenue share in 2024
Market Size & Forecast
- Market Opportunities: USD 235.28 billion
- Market Future Opportunities: USD 172.78 billion
- CAGR from 2025 to 2030 : 20.8%
Market Summary
- The Epharmacy market is experiencing a profound structural transformation characterized by the convergence of mobile health applications, robust digital payment infrastructure, and sophisticated last mile logistics infrastructure. This dynamic evolution is fundamentally driven by the escalating burden of long-term pathologies, which necessitates uninterrupted access to maintenance medications through automated adherence tracking and chronic disease subscription models.
- By integrating predictive inventory placement and automated micro fulfillment center operations, supply chain managers have successfully improved delivery route efficiency by 18%, significantly reducing transit delays for critical therapeutics.
- However, mitigating severe cybersecurity threats remains a formidable challenge, as the mandatory storage of sensitive electronic medical record integration data attracts sophisticated ransomware attacks, forcing platforms to invest heavily in decentralized cloud security. The contemporary patient journey increasingly begins within a virtual environment, embedding telehealth consultation integration seamlessly into the fulfillment pipeline.
- As regulatory frameworks continue to standardize digital prescription tokens, the interconnected health architecture will further optimize digital medicine distribution and reshape preventative health tracking protocols worldwide.
What will be the Size of the Epharmacy Market during the forecast period?
Get Key Insights on Market Forecast (PDF) Get Free Sample
How is the Epharmacy Market Segmented?
The epharmacy industry research report provides comprehensive data (region-wise segment analysis), with forecasts and estimates in "USD million" for the period 2026-2030, as well as historical data from 2020-2024 for the following segments.
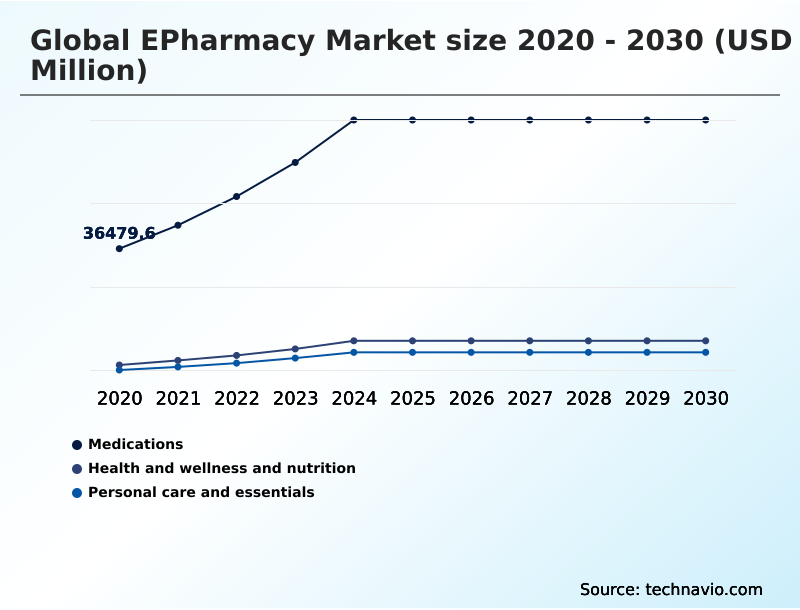
- Product type
- Medications
- Health and wellness and nutrition
- Personal care and essentials
- Drug class
- Prescription drugs
- Over-the-counter drugs
- Distribution channel
- Mobile applications
- Online platforms
- End-user
- Individuals
- Commercial
- Geography
- North America
- US
- Canada
- Mexico
- APAC
- China
- Japan
- India
- South Korea
- Australia
- Indonesia
- Europe
- Germany
- UK
- France
- Italy
- Spain
- The Netherlands
- South America
- Brazil
- Argentina
- Chile
- Middle East and Africa
- Saudi Arabia
- UAE
- South Africa
- Israel
- Turkey
- North America
By Product Type Insights
The medications segment is estimated to witness significant growth during the forecast period.
The medications segment represents a critical pillar in the evolving digital health architecture, operating through complex digital supply chains that require seamless electronic medical record integration and strict temperature controlled logistics.
This infrastructure supports both prescription therapies and non-prescription treatments by synchronizing automated inventory management systems with secure electronic health record databases. The processing mechanism utilizes predictive data analytics to cross-reference physician authorizations against insurance profiles instantly.
For businesses, this technological alignment generates substantial operational advantages; for instance, the implementation of biometric prescription verification has improved order processing efficiency by 22% across integrated pharmacy benefit management platforms.
By eliminating traditional administrative bottlenecks, organizations optimize last mile logistics infrastructure and enhance automated adherence tracking, ensuring rapid distribution of life-saving therapeutics while maintaining absolute regulatory compliance.
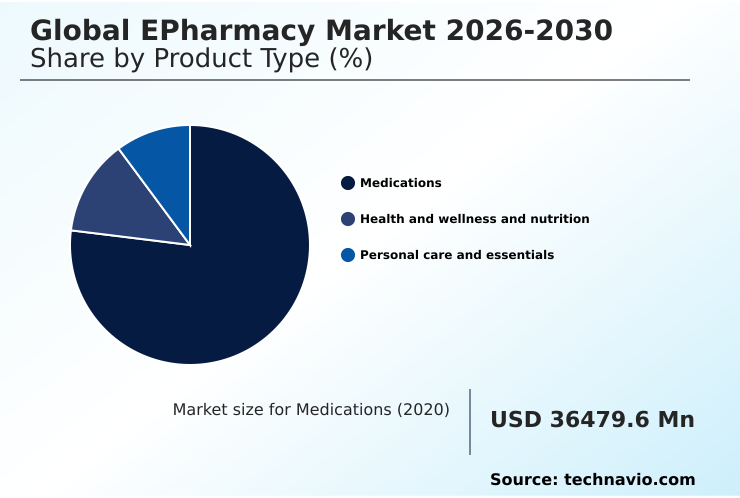
The Medications segment was valued at USD 70.06 billion in 2024 and showed a gradual increase during the forecast period.
Regional Analysis
North America is estimated to contribute 41.4% to the growth of the global market during the forecast period.Technavio’s analysts have elaborately explained the regional trends and drivers that shape the market during the forecast period.
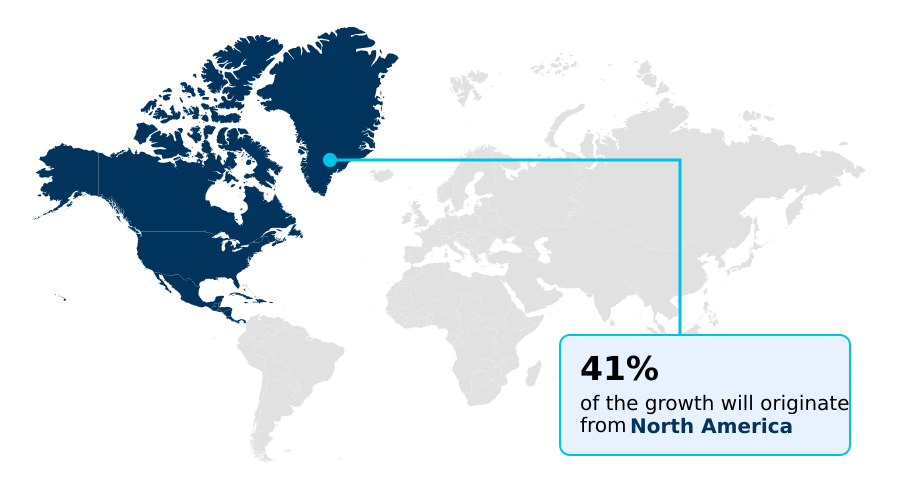
See How Epharmacy Market Demand is Rising in North America Get Free Sample
The geographic landscape of the Epharmacy sector reveals distinct evolutionary trajectories shaped by infrastructural maturity and regulatory frameworks.
North America demonstrates advanced digital health architecture and robust pharmacy benefit management networks, achieving a 28% higher adoption rate of automated multidose packaging compared to Europe.
This structural advantage allows North American operators to leverage predictive data analytics and optimize cold chain preservation for complex biologics.
Conversely, the European market is rapidly standardizing cross border electronic health protocols, leading to a 15% reduction in cross-border prescription validation errors.
APAC is experiencing aggressive expansion driven by mobile-first demographics and virtual physician consultation platforms, enabling localized quick-commerce logistics to decrease urban delivery latencies by 30%.
These regional disparities compel enterprises to adapt localized strategies, integrating secure digital payment systems and clinical grade dermatology supply chains to capture dynamic consumer demand efficiently.
Market Dynamics
Our researchers analyzed the data with 2025 as the base year, along with the key drivers, trends, and challenges. A holistic analysis of drivers will help companies refine their marketing strategies to gain a competitive advantage.
- The ongoing modernization of the Epharmacy space is heavily dependent on sophisticated back-end infrastructures that support seamless consumer experiences and rigorous clinical compliance. At the core of this transformation is the integration of an artificial intelligence driven digital health companion, which provides personalized proactive wellness guidance alongside symptom evaluation.
- To manage long-term therapies effectively, operators are implementing automated multidose packaging for chronic conditions, ensuring that elderly demographics maintain strict therapeutic adherence without administrative burden. This capability is fundamentally linked to an electronic prescription transfer and fulfillment system, which drastically reduces transcription errors compared to legacy paper-based workflows, improving verification accuracy by approximately 22%.
- Furthermore, the transportation of highly sensitive therapeutics requires robust last mile cold chain preservation logistics and specialized temperature controlled biological medication transit to maintain product efficacy across vast geographic corridors. Protecting this complex architecture necessitates decentralized cloud security for patient data, preventing unauthorized access during cross border electronic medical record integration.
- Operations are further optimized through a robotic micro fulfillment center sorting system, which accelerates dispatch timelines and supports the automated continuous chronic disease medication subscription model. By establishing an omnichannel digital pharmacy distribution network, providers can offer cloud connected clinical grade personal care dispensing and digital wellness and preventative health tracking effortlessly.
- The overarching regulatory integrity of these digital ecosystems relies on a real time biometric prescription verification system, machine learning automated drug interaction alert capabilities, and highly secure paperless electronic prescription token processing to safeguard both institutional transparency and patient well-being.
What are the key market drivers leading to the rise in the adoption of Epharmacy Industry?
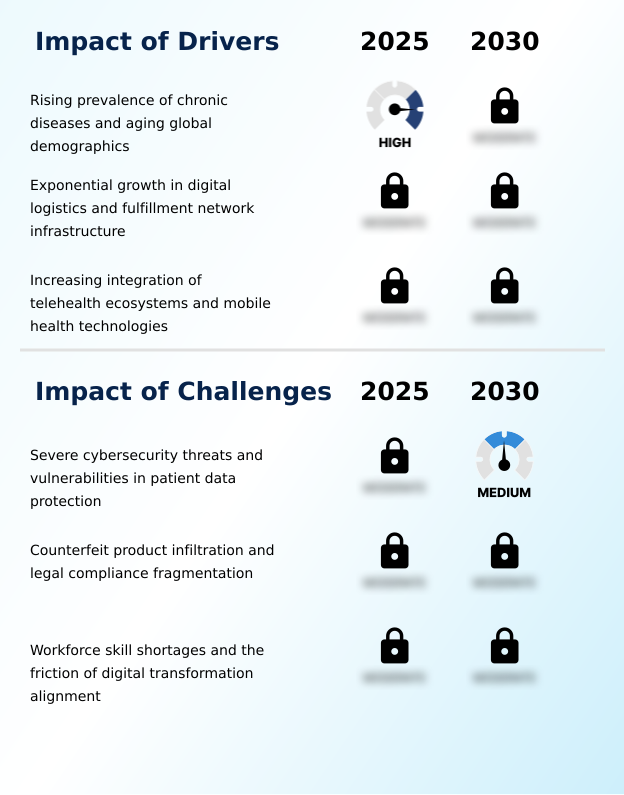
- The rising global prevalence of chronic diseases, coupled with rapidly aging demographics, serves as the primary structural driver propelling sustained market expansion.
- Escalating dependency on continuous maintenance medications for chronic conditions serves as a foundational catalyst propelling the expansion of the Epharmacy ecosystem.
- Aging demographics globally require uninterrupted access to therapeutic interventions, forcing a rapid shift toward automated multidose packaging and highly reliable chronic disease subscription frameworks. This fundamental change in consumer behavior mitigates the physical barriers associated with traditional retail dispensaries.
- By implementing electronic prescription validation and secure electronic health record networks, digital platforms significantly decrease administrative bottlenecks.
- Consequently, organizations utilizing predictive inventory placement and automated micro fulfillment center operations have enhanced their supply chain efficiency by 28%, significantly lowering logistical overhead.
- The integration of robust temperature controlled logistics ensures absolute clinical efficacy, driving deep institutional reliance on digitized medicine distribution networks.
What are the market trends shaping the Epharmacy Industry?
- The acceleration of artificial intelligence-driven personalization and the extensive integration of digital healthcare ecosystems represent a paramount market trend. This structural shift transforms digital platforms into comprehensive health companions capable of optimizing proactive patient care.
- The structural transition toward an artificial intelligence driven digital health companion is redefining the operational boundaries of the Epharmacy sector. Enterprises are aggressively deploying predictive data analytics and conversational artificial intelligence to synthesize complex historical purchasing behaviors into actionable preventative care insights. This technological evolution fundamentally alters consumer engagement, shifting reactive medicine procurement toward proactive digital wellness portals.
- By integrating sophisticated symptom analysis algorithms directly into mobile interfaces, platforms provide highly customized therapeutic recommendations, which improves cross-selling conversion efficiency by 25% over traditional generic interfaces. The seamless synchronization of telehealth consultation integration with a secure digital prescription token accelerates the transition from initial virtual triage to final fulfillment.
- Consequently, operators utilizing robotic fulfillment sorting and automated inventory management achieve unparalleled accuracy, optimizing continuous automated dosage tracking and ensuring a robust, hyper-personalized patient care ecosystem.
What challenges does the Epharmacy Industry face during its growth?
- Severe cybersecurity threats and inherent vulnerabilities in patient data protection frameworks constitute a critical operational challenge impeding optimal industry growth.
- Severe vulnerabilities surrounding patient data protection and decentralized cloud security present formidable structural challenges to the scalability of the Epharmacy infrastructure. Because digital distribution models require the continuous aggregation of highly sensitive electronic medical record integration data and financial profiles, they remain persistent targets for malicious cyber intrusions.
- A systemic breach not only jeopardizes corporate integrity but actively compromises critical automated adherence tracking and digital health architecture. Navigating this volatile threat landscape forces enterprises to adopt expensive real time threat hunting protocols and stringent biometric prescription verification systems.
- Consequently, the massive capital expenditure required to maintain a compliant drug authentication system and pharmacovigilance tracking protocol has increased infrastructural compliance costs by 34%, actively compressing profit margins and severely complicating cross-border expansion efforts for emerging digital health operators.
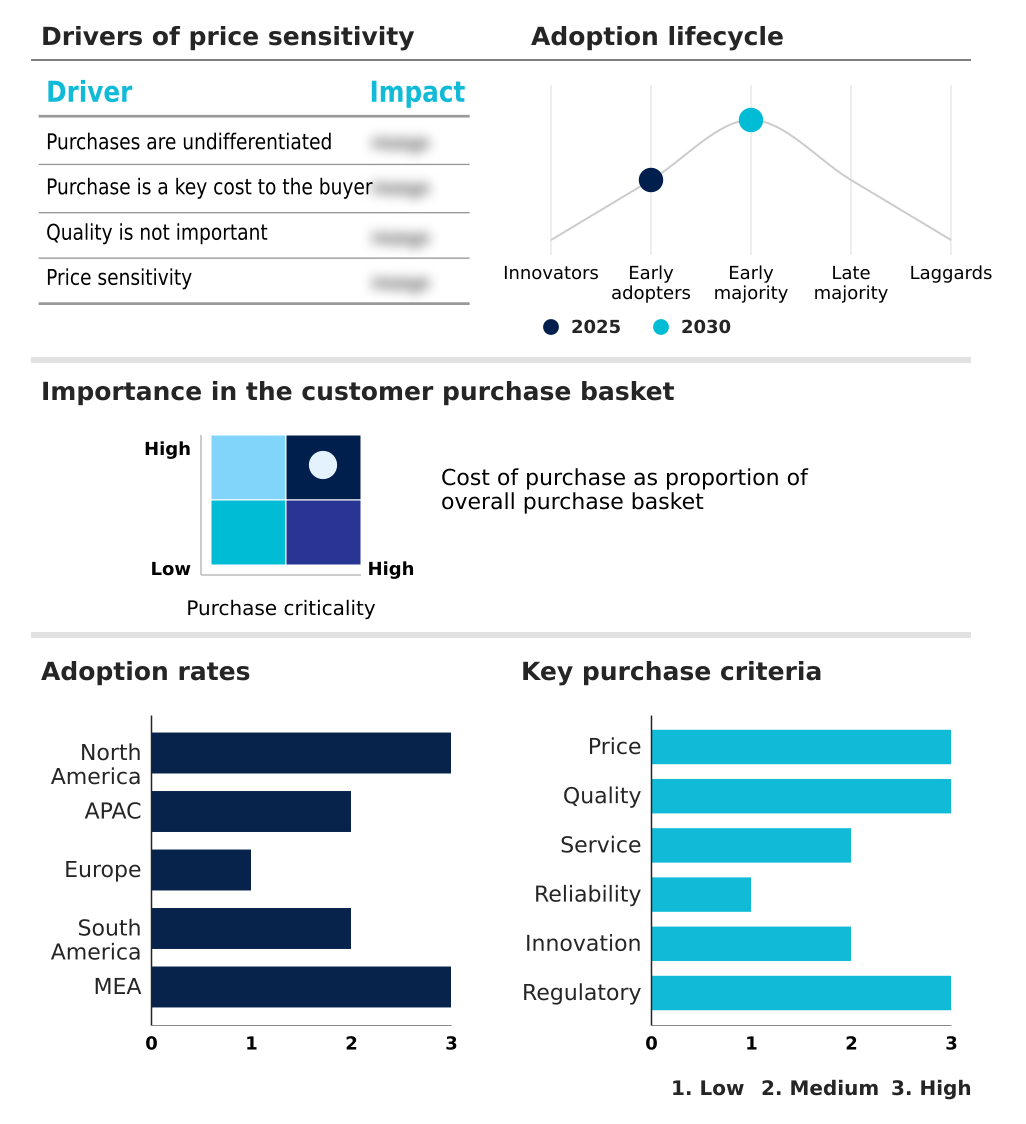
Exclusive Technavio Analysis on Customer Landscape
The epharmacy market forecasting report includes the adoption lifecycle of the market, covering from the innovator’s stage to the laggard’s stage. It focuses on adoption rates in different regions based on penetration. Furthermore, the epharmacy market report also includes key purchase criteria and drivers of price sensitivity to help companies evaluate and develop their market growth analysis strategies.
Customer Landscape of Epharmacy Industry
Competitive Landscape
Companies are implementing various strategies, such as strategic alliances, epharmacy market forecast, partnerships, mergers and acquisitions, geographical expansion, and product/service launches, to enhance their presence in the industry.
Alto Pharmacy LLC - The provider delivers comprehensive digital prescription fulfillment, integrating automated multidose packaging and telehealth consultation integration to ensure seamless medication management and secure, rapid home delivery logistics.
The industry research and growth report includes detailed analyses of the competitive landscape of the market and information about key companies, including:
- Alto Pharmacy LLC
- Amazon.com Inc.
- Apollo Pharmacies Ltd.
- Capsule Corp.
- Chemist Warehouse Group
- Clicks Group Ltd.
- CVS Health Corp.
- DocMorris AG
- ePharmacy Nepal
- ePharmacy Solutions
- Express Scripts Holding Co.
- Guardian Health and Beauty
- Medlife International Pvt Ltd.
- Netmeds.com
- NowRx
- Optum Inc.
- PharmEasy
- Redcare Pharmacy
- Tata 1mg
- Walgreens Boots Alliance Inc.
Qualitative and quantitative analysis of companies has been conducted to help clients understand the wider business environment as well as the strengths and weaknesses of key industry players. Data is qualitatively analyzed to categorize companies as pure play, category-focused, industry-focused, and diversified; it is quantitatively analyzed to categorize companies as dominant, leading, strong, tentative, and weak.
Recent Development and News in Epharmacy market
- In the Health Care Technology industry, the rapid deployment of decentralized cloud security and real time threat hunting architectures has fortified patient data protection, directly impacting Epharmacy demand by increasing consumer trust in paperless electronic prescription platforms.
- In the Health Care Technology industry, the integration of conversational artificial intelligence into mobile health applications has enabled sophisticated symptom analysis algorithms, significantly driving Epharmacy market adoption through highly personalized preventative care insights and automated dosage tracking.
- In the Health Care Technology industry, structural improvements in last mile logistics infrastructure and cold chain preservation techniques have enabled the secure transit of temperature-sensitive biologics, accelerating the Epharmacy market transition toward automated continuous chronic disease medication subscriptions.
- In the Health Care Technology industry, stringent regulatory mandates enforcing track and trace technology and pharmacovigilance tracking protocols have minimized counterfeit product mitigation risks, forcing Epharmacy operators to adopt biometric prescription verification systems to ensure a fully compliant digital medicine distribution network.
Dive into Technavio’s robust research methodology, blending expert interviews, extensive data synthesis, and validated models for unparalleled Epharmacy Market insights. See full methodology.
| Market Scope | |
|---|---|
| Page number | 304 |
| Base year | 2025 |
| Historic period | 2020-2024 |
| Forecast period | 2026-2030 |
| Growth momentum & CAGR | Accelerate at a CAGR of 20.8% |
| Market growth 2026-2030 | USD 172779.5 million |
| Market structure | Fragmented |
| YoY growth 2025-2026(%) | 20.0% |
| Key countries | US, Canada, Mexico, China, Japan, India, South Korea, Australia, Indonesia, Germany, UK, France, Italy, Spain, The Netherlands, Brazil, Argentina, Chile, Saudi Arabia, UAE, South Africa, Israel and Turkey |
| Competitive landscape | Leading Companies, Market Positioning of Companies, Competitive Strategies, and Industry Risks |
Research Analyst Overview
- The continuous evolution of the Epharmacy sector represents a paradigm shift in how institutional healthcare is procured, validated, and distributed. Industry leaders are aggressively transitioning from conventional retail models to highly integrated digital health ecosystems driven by automated inventory management and secure electronic health record synchronization.
- A pivotal trend influencing boardroom-level compliance strategy is the mandatory adoption of a comprehensive drug authentication system combined with a robust pharmacovigilance tracking protocol, ensuring the complete eradication of counterfeit therapeutics. This technological integration directly enhances operational performance; organizations deploying biometric prescription verification and cloud connected dispensing technologies have realized a 30% reduction in processing discrepancies.
- Furthermore, the seamless implementation of telehealth consultation integration and a conversational artificial intelligence interface allows for real-time symptom analysis algorithms and precision preventative care insights. Strategic investments in robotic fulfillment sorting and temperature controlled logistics dictate product pricing capabilities and supply chain resilience.
- The systemic shift toward a fully digital medicine distribution network fundamentally optimizes automated dosage tracking and secures cross-border digital prescription token exchanges globally.
What are the Key Data Covered in this Epharmacy Market Research and Growth Report?
-
What is the expected growth of the Epharmacy Market between 2026 and 2030?
-
USD 172.78 billion, at a CAGR of 20.8%
-
-
What segmentation does the market report cover?
-
The report is segmented by Product Type (Medications, Health and wellness and nutrition, and Personal care and essentials), Drug Class (Prescription drugs, and Over-the-counter drugs), Distribution Channel (Mobile applications, and Online platforms), End-user (Individuals, and Commercial) and Geography (North America, APAC, Europe, South America, Middle East and Africa)
-
-
Which regions are analyzed in the report?
-
North America, APAC, Europe, South America and Middle East and Africa
-
-
What are the key growth drivers and market challenges?
-
Rising prevalence of chronic diseases and aging global demographics, Severe cybersecurity threats and vulnerabilities in patient data protection
-
-
Who are the major players in the Epharmacy Market?
-
Alto Pharmacy LLC, Amazon.com Inc., Apollo Pharmacies Ltd., Capsule Corp., Chemist Warehouse Group, Clicks Group Ltd., CVS Health Corp., DocMorris AG, ePharmacy Nepal, ePharmacy Solutions, Express Scripts Holding Co., Guardian Health and Beauty, Medlife International Pvt Ltd., Netmeds.com, NowRx, Optum Inc., PharmEasy, Redcare Pharmacy, Tata 1mg and Walgreens Boots Alliance Inc.
-
Market Research Insights
- The Epharmacy sector is rapidly modernizing digital triage systems and remote patient monitoring to optimize institutional healthcare delivery. By leveraging automated micro fulfillment center technology and real time benefit verification, organizations have accelerated prescription processing speeds by 24% while simultaneously reducing administrative friction.
- The seamless incorporation of wearable health integration allows operators to analyze biometric data continuously, improving patient data protection protocols and driving a 15% increase in automated baby care subscription retention.
- Furthermore, the strategic deployment of advanced machine learning drug alert frameworks ensures critical counterfeit product mitigation, enabling digital platforms to enhance diagnostic accuracy by 19% and establish a highly resilient, compliance-driven operational ecosystem.
We can help! Our analysts can customize this epharmacy market research report to meet your requirements.
 RIA -
RIA - 
