Europe Virtual Cards Market Size 2025-2029
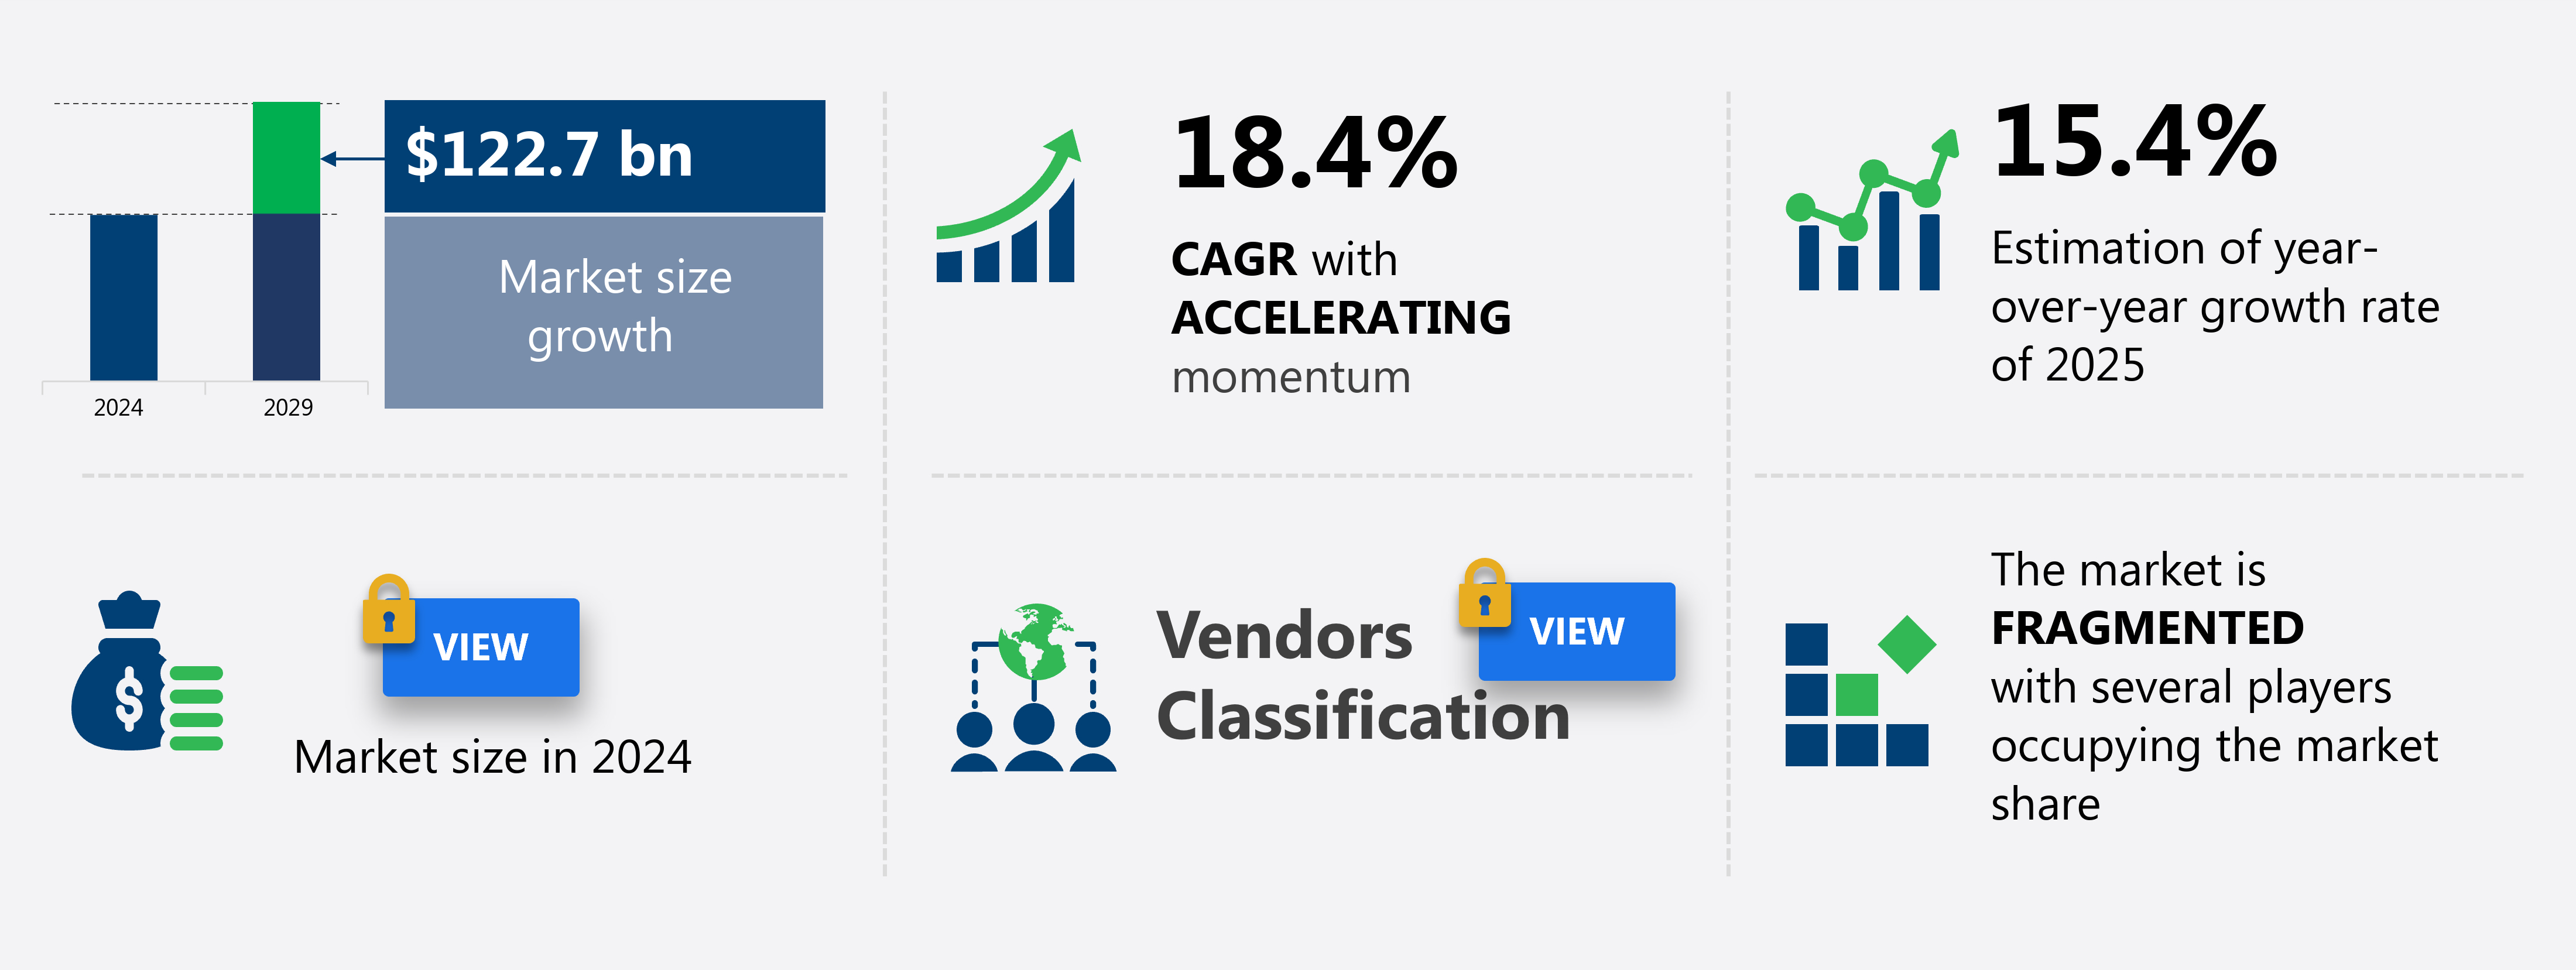
The Europe virtual cards market size is forecast to increase by USD 122.7 billion at a CAGR of 18.4% between 2024 and 2029.
- The market is experiencing significant growth, driven by the high adoption of contactless payment solutions and the emergence of Near Field Communication (NFC)-based payment technology. The popularity of mobile payments is another key factor fueling market expansion. Virtual cards offer numerous benefits, including increased security, convenience, and cost savings for both businesses and consumers. Contactless payment solutions have gained widespread acceptance, with Europe leading the way in contactless transaction volumes. NFC technology, which enables secure and convenient payments through smartphones and wearable devices, is also gaining traction. These trends are creating new opportunities for market participants, particularly those offering innovative solutions that cater to the evolving needs of customers.
- However, challenges such as data security concerns and regulatory complexities persist, requiring companies to invest in security measures and navigate the complex regulatory landscape effectively. To capitalize on these opportunities and navigate challenges, companies should focus on developing secure and user-friendly virtual card solutions that cater to the specific needs of European markets. Additionally, strategic partnerships and collaborations can help market players expand their reach and enhance their offerings. Overall, the market presents significant growth opportunities for companies seeking to innovate and adapt to the changing payment landscape.
What will be the size of the Europe Virtual Cards Market during the forecast period?

Request Free Sample
- The European virtual cards market is experiencing significant growth, driven by the increasing adoption of real-time monitoring and mobile card apps for streamlined payment processing. Data analytics platforms are playing a crucial role in enhancing payment security and data protection standards, aligning with stringent data privacy regulations. Payment service providers are integrating user interface design and customer data management features to deliver personalized experiences, while adhering to cybersecurity solutions and multi-factor authentication. Digital transformation initiatives are driving the market, with businesses seeking cost reduction strategies through automated payment processing, alternative payment methods, and payment fraud detection. Virtual card management and card issuing platforms are gaining popularity for their ability to optimize user experience, facilitate card integration, and provide real-time transactions.
- Payment gateway providers and card network providers are collaborating to offer cloud-based payment solutions, enabling businesses to streamline their payment processors and workflow automation tools. The market is further by the innovation of API integration, business intelligence tools, and cross-border payments, ensuring seamless payment processing and expanded reach. Overall, the European virtual cards market is poised for continued growth, as businesses prioritize convenience, security, and efficiency in their payment solutions.
How is this market segmented?
The market research report provides comprehensive data (region-wise segment analysis), with forecasts and estimates in "USD billion" for the period 2025-2029, as well as historical data from 2019-2023 for the following segments.
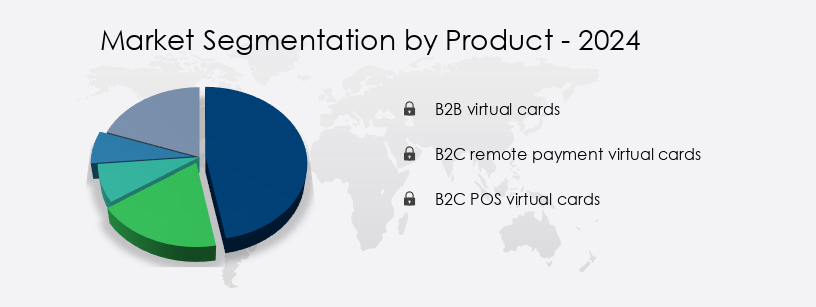
- Product
- B2B virtual cards
- B2C remote payment virtual cards
- B2C POS virtual cards
- Application
- B2B Payments
- Consumer Purchases
- Travel Bookings
- Technology
- Tokenization
- Encryption
- API Integration
- Geography
- Europe
- France
- Italy
- Switzerland
- UK
By Product Insights
The b2b virtual cards segment is estimated to witness significant growth during the forecast period.
The European virtual cards market experienced significant growth in 2024, with the B2B segment leading in terms of value. This trend was driven by the increasing adoption of real-time digital disbursements in mobile platforms and the widespread availability of the Internet in Europe. In fact, Eurostat reported that 93% of European households had Internet access in 2024. Major industries such as BFSI, e-commerce, healthcare and life sciences, education, utilities, and retail contributed to the market's expansion. Companies in these sectors integrated near-field communication (NFC) chips into their devices to facilitate contactless payments and a variety of applications. Financial services, travel and hospitality, and large enterprises were other significant contributors to the market's growth.
Virtual cards offered these entities cost optimization, payment security, and fraud prevention benefits. Moreover, the implementation of digital transformation, fintech solutions, and open banking facilitated the integration of virtual cards into their payment processing systems. Virtual card programs also provided features like card usage monitoring, reporting and analytics, and real-time reporting to enhance user experience and spend management. Multi-currency support, API integration, and compliance monitoring were essential for businesses operating internationally. Additionally, machine learning and card issuing services enabled customized card usage and limits. Security features, such as data encryption, cardholder authentication, and biometric authentication, ensured secure transactions.
Prepaid cards and cloud-based solutions provided cost-effective and flexible payment solutions for SMB businesses and B2B payments. The integration of blockchain technology and card management platforms further enhanced security and control. In summary, the European virtual cards market was marked by the integration of advanced technologies, such as AI, machine learning, and blockchain, to offer secure, efficient, and customized payment solutions for various industries and business sizes.

Get a glance at the market report of share of various segments Request Free Sample
The B2B virtual cards segment was valued at USD billion in 2019 and showed a gradual increase during the forecast period.
Market Dynamics
Our researchers analyzed the data with 2024 as the base year, along with the key drivers, trends, and challenges. A holistic analysis of drivers will help companies refine their marketing strategies to gain a competitive advantage.
What are the key market drivers leading to the rise in adoption of Europe Virtual Cards Market?
- High adoption of contactless payment solutions is the key driver of the market.
- The European virtual cards market is experiencing significant growth due to several factors. The introduction of advanced payment gateways like Stripe and Mastercard has streamlined the bill payment process, allowing consumers to make transactions without the need for physical credit or debit cards. Point-of-Sale (PoS) systems are increasingly being adopted by retailers for virtual payments, providing a faster checkout experience and effective information management.
- Moreover, the emphasis on secure payments is driving the market's growth as virtual cards offer enhanced security features compared to traditional payment methods. The well-established payment infrastructure in Europe is expected to further fuel the demand for virtual cards during the forecast period.
What are the market trends shaping the Europe Virtual Cards Market?
- Emergence of NFC-based payment technology is the upcoming trend in the market.
- The European virtual cards market has experienced significant growth with the adoption of Near Field Communication (NFC) technology. NFC enables contactless payments by facilitating communication between devices in close proximity. This technology's convenience, speed, and enhanced security features have led to its widespread acceptance across Europe. Major players like Revolut and N26, based in the UK and Germany respectively, have been pioneers in this domain.
- They offer virtual cards that support NFC payments, enabling users to make secure transactions with a simple tap on their smartphones. These companies' digital payment solutions provide a seamless experience, making NFC-enabled virtual cards an attractive alternative to traditional plastic cards.
What challenges does Europe Virtual Cards Market face during the growth?
- Popularity of mobile payments is a key challenge affecting the market growth.
- Mobile payments refer to financial transactions conducted via mobile devices, encompassing mobile money, wallets, and application-based payments, among other technologies. The European mobile payments market has experienced significant growth due to the advancement of telecommunication infrastructure and the widespread adoption of smartphones. Mobile payment users present their digital wallets at payment terminals to complete transactions, with added security measures like fingerprint scans and facial recognition provided by underlying smartphone hardware.
- This enhanced security is a major factor driving the growth of mobile payments in Europe. The number of mobile payment transactions is projected to continue increasing during the forecast period.
Exclusive Europe Virtual Cards Market Customer Landscape
The market forecasting report includes the adoption lifecycle of the market, covering from the innovator's stage to the laggard's stage. It focuses on adoption rates in different regions based on penetration. Furthermore, the report also includes key purchase criteria and drivers of price sensitivity to help companies evaluate and develop their market growth analysis strategies.
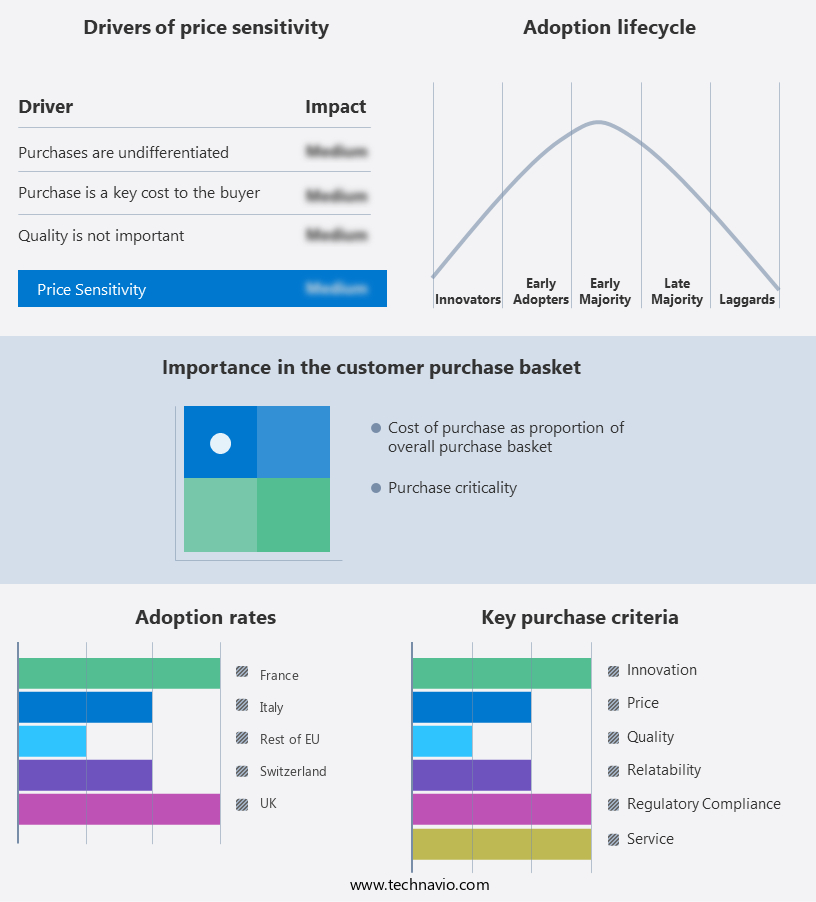
Customer Landscape
Key Companies & Market Insights
Companies are implementing various strategies, such as strategic alliances, market forecast partnerships, mergers and acquisitions, geographical expansion, and product/service launches, to enhance their presence in the market.
The market research and growth report includes detailed analyses of the competitive landscape of the market and information about key companies, including:
- Revolut Ltd. (United Kingdom)
- Monese Ltd. (United Kingdom)
- N26 GmbH (Germany)
- Curve OS Limited (United Kingdom)
- Wise PLC (United Kingdom)
- Skrill Limited (United Kingdom)
- Neteller (United Kingdom)
- EcoPayz (United Kingdom)
- Checkout.com (United Kingdom)
- Klarna Bank AB (Sweden)
- Monzo Bank Limited (United Kingdom)
- Starling Bank Limited (United Kingdom)
- Adyen N.V. (Netherlands)
- Worldpay Group (United Kingdom)
- Barclays PLC (United Kingdom)
- BNP Paribas (France)
- Société Générale S.A. (France)
- UBS Group AG (Switzerland)
- Credit Suisse AG (Switzerland)
- FinecoBank S.p.A. (Italy)
Qualitative and quantitative analysis of companies has been conducted to help clients understand the wider business environment as well as the strengths and weaknesses of key market players. Data is qualitatively analyzed to categorize companies as pure play, category-focused, industry-focused, and diversified; it is quantitatively analyzed to categorize companies as dominant, leading, strong, tentative, and weak.
Research Analyst Overview
The market is witnessing significant growth as businesses embrace digital transformation and seek to optimize their payment processes. Virtual cards, also known as single-use or plastic-less cards, offer numerous benefits, including increased payment security, cost optimization, and improved workflow automation. Financial services institutions and fintech solutions providers are at the forefront of this trend, offering virtual card programs that cater to various industries, such as manufacturing and industrial, travel and hospitality, and SMB businesses. These programs enable businesses to make supplier payments, process employee expenses, and facilitate e-commerce transactions more efficiently and securely. Virtual cards are also gaining popularity in the realm of recurring payments, subscription services, and B2B payments.
The integration of artificial intelligence (AI) and machine learning (ML) technologies further enhances the functionality of these cards, allowing for real-time reporting, card usage monitoring, and data insights. Payment security is a critical concern for businesses, and virtual cards address this need through data encryption, biometric authentication, and compliance monitoring. Moreover, virtual cards offer multi-currency support, making international transactions more convenient and cost-effective. Virtual card programs also prioritize user experience (UX) and cardholder authentication, ensuring a seamless and convenient payment process. API integration with payment gateways and card management platforms further streamlines the payment process and enhances the overall user experience.
The adoption of virtual cards is not limited to large enterprises but is also gaining traction among SMB businesses. Prepaid cards and cloud-based solutions offer cost-effective options for smaller businesses looking to optimize their payment processes and improve spend management. The market is expected to continue its growth trajectory as businesses increasingly prioritize payment optimization, cost savings, and improved security. The integration of blockchain technology and open banking is also expected to further disrupt the market and offer new opportunities for innovation. In , the market is experiencing growth as businesses seek to digitize their payment processes and optimize their spending.
Virtual cards offer numerous benefits, including increased security, cost savings, and improved workflow automation. The integration of emerging technologies such as AI, ML, and blockchain is expected to further disrupt the market and offer new opportunities for innovation.
|
Market Scope
|
|
Report Coverage
|
Details
|
|
Page number
|
167
|
|
Base year
|
2024
|
|
Historic period
|
2019-2023 |
|
Forecast period
|
2025-2029
|
|
Growth momentum & CAGR
|
Accelerate at a CAGR of 18.4%
|
|
Market growth 2025-2029
|
USD 122.7 billion
|
|
Market structure
|
Fragmented
|
|
YoY growth 2024-2025(%)
|
15.4
|
|
Competitive landscape
|
Leading Companies, Market Positioning of Companies, Competitive Strategies, and Industry Risks
|
Request Free Sample
What are the Key Data Covered in this Market Research Report?
- CAGR of the market during the forecast period
- Detailed information on factors that will drive the market growth and forecasting between 2025 and 2029
- Precise estimation of the size of the market and its contribution of the market in focus to the parent market
- Accurate predictions about upcoming market growth and trends and changes in consumer behaviour
- Growth of the market across Europe
- Thorough analysis of the market's competitive landscape and detailed information about companies
- Comprehensive analysis of factors that will challenge the growth of market companies
We can help! Our analysts can customize this market research report to meet your requirements Get in touch
1 Executive Summary
- 1.1 Market overview
- Executive Summary - Chart on Market Overview
- Executive Summary - Data Table on Market Overview
- Executive Summary - Chart on Country Market Characteristics
- Executive Summary - Chart on Market by Geography
- Executive Summary - Chart on Market Segmentation by Product
- Executive Summary - Chart on Market Segmentation by Application
- Executive Summary - Chart on Incremental Growth
- Executive Summary - Data Table on Incremental Growth
- Executive Summary - Chart on Company Market Positioning
2 Technavio Analysis
- 2.1 Analysis of price sensitivity, lifecycle, customer purchase basket, adoption rates, and purchase criteria
- Analysis of price sensitivity, lifecycle, customer purchase basket, adoption rates, and purchase criteria
- 2.2 Criticality of inputs and Factors of differentiation
- Overview on criticality of inputs and factors of differentiation
- 2.3 Factors of disruption
- Overview on factors of disruption
- 2.4 Impact of drivers and challenges
- Impact of drivers and challenges in 2024 and 2029
3 Market Landscape
- 3.1 Market ecosystem
- Parent Market
- Data Table on - Parent Market
- 3.2 Market characteristics
- Market characteristics analysis
4 Market Sizing
- 4.1 Market definition
- Offerings of companies included in the market definition
- 4.2 Market segment analysis
- 4.4 Market outlook: Forecast for 2024-2029
- Chart on Europe - Market size and forecast 2024-2029 ($ billion)
- Data Table on Regional - Market size and forecast 2024-2029 ($ billion)
- Chart on Europe: Year-over-year growth 2024-2029 (%)
- Data Table on Regional - Market size and forecast 2024-2029 ($ billion)
5 Historic Market Size
- 5.1 Virtual Cards Market in Europe 2019 - 2023
- Historic Market Size - Data Table on Virtual Cards Market in Europe 2019 - 2023 ($ billion)
- 5.2 Product segment analysis 2019 - 2023
- Historic Market Size - Product Segment 2019 - 2023 ($ billion)
- 5.3 Application segment analysis 2019 - 2023
- Historic Market Size - Application Segment 2019 - 2023 ($ billion)
- 5.4 Geography segment analysis 2019 - 2023
- Historic Market Size - Geography Segment 2019 - 2023 ($ billion)
6 Qualitative Analysis
- 6.1 Impact of AI on Virtual Cards Market in Europe
7 Five Forces Analysis
- 7.1 Five forces summary
- Five forces analysis - Comparison between 2024 and 2029
- 7.2 Bargaining power of buyers
- Bargaining power of buyers - Impact of key factors 2024 and 2029
- 7.3 Bargaining power of suppliers
- Bargaining power of suppliers - Impact of key factors in 2024 and 2029
- 7.4 Threat of new entrants
- Threat of new entrants - Impact of key factors in 2024 and 2029
- 7.5 Threat of substitutes
- Threat of substitutes - Impact of key factors in 2024 and 2029
- 7.6 Threat of rivalry
- Threat of rivalry - Impact of key factors in 2024 and 2029
- 7.7 Market condition
- Chart on Market condition - Five forces 2024 and 2029
8 Market Segmentation by Product
- 8.1 Market segments
- Chart on Product - Market share (2024-2029) (%)
- Data Table on Product - Market share (2024-2029) (%)
- 8.2 Comparison by Product
- Chart on Comparison by Product
- Data Table on Comparison by Product
- 8.3 B2B virtual cards - Market size and forecast (2024-2029)
- Chart on B2B virtual cards - Market size and forecast (2024-2029) ($ billion)
- Data Table on B2B virtual cards - Market size and forecast (2024-2029) ($ billion)
- Chart on B2B virtual cards - Year-over-year growth (2024-2029) (%)
- Data Table on B2B virtual cards - Year-over-year growth (2024-2029) (%)
- 8.4 B2C remote payment virtual cards - Market size and forecast (2024-2029)
- Chart on B2C remote payment virtual cards - Market size and forecast (2024-2029) ($ billion)
- Data Table on B2C remote payment virtual cards - Market size and forecast (2024-2029) ($ billion)
- Chart on B2C remote payment virtual cards - Year-over-year growth (2024-2029) (%)
- Data Table on B2C remote payment virtual cards - Year-over-year growth (2024-2029) (%)
- 8.5 B2C POS virtual cards - Market size and forecast (2024-2029)
- Chart on B2C POS virtual cards - Market size and forecast (2024-2029) ($ billion)
- Data Table on B2C POS virtual cards - Market size and forecast (2024-2029) ($ billion)
- Chart on B2C POS virtual cards - Year-over-year growth (2024-2029) (%)
- Data Table on B2C POS virtual cards - Year-over-year growth (2024-2029) (%)
- 8.6 Market opportunity by Product
- Market opportunity by Product ($ billion)
- Data Table on Market opportunity by Product ($ billion)
9 Market Segmentation by Application
- 9.1 Market segments
- Chart on Application - Market share (2024-2029) (%)
- Data Table on Application - Market share (2024-2029) (%)
- 9.2 Comparison by Application
- Chart on Comparison by Application
- Data Table on Comparison by Application
- 9.3 Business use - Market size and forecast (2024-2029)
- Chart on Business use - Market size and forecast (2024-2029) ($ billion)
- Data Table on Business use - Market size and forecast (2024-2029) ($ billion)
- Chart on Business use - Year-over-year growth (2024-2029) (%)
- Data Table on Business use - Year-over-year growth (2024-2029) (%)
- 9.4 Consumer use - Market size and forecast (2024-2029)
- Chart on Consumer use - Market size and forecast (2024-2029) ($ billion)
- Data Table on Consumer use - Market size and forecast (2024-2029) ($ billion)
- Chart on Consumer use - Year-over-year growth (2024-2029) (%)
- Data Table on Consumer use - Year-over-year growth (2024-2029) (%)
- 9.5 Market opportunity by Application
- Market opportunity by Application ($ billion)
- Data Table on Market opportunity by Application ($ billion)
10 Market Segmentation by Technology
- 10.1 Market segments
- Chart on Technology - Market share (2024-2029) (%)
- Data Table on Technology - Market share (2024-2029) (%)
- 10.2 Comparison by Technology
- Chart on Comparison by Technology
- Data Table on Comparison by Technology
- 10.3 Tokenization - Market size and forecast (2024-2029)
- Chart on Tokenization - Market size and forecast (2024-2029) ($ billion)
- Data Table on Tokenization - Market size and forecast (2024-2029) ($ billion)
- Chart on Tokenization - Year-over-year growth (2024-2029) (%)
- Data Table on Tokenization - Year-over-year growth (2024-2029) (%)
- 10.4 Encryption - Market size and forecast (2024-2029)
- Chart on Encryption - Market size and forecast (2024-2029) ($ billion)
- Data Table on Encryption - Market size and forecast (2024-2029) ($ billion)
- Chart on Encryption - Year-over-year growth (2024-2029) (%)
- Data Table on Encryption - Year-over-year growth (2024-2029) (%)
- 10.5 API Integration - Market size and forecast (2024-2029)
- Chart on API Integration - Market size and forecast (2024-2029) ($ billion)
- Data Table on API Integration - Market size and forecast (2024-2029) ($ billion)
- Chart on API Integration - Year-over-year growth (2024-2029) (%)
- Data Table on API Integration - Year-over-year growth (2024-2029) (%)
- 10.6 Market opportunity by Technology
- Market opportunity by Technology ($ billion)
- Data Table on Market opportunity by Technology ($ billion)
11 Market Segmentation by Application
- 11.1 Market segments
- Chart on Application - Market share (2024-2029) (%)
- Data Table on Application - Market share (2024-2029) (%)
- 11.2 Comparison by Application
- Chart on Comparison by Application
- Data Table on Comparison by Application
- 11.3 B2B Payments - Market size and forecast (2024-2029)
- Chart on B2B Payments - Market size and forecast (2024-2029) ($ billion)
- Data Table on B2B Payments - Market size and forecast (2024-2029) ($ billion)
- Chart on B2B Payments - Year-over-year growth (2024-2029) (%)
- Data Table on B2B Payments - Year-over-year growth (2024-2029) (%)
- 11.4 Consumer Purchases - Market size and forecast (2024-2029)
- Chart on Consumer Purchases - Market size and forecast (2024-2029) ($ billion)
- Data Table on Consumer Purchases - Market size and forecast (2024-2029) ($ billion)
- Chart on Consumer Purchases - Year-over-year growth (2024-2029) (%)
- Data Table on Consumer Purchases - Year-over-year growth (2024-2029) (%)
- 11.5 Travel Bookings - Market size and forecast (2024-2029)
- Chart on Travel Bookings - Market size and forecast (2024-2029) ($ billion)
- Data Table on Travel Bookings - Market size and forecast (2024-2029) ($ billion)
- Chart on Travel Bookings - Year-over-year growth (2024-2029) (%)
- Data Table on Travel Bookings - Year-over-year growth (2024-2029) (%)
- 11.6 Market opportunity by Application
- Market opportunity by Application ($ billion)
- Data Table on Market opportunity by Application ($ billion)
12 Customer Landscape
- 12.1 Customer landscape overview
- Analysis of price sensitivity, lifecycle, customer purchase basket, adoption rates, and purchase criteria
13 Geographic Landscape
- 13.1 Geographic segmentation
- Chart on Market share by geography - 2024-2029 (%)
- Data Table on Market share by geography - 2024-2029 (%)
- 13.2 Geographic comparison
- Chart on Geographic comparison
- Data Table on Geographic comparison
- 13.3 Europe - Market size and forecast (2024-2029)
- Chart on Europe - Market size and forecast (2024-2029) ($ billion)
- Data Table on Europe - Market size and forecast (2024-2029) ($ billion)
- Chart on Europe - Year-over-year growth (2024-2029) (%)
- Data Table on Europe - Year-over-year growth (2024-2029) (%)
- Chart on UK - Market size and forecast 2024-2029 ($ billion)
- Data Table on UK - Market size and forecast 2024-2029 ($ billion)
- Chart on UK - Year-over-year growth 2024-2029 (%)
- Data Table on UK - Year-over-year growth 2024-2029 (%)
- 13.4 UK - Market size and forecast (2024-2029)
- Chart on UK - Market size and forecast (2024-2029) ($ billion)
- Data Table on UK - Market size and forecast (2024-2029) ($ billion)
- Chart on UK - Year-over-year growth (2024-2029) (%)
- Data Table on UK - Year-over-year growth (2024-2029) (%)
- Chart on France - Market size and forecast 2024-2029 ($ billion)
- Data Table on France - Market size and forecast 2024-2029 ($ billion)
- Chart on France - Year-over-year growth 2024-2029 (%)
- Data Table on France - Year-over-year growth 2024-2029 (%)
- 13.5 France - Market size and forecast (2024-2029)
- Chart on France - Market size and forecast (2024-2029) ($ billion)
- Data Table on France - Market size and forecast (2024-2029) ($ billion)
- Chart on France - Year-over-year growth (2024-2029) (%)
- Data Table on France - Year-over-year growth (2024-2029) (%)
- Chart on Italy - Market size and forecast 2024-2029 ($ billion)
- Data Table on Italy - Market size and forecast 2024-2029 ($ billion)
- Chart on Italy - Year-over-year growth 2024-2029 (%)
- Data Table on Italy - Year-over-year growth 2024-2029 (%)
- 13.6 Italy - Market size and forecast (2024-2029)
- Chart on Italy - Market size and forecast (2024-2029) ($ billion)
- Data Table on Italy - Market size and forecast (2024-2029) ($ billion)
- Chart on Italy - Year-over-year growth (2024-2029) (%)
- Data Table on Italy - Year-over-year growth (2024-2029) (%)
- Chart on Switzerland - Market size and forecast 2024-2029 ($ billion)
- Data Table on Switzerland - Market size and forecast 2024-2029 ($ billion)
- Chart on Switzerland - Year-over-year growth 2024-2029 (%)
- Data Table on Switzerland - Year-over-year growth 2024-2029 (%)
- 13.7 Switzerland - Market size and forecast (2024-2029)
- Chart on Switzerland - Market size and forecast (2024-2029) ($ billion)
- Data Table on Switzerland - Market size and forecast (2024-2029) ($ billion)
- Chart on Switzerland - Year-over-year growth (2024-2029) (%)
- Data Table on Switzerland - Year-over-year growth (2024-2029) (%)
- Chart on Rest of Europe - Market size and forecast 2024-2029 ($ billion)
- Data Table on Rest of Europe - Market size and forecast 2024-2029 ($ billion)
- Chart on Rest of Europe - Year-over-year growth 2024-2029 (%)
- Data Table on Rest of Europe - Year-over-year growth 2024-2029 (%)
- 13.8 Rest of Europe - Market size and forecast (2024-2029)
- Chart on Rest of Europe - Market size and forecast (2024-2029) ($ billion)
- Data Table on Rest of Europe - Market size and forecast (2024-2029) ($ billion)
- Chart on Rest of Europe - Year-over-year growth (2024-2029) (%)
- Data Table on Rest of Europe - Year-over-year growth (2024-2029) (%)
- Market opportunity by geography ($ billion)
- Data Table on Market opportunity by geography ($ billion)
14 Drivers, Challenges, and Opportunity/Restraints
- 14.3 Impact of drivers and challenges
- Impact of drivers and challenges in 2024 and 2029
- 14.4 Market opportunities/restraints
15 Competitive Landscape
- 15.2 Competitive Landscape
- Overview on criticality of inputs and factors of differentiation
- 15.3 Landscape disruption
- Overview on factors of disruption
- 15.4 Industry risks
- Impact of key risks on business
16 Competitive Analysis
- 16.2 Market positioning of companies
- Matrix on companies position and classification
- 16.3 Revolut Ltd. (United Kingdom)
- Revolut Ltd. (United Kingdom) - Overview
- Revolut Ltd. (United Kingdom) - Product / Service
- Revolut Ltd. (United Kingdom) - Key offerings
- 16.4 Monese Ltd. (United Kingdom)
- Monese Ltd. (United Kingdom) - Overview
- Monese Ltd. (United Kingdom) - Product / Service
- Monese Ltd. (United Kingdom) - Key offerings
- 16.5 N26 GmbH (Germany)
- N26 GmbH (Germany) - Overview
- N26 GmbH (Germany) - Product / Service
- N26 GmbH (Germany) - Key offerings
- 16.6 Curve OS Limited (United Kingdom)
- Curve OS Limited (United Kingdom) - Overview
- Curve OS Limited (United Kingdom) - Product / Service
- Curve OS Limited (United Kingdom) - Key offerings
- 16.7 Wise PLC (United Kingdom)
- Wise PLC (United Kingdom) - Overview
- Wise PLC (United Kingdom) - Product / Service
- Wise PLC (United Kingdom) - Key offerings
- 16.8 Skrill Limited (United Kingdom)
- Skrill Limited (United Kingdom) - Overview
- Skrill Limited (United Kingdom) - Product / Service
- Skrill Limited (United Kingdom) - Key offerings
- 16.9 Neteller (United Kingdom)
- Neteller (United Kingdom) - Overview
- Neteller (United Kingdom) - Product / Service
- Neteller (United Kingdom) - Key offerings
- 16.10 EcoPayz (United Kingdom)
- EcoPayz (United Kingdom) - Overview
- EcoPayz (United Kingdom) - Product / Service
- EcoPayz (United Kingdom) - Key offerings
- 16.11 Checkout.com (United Kingdom)
- Checkout.com (United Kingdom) - Overview
- Checkout.com (United Kingdom) - Product / Service
- Checkout.com (United Kingdom) - Key offerings
- 16.12 Klarna Bank AB (Sweden)
- Klarna Bank AB (Sweden) - Overview
- Klarna Bank AB (Sweden) - Product / Service
- Klarna Bank AB (Sweden) - Key offerings
- 16.13 Monzo Bank Limited (United Kingdom)
- Monzo Bank Limited (United Kingdom) - Overview
- Monzo Bank Limited (United Kingdom) - Product / Service
- Monzo Bank Limited (United Kingdom) - Key offerings
- 16.14 Starling Bank Limited (United Kingdom)
- Starling Bank Limited (United Kingdom) - Overview
- Starling Bank Limited (United Kingdom) - Product / Service
- Starling Bank Limited (United Kingdom) - Key offerings
- 16.15 Adyen N.V. (Netherlands)
- Adyen N.V. (Netherlands) - Overview
- Adyen N.V. (Netherlands) - Product / Service
- Adyen N.V. (Netherlands) - Key offerings
- 16.16 Worldpay Group (United Kingdom)
- Worldpay Group (United Kingdom) - Overview
- Worldpay Group (United Kingdom) - Product / Service
- Worldpay Group (United Kingdom) - Key offerings
- 16.17 Barclays PLC (United Kingdom)
- Barclays PLC (United Kingdom) - Overview
- Barclays PLC (United Kingdom) - Product / Service
- Barclays PLC (United Kingdom) - Key offerings
- 16.18 BNP Paribas (France)
- BNP Paribas (France) - Overview
- BNP Paribas (France) - Product / Service
- BNP Paribas (France) - Key offerings
- 16.19 Société Générale S.A. (France)
- Société Générale S.A. (France) - Overview
- Société Générale S.A. (France) - Product / Service
- Société Générale S.A. (France) - Key offerings
- 16.20 UBS Group AG (Switzerland)
- UBS Group AG (Switzerland) - Overview
- UBS Group AG (Switzerland) - Product / Service
- UBS Group AG (Switzerland) - Key offerings
- 16.21 Credit Suisse AG (Switzerland)
- Credit Suisse AG (Switzerland) - Overview
- Credit Suisse AG (Switzerland) - Product / Service
- Credit Suisse AG (Switzerland) - Key offerings
- 16.22 FinecoBank S.p.A. (Italy)
- FinecoBank S.p.A. (Italy) - Overview
- FinecoBank S.p.A. (Italy) - Product / Service
- FinecoBank S.p.A. (Italy) - Key offerings
17 Appendix
- 17.2 Inclusions and exclusions checklist
- Inclusions checklist
- Exclusions checklist
- 17.3 Currency conversion rates for US$
- Currency conversion rates for US$
- 17.4 Research methodology
- 17.7 Validation techniques employed for market sizing
- Validation techniques employed for market sizing
- 17.9 360 degree market analysis
- 360 degree market analysis
- 17.10 List of abbreviations