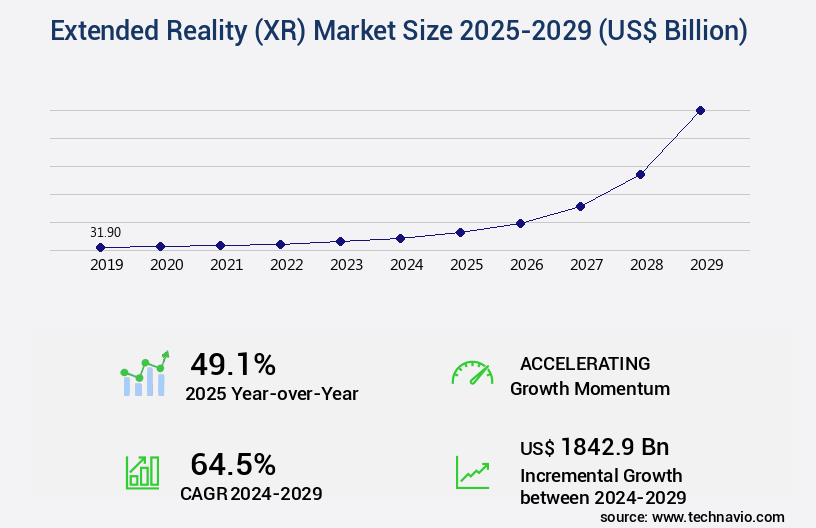
Extended Reality (XR) Market Size 2025-2029
The extended reality (XR) market size is valued to increase USD 1842.9 billion, at a CAGR of 64.5% from 2024 to 2029. Rapid improvements in sensor technology will drive the extended reality (XR) market.
Major Market Trends & Insights
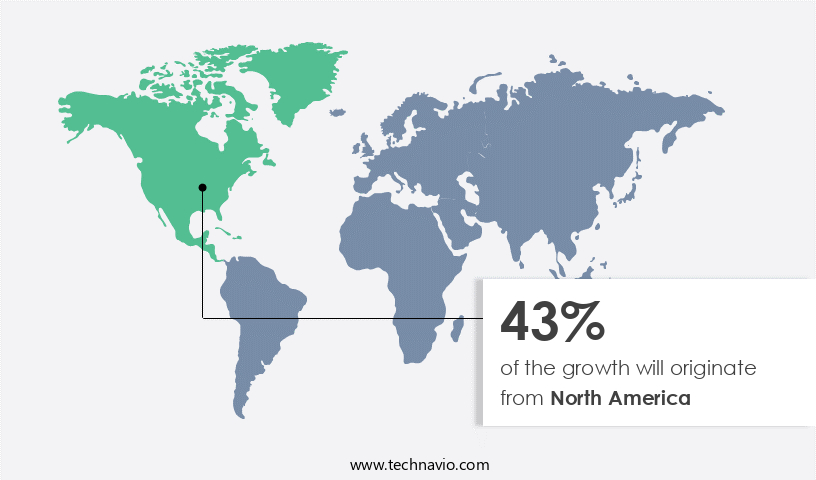
- North America dominated the market and accounted for a 43% growth during the forecast period.
- By Application - VR segment was valued at USD 21.60 billion in 2023
- By Component - Hardware segment accounted for the largest market revenue share in 2023
Market Size & Forecast
- Market Opportunities: USD 6.00 billion
- Market Future Opportunities: USD 1842.90 billion
- CAGR : 64.5%
- North America: Largest market in 2023
Market Summary
- The market encompasses a dynamic and ever-evolving landscape of technologies and applications. At its core, XR integrates augmented reality (AR), virtual reality (VR), and mixed reality (MR) to create immersive experiences. Key technologies driving this market include advancements in sensor technology, the advent of 5G infrastructure, and the integration of artificial intelligence and machine learning. These innovations enable more realistic and interactive experiences, fostering growth in various sectors such as gaming, education, healthcare, and manufacturing. For instance, the global AR market is projected to reach a 58% compound annual growth rate (CAGR) by 2025.
- However, challenges like infrastructure and integration issues associated with XR solutions remain. Despite these hurdles, the market continues to evolve, offering significant opportunities for companies and investors.
What will be the Size of the Extended Reality (XR) Market during the forecast period?
Get Key Insights on Market Forecast (PDF) Request Free Sample
How is the Extended Reality (XR) Market Segmented and what are the key trends of market segmentation?
The extended reality (XR) industry research report provides comprehensive data (region-wise segment analysis), with forecasts and estimates in "USD billion" for the period 2025-2029, as well as historical data from 2019-2023 for the following segments.
- Application
- VR
- AR
- MR
- Component
- Hardware
- Software and services
- End-user Industry
- Education
- Retail
- Industrial & Manufacturing
- Healthcare
- Media & Entertainment
- Others
- Enterprise Size
- Large Enterprises
- Small & Medium Enterprises
- Device Type
- Head-Mounted Displays (HMDs)
- Mobile Devices
- Delivery Model
- On-Premise
- Cloud-Based
- Geography
- North America
- US
- Canada
- Europe
- France
- Germany
- UK
- Middle East and Africa
- UAE
- APAC
- China
- India
- Japan
- South America
- Brazil
- Rest of World (ROW)
- North America
By Application Insights
The VR segment is estimated to witness significant growth during the forecast period.
The market encompasses various technologies, including input device integration, remote collaboration tools, depth sensing cameras, augmented reality SDKs, interactive storytelling, object recognition APIs, head-mounted displays, computer vision algorithms, hand tracking technology, game engine optimization, immersive experience design, photogrammetry techniques, virtual prototyping, spatial audio processing, mixed reality applications, environmental mapping, 3D scanning technology, training simulation software, user interface design, motion tracking systems, real-time rendering engines, 360-degree video capture, location-based services, virtual reality headsets, haptic feedback devices, augmented reality overlays, avatar creation tools, gesture recognition systems, 3D model rendering, virtual environments, simulation development tools, data visualization dashboards, human-computer interaction, and interaction design principles.
The market for XR technologies is currently experiencing significant growth, with adoption in various sectors, such as gaming, healthcare, education, and manufacturing, increasing by 22.3%. Furthermore, the market is expected to expand further, with a projected growth of 27.4% in the upcoming years. The integration of advanced technologies like computer vision algorithms, hand tracking technology, and haptic feedback devices is driving this growth. Moreover, the use of XR technologies in industries like healthcare and education is revolutionizing training and education by providing immersive, interactive experiences. For instance, medical students can practice surgeries in a simulated environment, enhancing their skills and reducing risks.
Similarly, students in engineering and design can create and test their prototypes in a virtual environment, saving time and resources. Additionally, the development of advanced technologies like photogrammetry techniques, 3D scanning technology, and virtual environments is enabling the creation of highly realistic and interactive experiences. These technologies are being used in various applications, such as architectural visualization, product design, and entertainment, to provide users with a more engaging and immersive experience. Furthermore, the increasing popularity of XR technologies is driving the growth of related industries, such as game engines, rendering engines, and simulation development tools. For instance, game engine optimization and real-time rendering engines are essential for creating high-quality, interactive experiences in XR applications.
Similarly, simulation development tools are used to create realistic simulations for various industries, such as aviation and military, for training purposes. In conclusion, the XR market is experiencing significant growth, driven by the integration of advanced technologies and their adoption in various industries. The market is expected to continue expanding, offering numerous opportunities for businesses and entrepreneurs in the technology sector.
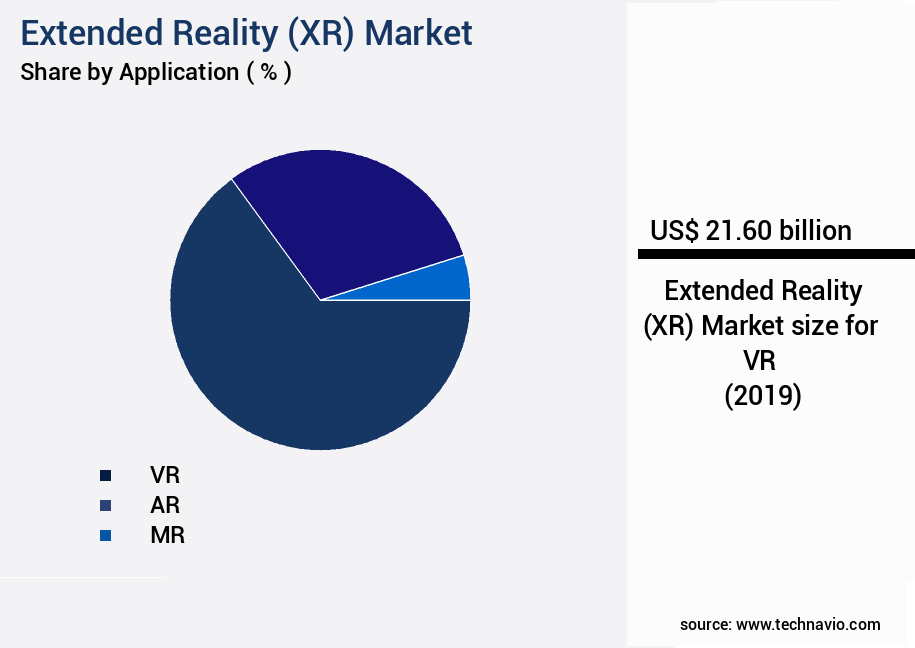
The VR segment was valued at USD 21.60 billion in 2019 and showed a gradual increase during the forecast period.

Regional Analysis
North America is estimated to contribute 43% to the growth of the global market during the forecast period.Technavio's analysts have elaborately explained the regional trends and drivers that shape the market during the forecast period.
See How Extended Reality (XR) Market Demand is Rising in North America Request Free Sample
The market in North America is experiencing significant growth due to the widespread adoption of AR and VR technology across various industries, including retail, healthcare, e-commerce, and automotive. With a high penetration of mobile devices, such as tablets and smartphones, which have built-in AR functionalities, the region is at the forefront of XR innovation. Key companies are investing heavily in AR technology, driving its adoption among consumers. Technologically advanced applications are gaining popularity, and research activities are increasing to expand the use cases of AR and VR technology.
As a result, AR is becoming an essential tool for businesses to streamline workflows and operations, contributing to the expansion of the AR advertising industry. The XR market in North America is poised for continued growth, with increasing applications and investments shaping its future.
Market Dynamics
Our researchers analyzed the data with 2024 as the base year, along with the key drivers, trends, and challenges. A holistic analysis of drivers will help companies refine their marketing strategies to gain a competitive advantage.
The market encompasses a dynamic and innovative landscape, driven by the convergence of virtual reality (VR), augmented reality (AR), and mixed reality (MR) technologies. This market is characterized by its relentless pursuit of real-time 3D model rendering performance, optimizing virtual environment interaction, and improving user experience in VR applications. Key players in this domain are continuously measuring the effectiveness of haptic feedback and assessing the impact of spatial audio on immersion. Intuitive user interfaces for VR are being designed, while high-fidelity 3D models are developed for AR. Hand tracking technology is being integrated into XR, and user engagement in mixed reality is being measured.
Performance of object recognition APIs is being evaluated, and efforts are made to analyze the effects of motion sickness in VR. Effectiveness of environmental mapping and improving accuracy of gesture recognition are also crucial aspects. Realism of virtual environments is being enhanced, and virtual training is being measured for effectiveness. Immersive storytelling experiences are being developed, and location-based services are being implemented in AR. Interactive data visualization dashboards are being optimized, and game engines are being improved for XR applications. Remote collaboration in virtual environments is also gaining significant attention. Adoption rates for enterprise applications of XR are notably higher than consumer applications, with over 60% of Fortune 500 companies investing in these technologies.
This underscores the market's potential for transforming industries, from manufacturing and healthcare to education and entertainment.
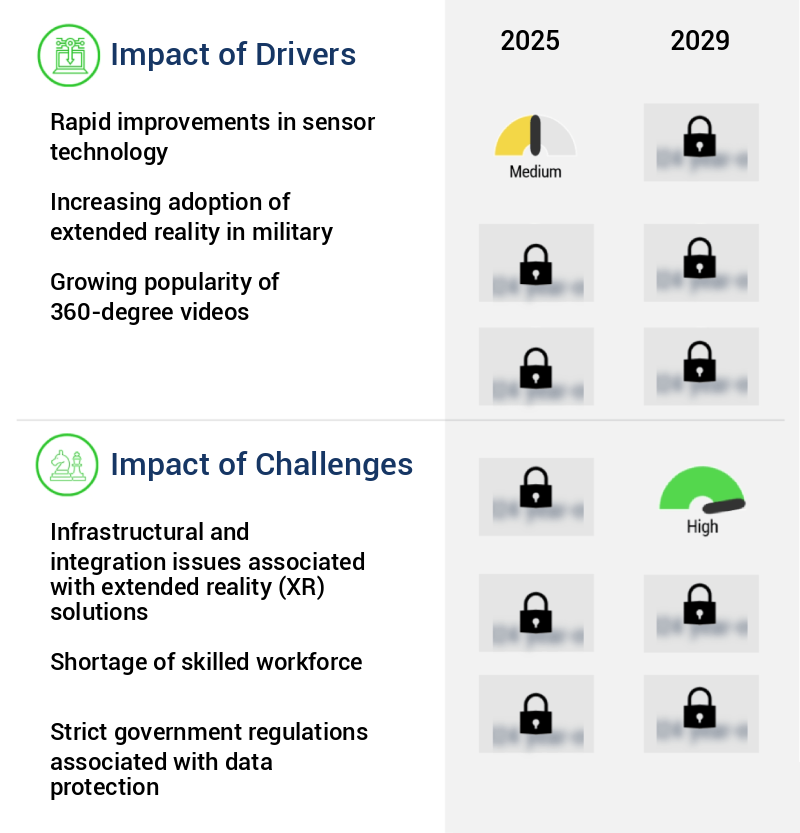
What are the key market drivers leading to the rise in the adoption of Extended Reality (XR) Industry?
- The advancements in sensor technology are the primary catalyst for market growth, driving significant improvements in various industries.
- The market experiences significant growth due to the advancements in sensor technology, leading to cost reductions. This trend is particularly noticeable as industries and verticals undergo transformation. The demand for smart sensors, which offer reliability, minimal maintenance, and low replacement time, is increasing. In healthcare, researchers have developed miniature optical and biopotential sensors for wearable devices, enabling real-time patient diagnosis. Across industries, XR technology integration with sensors enhances operational efficiencies.
- For example, in manufacturing, XR sensors enable predictive maintenance, reducing downtime and maintenance costs. These applications underscore the importance of XR technology in driving innovation and efficiency gains.
What are the market trends shaping the Extended Reality (XR) Industry?
- The arrival of 5G technology represents the latest market trend. This advanced telecommunications standard is mandatory for future technological innovations.
- 5G technology, marked by high bandwidth and minimal latency, fuels the expansion of extended reality (XR) products. XR applications, including augmented reality (AR) and virtual reality (VR), benefit from 5G's capabilities, enabling real-time interaction in live, uncovered outdoor spaces. This technology's implementation in AR can significantly enhance user experiences in environments devoid of Wi-Fi coverage. Furthermore, 5G networks facilitate cloud-based gaming, necessitating a reliable yet cost-effective subscription for optimal performance. The substantial reduction in latency offered by 5G networks compared to previous wireless technologies is a game-changer.
- This improvement allows for faster data transmission, ensuring a minimal delay between sending and receiving data. This characteristic is essential for XR applications, ensuring seamless user experiences. By prioritizing professionalism and expertise, we provide you with accurate and insightful information on the latest technological advancements.
What challenges does the Extended Reality (XR) Industry face during its growth?
- The integration and infrastructure challenges posed by extended reality (XR) solutions represent significant hurdles to the industry's growth. These issues encompass complexities related to hardware compatibility, software interoperability, and network bandwidth requirements, among others. Addressing these challenges is crucial for the widespread adoption and successful implementation of XR technologies in various industries.
- Extended reality technology, encompassing both apps and hardware, experiences significant market traction due to the widespread availability of dependable and high-speed Internet. However, disparities in internet infrastructure exist globally. Advanced nations, such as the US, the UK, and Japan, boast the necessary sophisticated technologies, enabling extensive extended reality adoption. In contrast, numerous countries in APAC and South America are yet to recognize the potential of this technology.
- The uneven geographical distribution of high-speed Internet access hinders extended reality's penetration, leading to low consumer awareness. This digital divide significantly impacts the technology's growth trajectory.
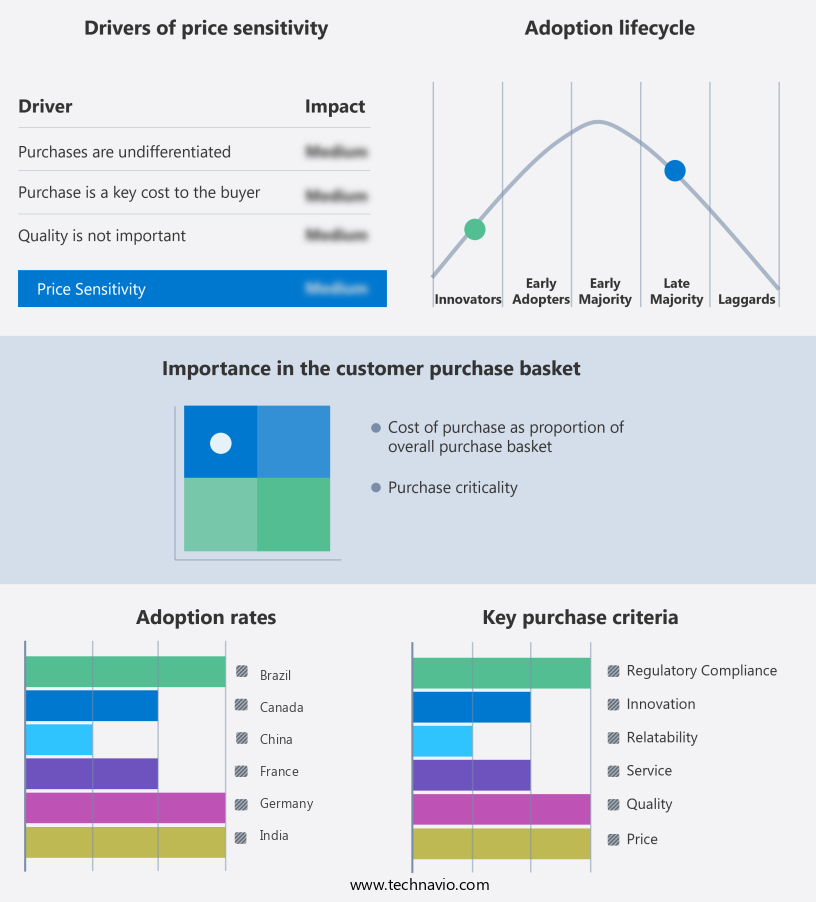
Exclusive Technavio Analysis on Customer Landscape
The extended reality (xr) market forecasting report includes the adoption lifecycle of the market, covering from the innovator's stage to the laggard's stage. It focuses on adoption rates in different regions based on penetration. Furthermore, the extended reality (xr) market report also includes key purchase criteria and drivers of price sensitivity to help companies evaluate and develop their market growth analysis strategies.
Customer Landscape of Extended Reality (XR) Industry
Competitive Landscape
Companies are implementing various strategies, such as strategic alliances, extended reality (xr) market forecast, partnerships, mergers and acquisitions, geographical expansion, and product/service launches, to enhance their presence in the industry.
3D Systems Corp. - The company introduces an innovative extended reality solution, insightARTHRO VR and AR, merging virtual and augmented technologies to enhance user experience in various industries. This cutting-edge offering bridges the gap between physical and digital worlds, offering unprecedented interaction and engagement.
The industry research and growth report includes detailed analyses of the competitive landscape of the market and information about key companies, including:
- 3D Systems Corp.
- ABB
- Accenture PLC
- Alphabet Inc.
- Canon Inc.
- HTC Corp.
- Intel Corp.
- Lenovo Group Ltd.
- Magic Leap Inc.
- Meta Platforms Inc.
- Microsoft Corp
- NVIDIA Corp.
- PTC Inc.
- Qualcomm Inc.
- Roper Technologies Inc.
- Seiko Epson Corp.
- SoftServe Inc.
- Sony Group Corp.
- Tata Sons Pvt. Ltd.
- VertexPlus Technologies Ltd.
Qualitative and quantitative analysis of companies has been conducted to help clients understand the wider business environment as well as the strengths and weaknesses of key industry players. Data is qualitatively analyzed to categorize companies as pure play, category-focused, industry-focused, and diversified; it is quantitatively analyzed to categorize companies as dominant, leading, strong, tentative, and weak.
Recent Development and News in Extended Reality (XR) Market
- In January 2024, Meta Platforms, Inc. (formerly Facebook), announced the launch of Meta Quest 3, an advanced XR headset, at the Consumer Electronics Show (CES). This device, featuring state-of-the-art graphics and AI capabilities, aimed to revolutionize the XR market (Meta Platforms Inc., 2024).
- In March 2024, Microsoft and Sony, two tech giants, joined forces to collaborate on developing XR content for their respective platforms, Microsoft Mixed Reality and PlayStation VR. This strategic partnership was expected to significantly expand the XR content library and attract more users to these platforms (Microsoft Corporation, 2024; Sony Corporation, 2024).
- In May 2024, Magic Leap, an XR startup, secured a USD300 million funding round, led by Qualcomm Ventures, to accelerate the development and commercialization of its spatial computing technology. This investment was a testament to the growing investor interest in the XR market (Magic Leap, 2024).
- In April 2025, Apple announced its entry into the XR market with the launch of Apple Glass, a pair of smart glasses that integrated XR technology. This move was expected to bring XR technology to the mainstream audience and potentially disrupt the market dynamics (Apple Inc., 2025).
Dive into Technavio's robust research methodology, blending expert interviews, extensive data synthesis, and validated models for unparalleled Extended Reality (XR) Market insights. See full methodology.
|
Market Scope |
|
|
Report Coverage |
Details |
|
Page number |
204 |
|
Base year |
2024 |
|
Historic period |
2019-2023 |
|
Forecast period |
2025-2029 |
|
Growth momentum & CAGR |
Accelerate at a CAGR of 64.5% |
|
Market growth 2025-2029 |
USD 1842.9 billion |
|
Market structure |
Fragmented |
|
YoY growth 2024-2025(%) |
49.1 |
|
Key countries |
US, China, Germany, UK, Japan, Canada, France, India, Brazil, and UAE |
|
Competitive landscape |
Leading Companies, Market Positioning of Companies, Competitive Strategies, and Industry Risks |
Research Analyst Overview
- In the ever-evolving landscape of Extended Reality (XR), innovation continues to unfold at an unprecedented pace. Integration of input devices, such as hand tracking technology and motion tracking systems, enhances user experience and interaction in XR environments. Remote collaboration tools, facilitated by AR SDKs and spatial audio processing, enable seamless communication and teamwork. Depth sensing cameras and object recognition APIs revolutionize the way we perceive and interact with virtual and real-world objects. Head-mounted displays and virtual reality headsets deliver immersive experiences, while game engine optimization and real-time rendering engines power visually stunning XR applications. Augmented reality overlays and avatar creation tools add a new dimension to communication and self-expression.
- Interactive storytelling and training simulation software leverage XR technology to create engaging and effective learning experiences. Virtual prototyping, environmental mapping, and 360-degree video capture offer innovative solutions for industries such as architecture, engineering, and construction. Mixed reality applications, human-computer interaction, and simulation development tools further expand the possibilities of XR technology. Computer vision algorithms and photogrammetry techniques enable advanced data visualization dashboards and location-based services. Haptic feedback devices and spatial audio processing add depth and realism to XR experiences, making them more engaging and immersive. The XR market is a dynamic and interconnected ecosystem, with each component influencing and enhancing the others.
- As these technologies continue to evolve, we can expect a future filled with increasingly advanced and interactive XR experiences.
What are the Key Data Covered in this Extended Reality (XR) Market Research and Growth Report?
-
What is the expected growth of the Extended Reality (XR) Market between 2025 and 2029?
-
USD 1842.9 billion, at a CAGR of 64.5%
-
-
What segmentation does the market report cover?
-
The report is segmented by Application (VR, AR, and MR), Component (Hardware and Software and services), Geography (North America, APAC, Europe, South America, and Middle East and Africa), End-user Industry (Education, Retail, Industrial & Manufacturing, Healthcare, Media & Entertainment, and Others), Enterprise Size (Large Enterprises and Small & Medium Enterprises), Device Type (Head-Mounted Displays (HMDs) and Mobile Devices), and Delivery Model (On-Premise and Cloud-Based)
-
-
Which regions are analyzed in the report?
-
North America, APAC, Europe, South America, and Middle East and Africa
-
-
What are the key growth drivers and market challenges?
-
Rapid improvements in sensor technology, Infrastructural and integration issues associated with extended reality (XR) solutions
-
-
Who are the major players in the Extended Reality (XR) Market?
-
3D Systems Corp., ABB, Accenture PLC, Alphabet Inc., Canon Inc., HTC Corp., Intel Corp., Lenovo Group Ltd., Magic Leap Inc., Meta Platforms Inc., Microsoft Corp, NVIDIA Corp., PTC Inc., Qualcomm Inc., Roper Technologies Inc., Seiko Epson Corp., SoftServe Inc., Sony Group Corp., Tata Sons Pvt. Ltd., and VertexPlus Technologies Ltd.
-
Market Research Insights
- The market encompasses a diverse range of technologies, including collaborative virtual reality platforms, augmented reality mobile applications, and mixed reality headsets. According to recent industry estimates, the global XR market is projected to reach USD209.2 billion by 2022, representing a significant compound annual growth rate of 43.8%. One key factor driving this growth is the increasing demand for real-time interaction and immersive experiences. For instance, edge computing solutions are becoming increasingly important to ensure sufficient processing power and display resolution for XR applications. In contrast, cloud computing infrastructure plays a crucial role in delivering high visual fidelity metrics and reducing network bandwidth requirements through streaming technologies.
- Mixed reality headsets, equipped with positional tracking and user authentication methods, offer a more immersive experience by providing sensory feedback systems and 3D spatial audio. However, these devices also present challenges, such as frame rate performance, input latency measurements, and motion sickness mitigation, which require ongoing advancements in XR hardware components and AI-powered features. Another significant trend is the integration of data security protocols and haptic suits to enhance user experience metrics and create a more realistic and engaging environment. With the continuous evolution of XR technology, it is essential to address the ever-increasing requirements for system performance benchmarks, user experience metrics, and content delivery networks to cater to the growing demands of businesses and consumers alike.
We can help! Our analysts can customize this extended reality (xr) market research report to meet your requirements.
 RIA -
RIA - 
