
Facilities Management Market Size 2025-2029
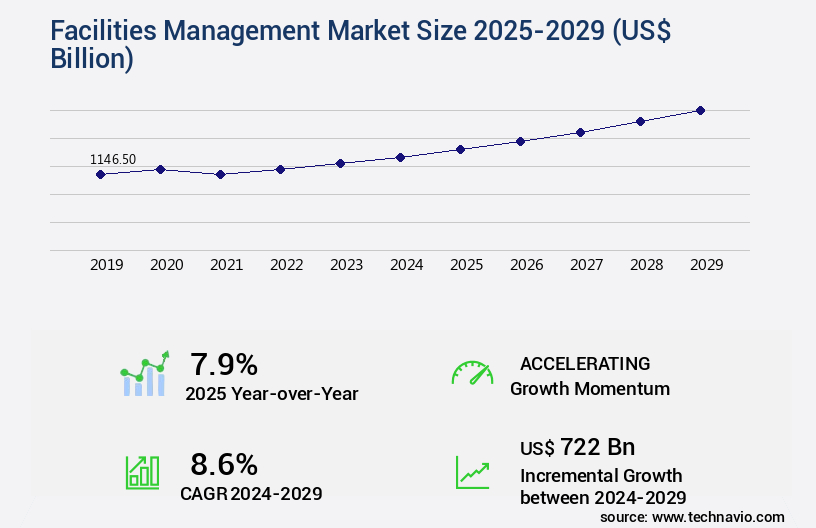
The facilities management market size is valued to increase by USD 722 billion, at a CAGR of 8.6% from 2024 to 2029. Increasing demand for cloud-based facilities management solutions will drive the facilities management market.
Major Market Trends & Insights
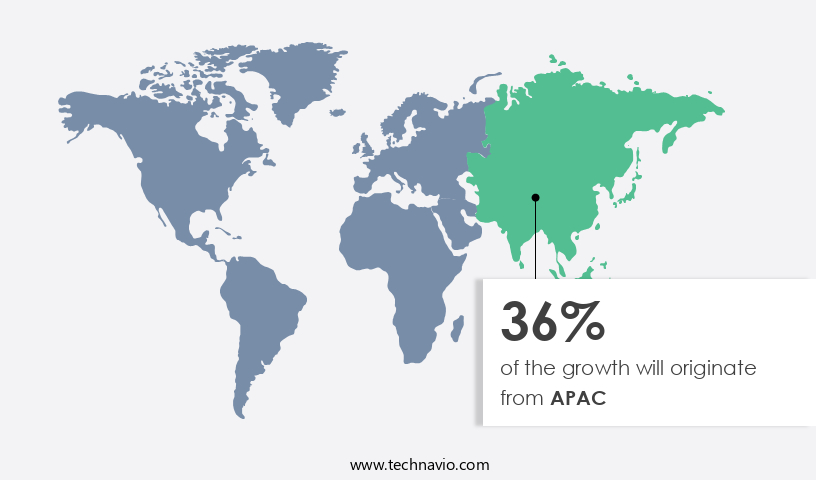
- APAC dominated the market and accounted for a 36% growth during the forecast period.
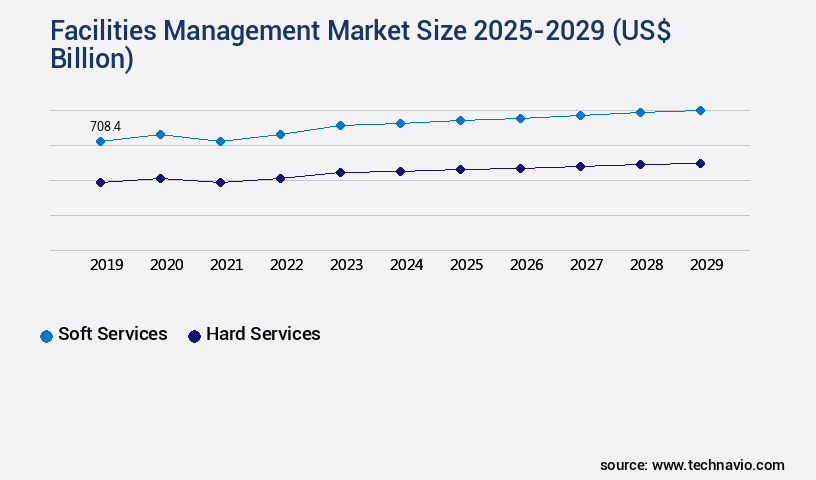
- By Service - Soft services segment was valued at USD 708.40 billion in 2023
- By End-user - Commercial segment accounted for the largest market revenue share in 2023
Market Size & Forecast
- Market Opportunities: USD 86.31 billion
- Market Future Opportunities: USD 722.00 billion
- CAGR : 8.6%
- APAC: Largest market in 2023
Market Summary
- The market encompasses a dynamic and ever-evolving landscape, driven by the increasing adoption of advanced technologies and shifting industry trends. Core technologies, such as Internet of Things (IoT) and cloud-based solutions, are revolutionizing facilities management, enabling real-time monitoring, predictive maintenance, and enhanced operational efficiency. According to recent reports, cloud-based facilities management solutions are expected to account for over 30% of the market share by 2025, underscoring their growing popularity. However, the market is not without challenges. Budgetary constraints and the need for regulatory compliance continue to pose significant hurdles for organizations.
- Despite these challenges, opportunities abound, particularly in the areas of energy management, sustainability, and integrated workplace management systems. As the industry continues to evolve, stakeholders must stay informed of the latest developments to remain competitive.
What will be the Size of the Facilities Management Market during the forecast period?
Get Key Insights on Market Forecast (PDF) Request Free Sample
How is the Facilities Management Market Segmented and what are the key trends of market segmentation?
The facilities management industry research report provides comprehensive data (region-wise segment analysis), with forecasts and estimates in "USD billion" for the period 2025-2029, as well as historical data from 2019-2023 for the following segments.
- Service
- Soft services
- Hard services
- End-user
- Commercial
- Government
- Residential
- Solution
- Integrated workplace management system
- Building information modeling
- Facility operations & security management
- Facility environment management
- Facility property management
- Geography
- North America
- US
- Canada
- Europe
- France
- Germany
- Italy
- UK
- APAC
- China
- India
- Japan
- South Korea
- Rest of World (ROW)
- North America
By Service Insights
The soft services segment is estimated to witness significant growth during the forecast period.
The market encompasses a range of services essential for maintaining and optimizing commercial and industrial buildings. Soft services, comprising housekeeping, transportation, catering, and security, currently account for a significant market share. The affordability and minimal technical expertise needed to deliver soft services enable providers like OCS Group International Ltd. And Serco Group Plc to offer these services at scale. Housekeeping services focus on maintaining a clean and hygienic environment, while transportation services manage fleet operations and goods delivery. Catering services provide food facilities for employees, visitors, and special occasions. Security services encompass surveillance systems, alarms, and guarding facilities.
Soft services contribute significantly to enhancing the occupants' experience by ensuring a pleasant and comfortable environment. In terms of future growth, the market anticipates a substantial expansion in the adoption of sustainability reporting metrics, emergency management planning, and smart building technologies. Lifecycle cost analysis, maintenance management software, building codes compliance, preventive maintenance schedules, and building performance data are increasingly becoming crucial factors in facilities management. The integration of computer-aided facility management, building automation systems, property portfolio management, facility condition assessments, facility security systems, remote facility monitoring, and tenant experience management is also on the rise.
Moreover, sustainability initiatives, real-time facility monitoring, capital planning software, access control systems, energy efficiency audits, space optimization techniques, space management software, and asset management software are gaining traction in the industry. The market's evolution is driven by the need for energy efficiency, improved occupant comfort, and enhanced safety and security measures. In conclusion, the market is undergoing continuous growth and transformation, with a focus on enhancing the overall performance and sustainability of buildings. The integration of advanced technologies and services is paving the way for a more efficient, cost-effective, and eco-friendly approach to facilities management.
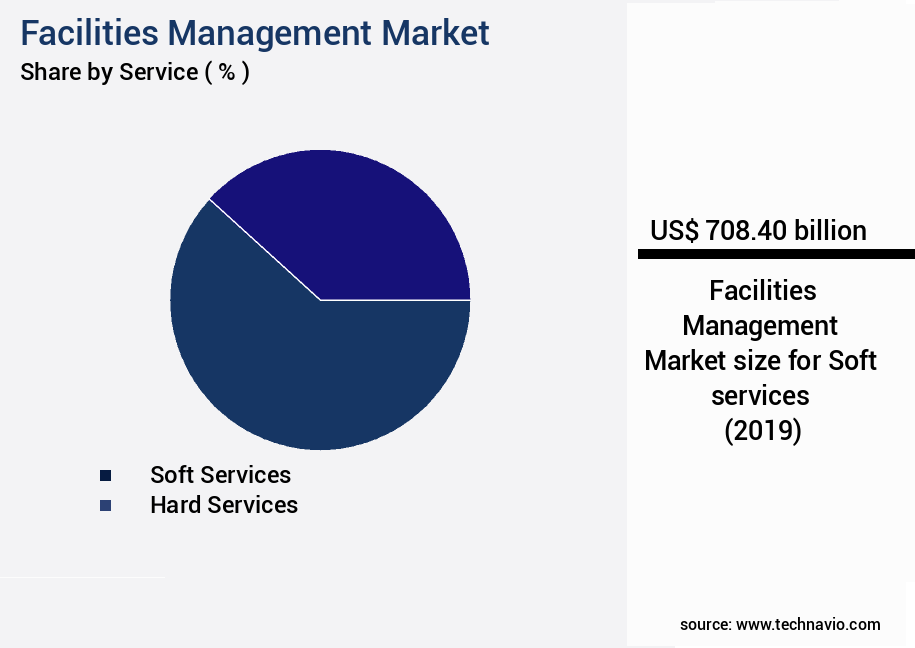
The Soft services segment was valued at USD 708.40 billion in 2019 and showed a gradual increase during the forecast period.
Regional Analysis
APAC is estimated to contribute 36% to the growth of the global market during the forecast period.Technavio's analysts have elaborately explained the regional trends and drivers that shape the market during the forecast period.
See How Facilities Management Market Demand is Rising in APAC Request Free Sample
The market in North America is experiencing consistent expansion as businesses increasingly outsource these services to specialized professionals. This trend enables organizations to concentrate on their core competencies while optimizing the management of their physical assets. Advanced technologies, including Internet of Things (IoT), sensors, and data analytics, are revolutionizing facilities management. Smart building solutions and predictive maintenance technologies improve operational efficiency, reduce costs, and enhance overall performance.
The transition to flexible workspaces, remote work, and agile office environments necessitates adaptive facilities management strategies. By leveraging the expertise of facilities management experts and embracing innovative technologies, companies can ensure their physical infrastructure supports their evolving business needs.
Market Dynamics
Our researchers analyzed the data with 2024 as the base year, along with the key drivers, trends, and challenges. A holistic analysis of drivers will help companies refine their marketing strategies to gain a competitive advantage.
The market is experiencing significant growth as businesses prioritize implementing advanced solutions to optimize their operations and enhance the overall tenant experience. One of the key trends driving this market's expansion is the adoption of building automation systems, which enable efficient energy management and improve indoor air quality monitoring. These systems are increasingly being optimized through the use of IoT sensors for facility data and predictive maintenance using machine learning algorithms. Moreover, space management software is becoming essential for businesses seeking cost-effective asset management strategies and effective building commissioning procedures. In fact, more than 70% of new product developments in this space focus on improving real-time facility performance monitoring and analyzing building performance data to drive data-driven decision making.
The importance of sustainability is another significant trend in the market. Implementing sustainable facility practices, such as advanced facility security systems and developing sustainability reporting metrics, is becoming a priority for businesses seeking to reduce their carbon footprint and enhance their brand reputation. Additionally, effective emergency response planning and improving building codes compliance are critical aspects of facilities management that are receiving increased attention. Streamlining work order management systems is another area of focus for businesses, with cost-effective asset management strategies and effective capital planning software becoming increasingly important. The industrial application segment accounts for a significantly larger share of the market compared to the academic segment, highlighting the growing importance of this trend in the business world.
In conclusion, the market is undergoing a transformation as businesses seek to optimize their operations, enhance tenant experiences, and reduce costs through advanced technology solutions. The adoption of building automation systems, IoT sensors, and predictive maintenance using machine learning are just a few of the trends driving this growth. By focusing on data-driven decision making, effective emergency response planning, and improving building codes compliance, businesses can stay ahead of the curve and gain a competitive edge in their industries.
What are the key market drivers leading to the rise in the adoption of Facilities Management Industry?
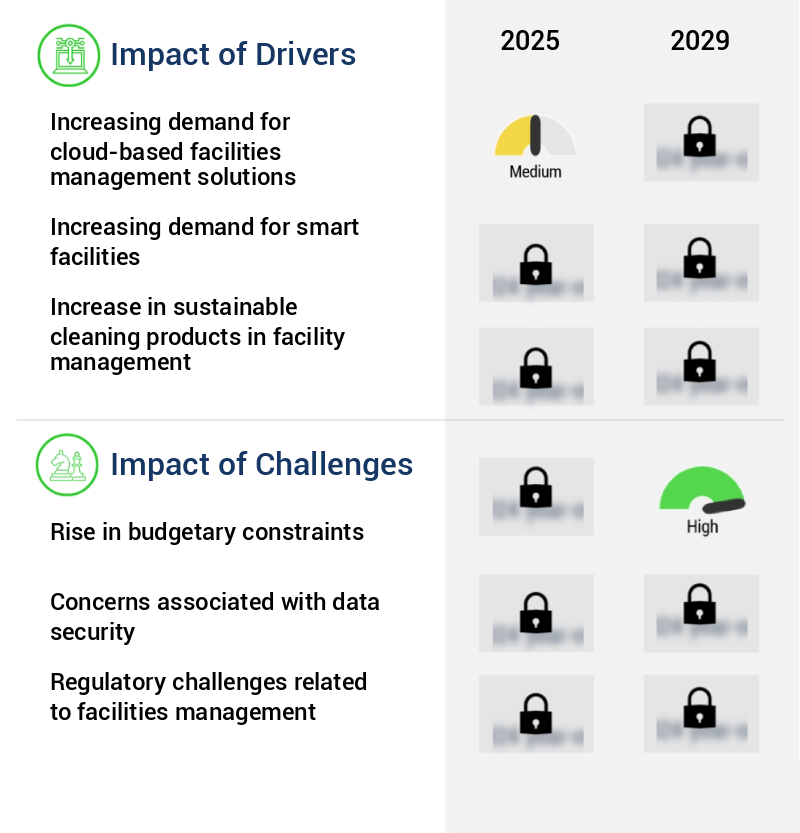
- The significant surge in demand for cloud-based facilities management solutions serves as the primary market driver.
- The market experiences a growing demand for advanced, technology-driven solutions, leading to an increasing adoption of cloud computing in this sector. Cloud-based facilities management systems facilitate the integration of services, enhancing security and collaboration among teams and subsidiaries in multiple locations. This results in cost savings for organizations. Cloud solutions provide secure hosting for critical data, offering benefits such as enhanced security, scalability, and quicker disaster recovery. The shift towards cloud-based facilities management solutions is driven by the need for flexibility, reliability, and the ability to access real-time data from anywhere. These solutions enable companies to streamline their operations, improve efficiency, and make data-driven decisions, ultimately contributing to overall business growth.
- Cloud-based facilities management systems offer numerous advantages over traditional on-premises solutions. They provide seamless integration with other business applications, allowing for a unified approach to managing various aspects of facilities management. Additionally, these solutions offer easy upgrades and maintenance, ensuring that organizations always have access to the latest features and functionalities. In conclusion, the market continues to evolve, with cloud-based solutions gaining significant traction due to their numerous advantages. Companies across various industries are recognizing the benefits of cloud-based facilities management systems, leading to increased adoption and innovation in this sector.
What are the market trends shaping the Facilities Management Industry?
- The IoT's adoption in facilities management represents the latest market trend. This advancement in technology significantly influences the facilities management industry.
- The market witnesses a significant shift towards smart solutions, fueled by technological innovations such as the Internet of Things (IoT) and Industry 4.0. IoT networks consist of various devices, including sensors, thermostats, and actuators, interconnected over the Internet. These devices collect and evaluate data, enabling energy savings and reducing task requirements. Furthermore, IoT facilitates predictive maintenance, utilizing real-time data and equipment condition monitoring to predict potential failures.
- This proactive approach results in cost savings and enhanced productivity. The integration of IoT and Industry 4.0 in facilities management signifies a continuous evolution, transforming traditional practices and offering numerous benefits.
What challenges does the Facilities Management Industry face during its growth?
- Budgetary constraints pose a significant challenge to the industry, limiting its growth potential.
- Small businesses in growing economies frequently encounter budget limitations, compelling them to seek facilities management services from less established providers. This decision can lead to subpar services, resulting in increased maintenance and operational expenses, negatively impacting a company's profitability. Another significant challenge for the market is escalating labor costs, particularly in the North American region. These trends underscore the importance of balancing cost considerations with the need for reliable and efficient facilities management solutions.
- Organizations must carefully evaluate potential service providers and explore innovative approaches to optimize their facilities management budgets. By doing so, they can mitigate the risks associated with low-quality services and effectively manage their operational expenses.
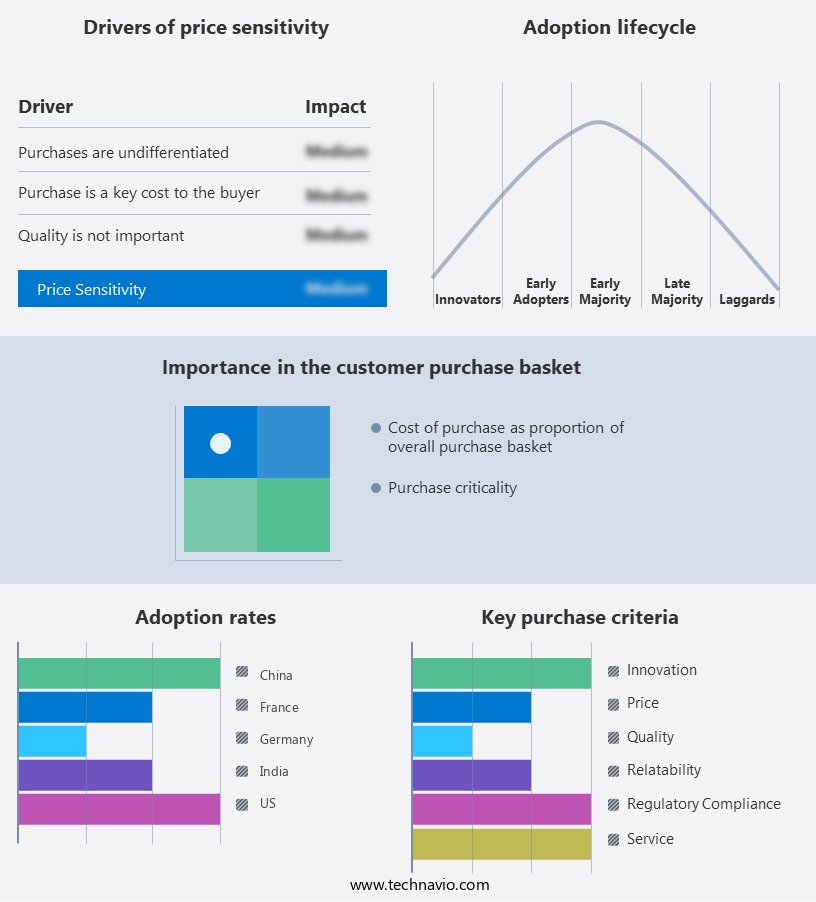
Exclusive Technavio Analysis on Customer Landscape
The facilities management market forecasting report includes the adoption lifecycle of the market, covering from the innovator's stage to the laggard's stage. It focuses on adoption rates in different regions based on penetration. Furthermore, the facilities management market report also includes key purchase criteria and drivers of price sensitivity to help companies evaluate and develop their market growth analysis strategies.
Customer Landscape of Facilities Management Industry
Competitive Landscape
Companies are implementing various strategies, such as strategic alliances, facilities management market forecast, partnerships, mergers and acquisitions, geographical expansion, and product/service launches, to enhance their presence in the industry.
ABM Industries Inc. - This company specializes in comprehensive facilities management solutions, encompassing electrical testing, performance contracting, Good Manufacturing Practice (GMP) cleaning, seasonal floral programs, mobile HVAC services, HVAC retrofits, and continuous facility operation services (24/7 or 365 days a year). These offerings aim to optimize operational efficiency and ensure the highest standards of maintenance for clients.
The industry research and growth report includes detailed analyses of the competitive landscape of the market and information about key companies, including:
- ABM Industries Inc.
- Aramark
- CBRE Group Inc.
- Compass Group PLC
- Coor Service Management Holding AB
- Cushman and Wakefield Plc
- Dussmann Group
- EMCOR Group Inc.
- G4S plc
- ISS AS
- Johnson Controls International Plc
- Jones Lang LaSalle Inc.
- Mitie Group Plc
- OCS Group International Ltd.
- Quess Corp. Ltd
- Securitas AG
- Serco Group Plc
- Sodexo SA
- Tenon Group
- The Brinks Co.
- Veolia Environment
Qualitative and quantitative analysis of companies has been conducted to help clients understand the wider business environment as well as the strengths and weaknesses of key industry players. Data is qualitatively analyzed to categorize companies as pure play, category-focused, industry-focused, and diversified; it is quantitatively analyzed to categorize companies as dominant, leading, strong, tentative, and weak.
Recent Development and News in Facilities Management Market
- In January 2024, IBM announced the acquisition of Asperitas, a Dutch company specializing in edge computing technology for buildings and data centers, to strengthen its hybrid cloud and AI offerings in the market (IBM Press Release, 2024).
- In March 2024, Siemens and Microsoft entered into a strategic partnership to integrate Siemens' MindSphere IoT platform with Microsoft's Azure cloud services, enabling advanced analytics and AI capabilities for building management and predictive maintenance in the facilities management industry (Microsoft News Center, 2024).
- In May 2024, Schneider Electric completed a USD1.6 billion acquisition of APC by Schneider Electric, expanding its presence in the critical power and cooling segment of the market (Schneider Electric Press Release, 2024).
- In April 2025, Johnson Controls International and Honeywell International announced a merger agreement, creating a leading global provider of building technologies and sustainable solutions in the market, with an estimated combined revenue of USD30 billion (Johnson Controls International Press Release, 2025).
Dive into Technavio's robust research methodology, blending expert interviews, extensive data synthesis, and validated models for unparalleled Facilities Management Market insights. See full methodology.
|
Market Scope |
|
|
Report Coverage |
Details |
|
Page number |
206 |
|
Base year |
2024 |
|
Historic period |
2019-2023 |
|
Forecast period |
2025-2029 |
|
Growth momentum & CAGR |
Accelerate at a CAGR of 8.6% |
|
Market growth 2025-2029 |
USD 722 billion |
|
Market structure |
Fragmented |
|
YoY growth 2024-2025(%) |
7.9 |
|
Key countries |
US, China, India, Germany, Canada, France, Japan, UK, Italy, and South Korea |
|
Competitive landscape |
Leading Companies, Market Positioning of Companies, Competitive Strategies, and Industry Risks |
Research Analyst Overview
- In the dynamic and evolving the market, sustainability reporting metrics have gained significant traction as businesses strive to minimize their environmental footprint. Emergency management planning is another crucial aspect, ensuring preparedness for unforeseen events. Lifecycle cost analysis plays a pivotal role in optimizing facility investments, with maintenance management software streamlining processes and enhancing efficiency. Building codes compliance is a continuous concern, as regulations evolve to prioritize safety and energy efficiency. Smart building technologies, such as occupancy sensors and computer-aided facility management systems, enable real-time monitoring and automated responses. Building automation systems and property portfolio management tools facilitate centralized control and optimization of energy usage.
- Facility condition assessments, sustainability initiatives, and energy management systems contribute to improved building performance data. Preventive maintenance schedules and capital planning software help minimize downtime and reduce repair costs. Facility security systems and remote facility monitoring ensure safety and peace of mind, while access control systems and tenant experience management enhance occupant satisfaction. LEED certification strategies and space optimization techniques further boost a building's value and competitiveness. The integration of energy efficiency audits, space management software, asset management software, and real-time facility monitoring tools empowers facilities managers to make data-driven decisions, ultimately driving operational excellence and cost savings.
What are the Key Data Covered in this Facilities Management Market Research and Growth Report?
-
What is the expected growth of the Facilities Management Market between 2025 and 2029?
-
USD 722 billion, at a CAGR of 8.6%
-
-
What segmentation does the market report cover?
-
The report segmented by Service (Soft services and Hard services), End-user (Commercial, Government, and Residential), Geography (North America, APAC, Europe, South America, and Middle East and Africa), and Solution (Integrated workplace management system, Building information modeling, Facility operations & security management, Facility environment management, and Facility property management)
-
-
Which regions are analyzed in the report?
-
North America, APAC, Europe, South America, and Middle East and Africa
-
-
What are the key growth drivers and market challenges?
-
Increasing demand for cloud-based facilities management solutions, Rise in budgetary constraints
-
-
Who are the major players in the Facilities Management Market?
-
Key Companies ABM Industries Inc., Aramark, CBRE Group Inc., Compass Group PLC, Coor Service Management Holding AB, Cushman and Wakefield Plc, Dussmann Group, EMCOR Group Inc., G4S plc, ISS AS, Johnson Controls International Plc, Jones Lang LaSalle Inc., Mitie Group Plc, OCS Group International Ltd., Quess Corp. Ltd, Securitas AG, Serco Group Plc, Sodexo SA, Tenon Group, The Brinks Co., and Veolia Environment
-
Market Research Insights
- The market encompasses a range of solutions and services aimed at optimizing building operations and enhancing sustainability. Two key areas of growth are work order automation and space utilization analysis. According to industry estimates, the global market for work order automation is projected to reach USD6.5 billion by 2025, up from USD3.2 billion in 2020. Meanwhile, the importance of space utilization analysis is underscored by the fact that businesses can save up to 30% on real estate costs by optimizing their office space. Another critical aspect of facilities management is lease management software, which streamlines the process of tracking lease information and managing tenant communications.
- Building commissioning processes, smart building sensors, and sustainability compliance are also essential components, with energy consumption tracking and water conservation measures becoming increasingly important in the context of green building design. Asset performance tracking, HVAC system optimization, and emergency response systems are key to maintaining facility operations efficiency and ensuring risk management strategies are effective. In addition, facility data analytics, renewable energy integration, and capital expenditure planning are increasingly important as buildings become more complex and interconnected, with lighting control systems, building code compliance, and security system integration all playing vital roles. Waste management programs and building automation protocols further contribute to the overall effectiveness of facilities management solutions.
We can help! Our analysts can customize this facilities management market research report to meet your requirements.
 RIA -
RIA - 
