
Fast Fashion Market Size 2025-2029
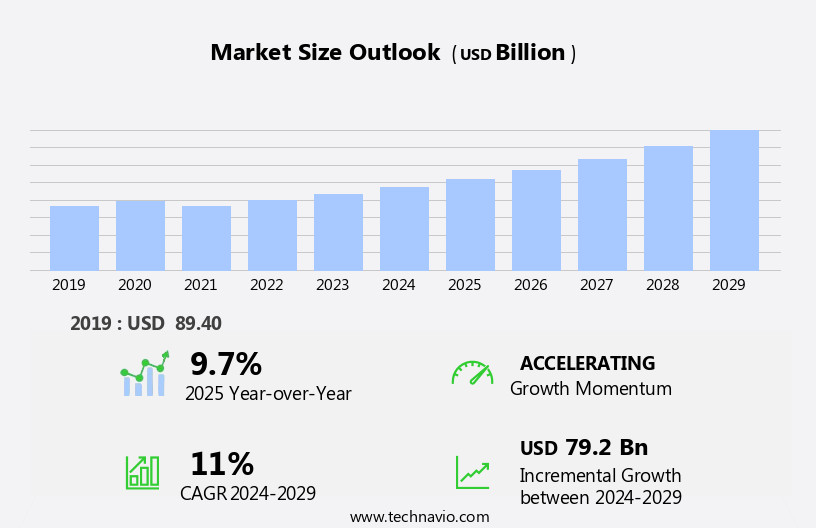
The fast fashion market size is forecast to increase by USD 79.2 billion, at a CAGR of 11% between 2024 and 2029.
- The market is experiencing significant growth, driven by the burgeoning youth populations' increasing demand for affordable and trendy clothing. This demographic's preference for fashionable apparel that reflects current trends is fueling market expansion. Another key driver is the rise in social media marketing, enabling brands to reach a broader audience and engage consumers effectively. However, the market faces challenges, including the availability of counterfeit fast fashion products.
- These imitations not only threaten brand reputation but also undermine consumer trust, necessitating robust intellectual property protection strategies. Companies must navigate these challenges while continuing to innovate and cater to evolving consumer preferences to capitalize on the market's potential.
What will be the Size of the Fast Fashion Market during the forecast period?
Get Key Insights on Market Forecast (PDF)
Request Free Sample
- The market continues to evolve at an unprecedented pace, driven by technological advancements and shifting consumer preferences. Digital pattern making and AI-powered design assistance streamline the product development process, enabling brands to bring new styles to market faster than ever before. E-commerce logistics and rapid prototyping techniques facilitate quick turnaround times, while sustainable textile sourcing and just-in-time inventory management help minimize waste. Lean manufacturing principles and virtual fashion prototyping enable mass customization through on-demand manufacturing and automated quality control. RFID tracking systems and apparel lifecycle management optimize inventory levels and reduce markdowns. Consumer behavior modeling and data-driven trend forecasting inform strategic decisions, while collaborative design platforms foster innovation and efficiency.
- Circular fashion models and smart garment technology promote sustainability and reduce textile waste. Global sourcing strategies and flexible production lines ensure a steady supply of raw materials and finished goods. Ethical production practices and wearable sensor integration enhance transparency and accountability. For instance, a leading fashion brand implemented an AI-powered inventory management system, resulting in a 20% reduction in stockouts and a 15% increase in sales. Industry growth is expected to reach double-digit percentages in the coming years, fueled by these evolving market dynamics.
How is this Fast Fashion Industry segmented?
The fast fashion industry research report provides comprehensive data (region-wise segment analysis), with forecasts and estimates in "USD billion" for the period 2025-2029, as well as historical data from 2019-2023 for the following segments.
- Gender
- Female
- Male
- Distribution Channel
- Offline
- Online
- Product Type
- Apparel
- Footwear
- Accessories
- Consumer Demographics
- Adults
- Teen
- Kids
- Geography
- North America
- US
- Canada
- Europe
- France
- Germany
- Italy
- UK
- Middle East and Africa
- UAE
- APAC
- China
- India
- Japan
- South America
- Brazil
- Rest of World (ROW)
- North America
By Gender Insights
The female segment is estimated to witness significant growth during the forecast period.
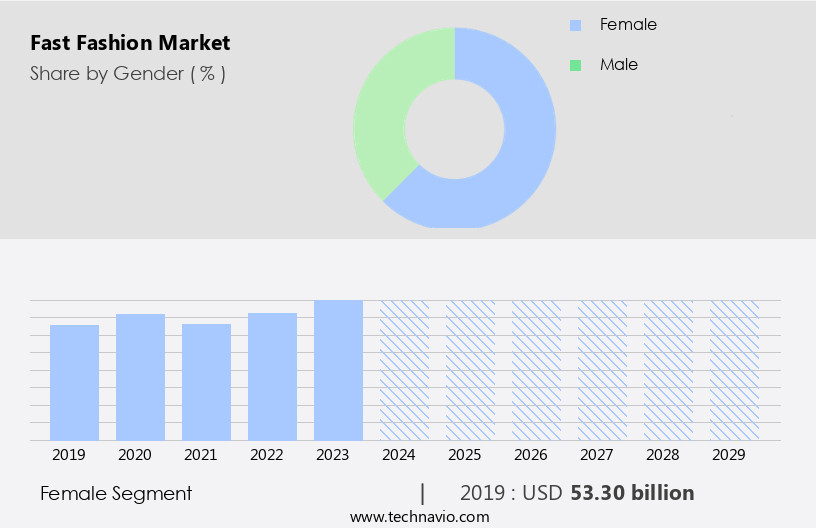
The Female segment was valued at USD 53.30 billion in 2019 and showed a gradual increase during the forecast period.
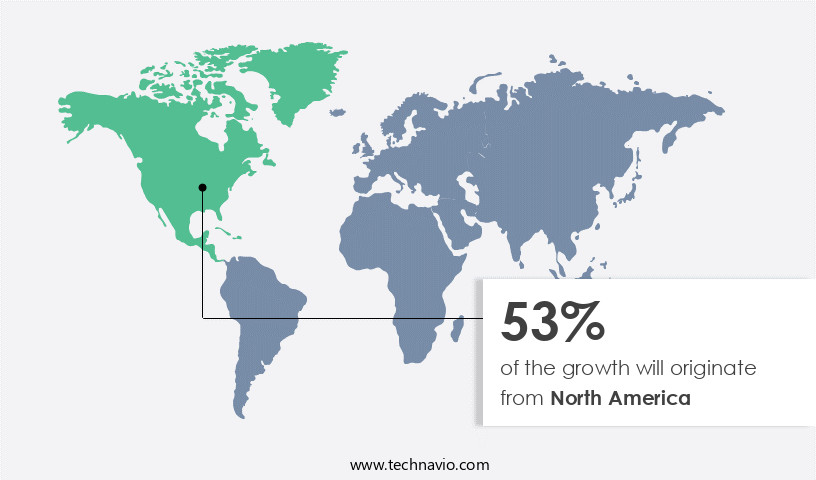
Regional Analysis
North America is estimated to contribute 53% to the growth of the global market during the forecast period. Technavio's analysts have elaborately explained the regional trends and drivers that shape the market during the forecast period.
See How fast fashion market Demand is Rising in North America Request Free Sample
In the dynamic world of fast fashion, North America continues to be a significant market, fueled by a large population, rising income levels, and shifting consumer preferences. The region's fast fashion landscape is characterized by various innovative technologies and practices. Digital pattern making and AI-powered design assistance streamline the design process, enabling quick trend diffusion. E-commerce logistics and on-demand manufacturing ensure rapid delivery and customization. Sustainable textile sourcing and ethical production practices address growing consumer concerns. The market's fragmented nature is further shaped by flexible production lines and collaborative design platforms, enabling mass customization and quick response manufacturing.
Virtual try-on applications and data-driven trend forecasting cater to evolving consumer behavior. The industry anticipates a substantial growth rate, with customer preference analytics and RFID tracking systems playing crucial roles in inventory management and supply chain optimization. One notable example of this evolution is the implementation of virtual fashion prototyping and automated quality control systems by a leading fast fashion brand, resulting in a 30% reduction in production time and a 20% increase in sales. This innovative approach underscores the industry's commitment to adapting to consumer demands and staying competitive.
Market Dynamics
Our researchers analyzed the data with 2024 as the base year, along with the key drivers, trends, and challenges. A holistic analysis of drivers will help companies refine their marketing strategies to gain a competitive advantage.
The market continues to evolve, driven by consumer demand for affordable and trendy clothing. However, the industry's environmental impact has become a significant concern, leading to a growing emphasis on sustainable practices. Brands are adopting eco-friendly sourcing and production methods, such as using organic cotton and recycled materials, to reduce their carbon footprint. Technology plays a pivotal role in the fast fashion supply chain, from digitalization in production to optimization of logistics networks. Benefits of digitalization include increased efficiency, reduced waste, and faster time-to-market. AI and automation are also being applied in design and manufacturing, enabling personalized production and customization at scale. Implementing circularity in fast fashion remains a challenge, as the industry's linear business model is not conducive to a closed-loop system. However, advances in 3D printing for apparel production and textile recycling technologies offer promising solutions. Data analytics is essential for informed decision-making in fast fashion, providing insights into consumer behavior and trends. Global collaborations for ethical practices and sustainable sourcing are also on the rise, as brands seek to enhance their brand identity and reputation. E-commerce strategies and digital marketing techniques are crucial for success in the market. Effective inventory management and measuring the environmental impact of production are also key considerations. Consumer feedback plays a vital role in design, ensuring that fast fashion remains responsive to evolving trends and preferences. Future trends in fast fashion technology include the use of virtual reality in design and production, enabling more accurate and efficient prototyping and customization. Sustainability and ethical practices will continue to be a priority, with a focus on reducing waste and minimizing the environmental impact of production.
What are the key market drivers leading to the rise in the adoption of Fast Fashion Industry?
- The burgeoning youth population significantly drives the market demand for fast fashion clothing, making it a key growth factor in this industry.
- Fast fashion refers to clothing designs that rapidly move from runways to retail stores to capitalize on current trends. Fashion Week and celebrity wear serve as frequent inspirations for these collections. Production methods in the fast fashion industry utilize trend replication and low-quality materials, such as synthetic fabrics, to create affordable, trendy pieces. This has led to an industry-wide shift towards increased consumption. Several mass-market brands, including Zara, H&M, and Forever 21, are prominent players in the fast fashion sector.
- According to industry reports, The market is expected to grow by 8% annually, reaching a value of USD 251.7 billion by 2023. For instance, a fast fashion brand experienced a 10% sales increase by introducing a new trend-driven collection within two weeks of its debut on the runway.
What are the market trends shaping the Fast Fashion Industry?
- Social media marketing is experiencing significant growth. This trend is mandatory for businesses seeking to expand their online presence.
- The market has witnessed significant transformation through the increasing influence of social media platforms, particularly Instagram. With over 30% of the world's internet users, approximately 2 billion monthly active users, Instagram's visually driven content has become a powerful tool for fast fashion brands to connect with consumers, shape trends, and influence purchasing decisions. Brands utilize this platform to showcase their latest collections, engage with followers, and foster a sense of community. Influencers and fashion bloggers play a pivotal role in amplifying brand messages, offering real-time product reviews, and demonstrating how clothing fits into everyday lifestyles.
- According to recent industry reports, the fast fashion sector is projected to grow by more than 10% within the next few years, reflecting the market's robust potential.
What challenges does the Fast Fashion Industry face during its growth?
- The proliferation of counterfeit fast fashion products poses a significant challenge to the industry's growth, undermining brand reputation and consumer trust.
- The market faces challenges from the prevalence of counterfeit products, contributing to market fragmentation. This fragmentation results in an unbalanced competitive landscape, inconsistent pricing, and market share loss for established brands. Counterfeit fast fashion brands, which compromise on quality and durability, offer lower prices to attract consumers. This affordability is particularly appealing to those with lower incomes. However, the low cost of these imitation products poses a significant hurdle for major fast fashion competitors, making it difficult for them to penetrate the market effectively.
- Furthermore, the proliferation of counterfeit products can blur the lines between original and fake brands, potentially misleading consumers. According to industry reports, The market is projected to grow by over 10% annually in the coming years, indicating significant potential for both authentic and counterfeit brands.
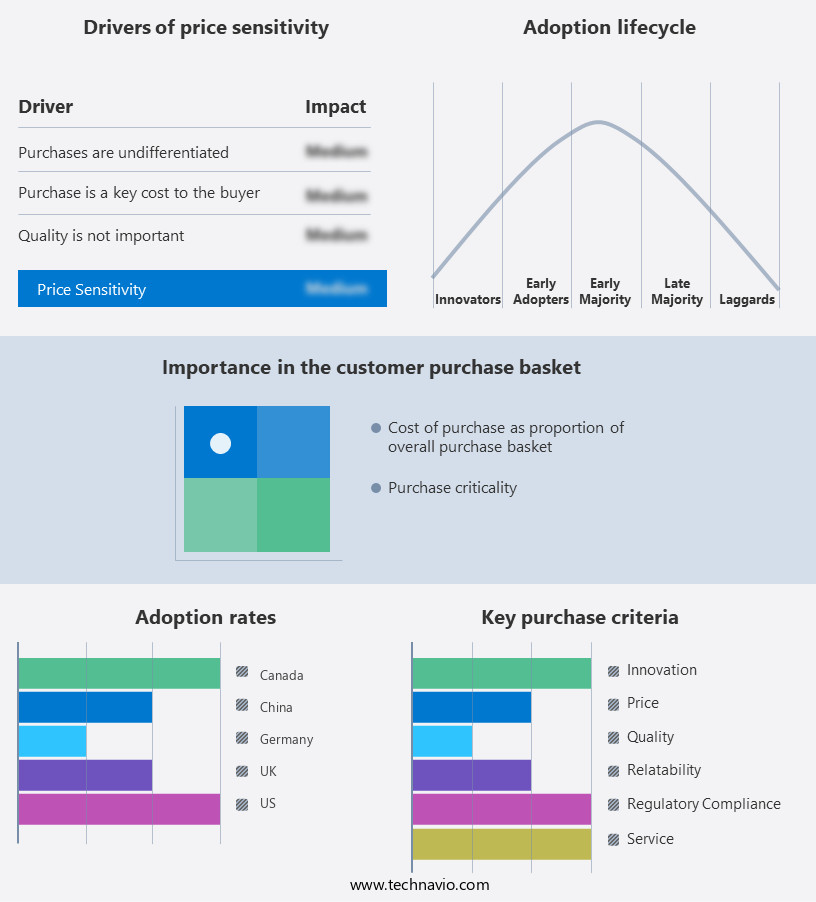
Exclusive Customer Landscape
The fast fashion market forecasting report includes the adoption lifecycle of the market, covering from the innovator's stage to the laggard's stage. It focuses on adoption rates in different regions based on penetration. Furthermore, the fast fashion market report also includes key purchase criteria and drivers of price sensitivity to help companies evaluate and develop their market growth analysis strategies.
Customer Landscape
Key Companies & Market Insights
Companies are implementing various strategies, such as strategic alliances, fast fashion market forecast, partnerships, mergers and acquisitions, geographical expansion, and product/service launches, to enhance their presence in the industry.
Aditya Birla Management Corp. Pvt. Ltd. - This global fashion retailer encompasses various fast fashion brands, including Never Fully Dressed, Monki, Topshop, Collusion, and Weekday.
The industry research and growth report includes detailed analyses of the competitive landscape of the market and information about key companies, including:
- Aditya Birla Management Corp. Pvt. Ltd.
- ARCADIA SRL
- ASOS Plc
- BESTSELLER AS
- boohoo.com UK Ltd.
- C and A Mode GmbH and Co KG
- Conde Nast
- Cotton On Group
- Esprit Holdings Ltd.
- Fast Retailing Co. Ltd.
- Forever21 Inc.
- H and M Hennes and Mauritz GBC AB
- Industria de Diseno Textil SA
- New Look Retailers Ltd.
- Primark Stores Ltd.
- PUNTO FA SL
- Reliance Industries Ltd.
- River Island
- The Gap Inc.
- Victorias Secret and Co.
Qualitative and quantitative analysis of companies has been conducted to help clients understand the wider business environment as well as the strengths and weaknesses of key industry players. Data is qualitatively analyzed to categorize companies as pure play, category-focused, industry-focused, and diversified; it is quantitatively analyzed to categorize companies as dominant, leading, strong, tentative, and weak.
Recent Development and News in Fast Fashion Market
- In January 2024, H&M, the Swedish fast fashion retailer, announced the launch of its new sustainable denim collection, "Conscious Denim," made using recycled and organic materials. This initiative was part of the company's continued commitment to reducing its environmental impact (H&M Press Release, 2024).
- In March 2024, Inditex, the parent company of Zara, signed a strategic partnership with Google Cloud to implement advanced analytics and AI solutions across its supply chain and retail operations. This collaboration aimed to improve inventory management, enhance customer experience, and optimize logistics (Inditex Press Release, 2024).
- In May 2024, Shein, the Chinese fast fashion e-commerce giant, raised USD 1 billion in a Series F funding round led by Coatue Management and Sequoia Capital China. This investment brought the company's valuation to USD 47 billion, making it the most valuable private fashion retailer in the world (TechCrunch, 2024).
- In April 2025, the European Union introduced new regulations on sustainable textiles, requiring fast fashion brands to disclose the environmental impact of their products and implement more sustainable production methods. This initiative aimed to reduce the fashion industry's carbon footprint and promote transparency (European Commission Press Release, 2025).
Research Analyst Overview
- The market for fast fashion continues to evolve, driven by advancements in technology and shifting consumer preferences. Companies are investing in customer relationship management systems to better understand and engage with their customer base, leading to increased sales. For instance, a leading fast fashion retailer reported a 15% increase in online sales following the implementation of a personalized shopping experience. Production cost optimization through the integration of fashion design software and CAD systems is another area of focus, enabling designers to create and test designs more efficiently. Retail analytics dashboards provide valuable insights into sales trends and consumer behavior, enabling market share maximization.
- Social compliance auditing and labor standards adherence are also critical components of the fast fashion landscape, as consumers increasingly demand transparency. Sustainable dyeing processes and environmental impact assessments are gaining importance, with many brands embracing agile design methodology to reduce waste and improve efficiency. Virtual fitting rooms and online brand reputation management are essential in the digital age, as consumers turn to social media for product recommendations and reviews. The fast fashion industry is expected to grow by 6% annually, driven by trends such as influencer marketing campaigns, smart fabrics development, and factory automation upgrades.
- Effective supply chain traceability, efficient distribution channels, and e-commerce platform optimization are key to maintaining a competitive advantage. Global trade regulations and online fashion marketplaces continue to shape the industry, with brands adapting to the evolving retail landscape.
Dive into Technavio's robust research methodology, blending expert interviews, extensive data synthesis, and validated models for unparalleled Fast Fashion Market insights. See full methodology.
|
Market Scope |
|
|
Report Coverage |
Details |
|
Page number |
199 |
|
Base year |
2024 |
|
Historic period |
2019-2023 |
|
Forecast period |
2025-2029 |
|
Growth momentum & CAGR |
Accelerate at a CAGR of 11% |
|
Market growth 2025-2029 |
USD 79.2 billion |
|
Market structure |
Fragmented |
|
YoY growth 2024-2025(%) |
9.7 |
|
Key countries |
US, Canada, China, UK, India, Germany, France, Japan, Italy, Brazil, UAE, and Rest of World |
|
Competitive landscape |
Leading Companies, Market Positioning of Companies, Competitive Strategies, and Industry Risks |
What are the Key Data Covered in this Fast Fashion Market Research and Growth Report?
- CAGR of the Fast Fashion industry during the forecast period
- Detailed information on factors that will drive the growth and forecasting between 2025 and 2029
- Precise estimation of the size of the market and its contribution of the industry in focus to the parent market
- Accurate predictions about upcoming growth and trends and changes in consumer behaviour
- Growth of the market across North America, Europe, APAC, Middle East and Africa, and South America
- Thorough analysis of the market's competitive landscape and detailed information about companies
- Comprehensive analysis of factors that will challenge the fast fashion market growth of industry companies
We can help! Our analysts can customize this fast fashion market research report to meet your requirements.