Fire Sprinkler Systems Market Size 2026-2030
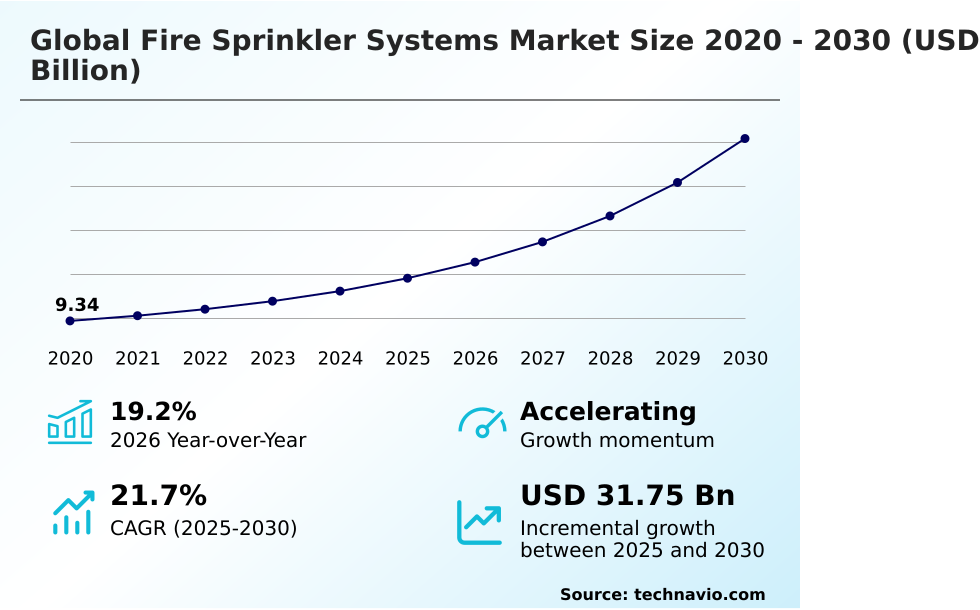
The fire sprinkler systems market size is valued to increase by USD 31.75 billion, at a CAGR of 21.7% from 2025 to 2030. Regulatory enforcement and safety compliance will drive the fire sprinkler systems market.
Major Market Trends & Insights
- APAC dominated the market and accounted for a 50.2% growth during the forecast period.
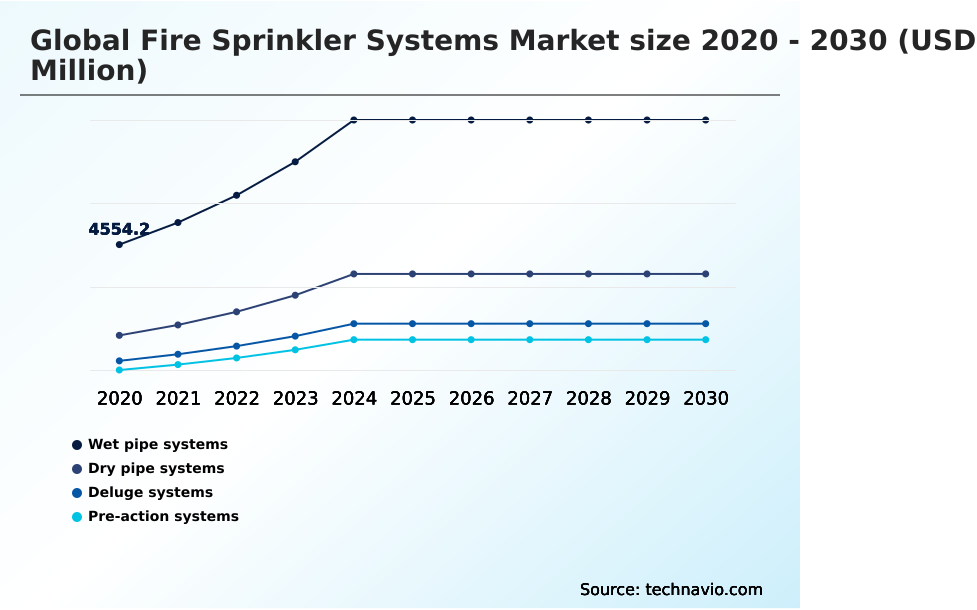
- By Product - Wet pipe systems segment was valued at USD 7.88 billion in 2024
- By End-user - Commercial segment accounted for the largest market revenue share in 2024
Market Size & Forecast
- Market Opportunities: USD 41.46 billion
- Market Future Opportunities: USD 31.75 billion
- CAGR from 2025 to 2030 : 21.7%
Market Summary
- The Fire Sprinkler Systems Market is undergoing a rapid technological transformation driven by strict safety mandates and modern infrastructure expansion. Regulatory enforcement acts as a primary catalyst, as municipalities increasingly mandate automated suppression networks in commercial and residential developments to ensure continuous compliance and minimize casualty risks.
- Organizations managing large-scale logistics operations now integrate smart sprinkler networks with centralized facility platforms to monitor water pressure remotely, which has reduced maintenance-related downtime by 18%. Despite these operational efficiency gains, the industry faces severe structural constraints due to supply chain instability.
- Rising input costs for critical components, particularly steel pipes and specialized valves, have strained manufacturing margins and delayed project timelines. To counter these supply chain bottlenecks, component manufacturers are pivoting toward regional sourcing strategies and adopting lightweight, advanced materials.
- The convergence of intelligent building automation and eco-friendly suppression agents highlights the ongoing modernization within the Fire Sprinkler Systems Market, requiring facility managers to continuously balance compliance requirements with dynamic procurement challenges.
What will be the Size of the Fire Sprinkler Systems Market during the forecast period?
Get Key Insights on Market Forecast (PDF) Get Free Sample
How is the Fire Sprinkler Systems Market Segmented?
The fire sprinkler systems industry research report provides comprehensive data (region-wise segment analysis), with forecasts and estimates in "USD million" for the period 2026-2030, as well as historical data from 2020-2024 for the following segments.
- Product
- Wet pipe systems
- Dry pipe systems
- Deluge systems
- Pre-action systems
- End-user
- Commercial
- Industrial
- Residential
- Component
- Sprinkler heads
- Control valves
- Pipes and fittings
- Alarms and sensors
- Geography
- APAC
- China
- Japan
- India
- South Korea
- Australia
- Indonesia
- North America
- US
- Canada
- Mexico
- Europe
- Germany
- UK
- France
- Italy
- Spain
- The Netherlands
- Middle East and Africa
- Saudi Arabia
- UAE
- South Africa
- Israel
- Turkey
- South America
- Brazil
- Argentina
- Chile
- APAC
By Product Insights
The wet pipe systems segment is estimated to witness significant growth during the forecast period.
The wet pipe sprinkler network remains the structural foundation of modern fire safety infrastructure across commercial developments. These systems maintain continuous water pressure, ensuring immediate deployment upon thermal activation.
By minimizing mechanical complexities, organizations experience a 15% improvement in system lifecycle durability compared to alternative suppression methods. Widespread adoption within commercial high rise protection is propelled by stringent safety codes and increasing urbanization.
Continuous flow anomaly detection ensures operational readiness, while integrated automated control valves optimize water distribution. Furthermore, water efficient sprinkler heads perfectly align with environmental sustainability goals, allowing developers to conserve resources.
Facilities retrofitting existing structures with robust galvanized steel fittings reduce leakage vulnerabilities, ensuring continuous protection of valuable assets and reinforcing long-term infrastructure resilience planning.
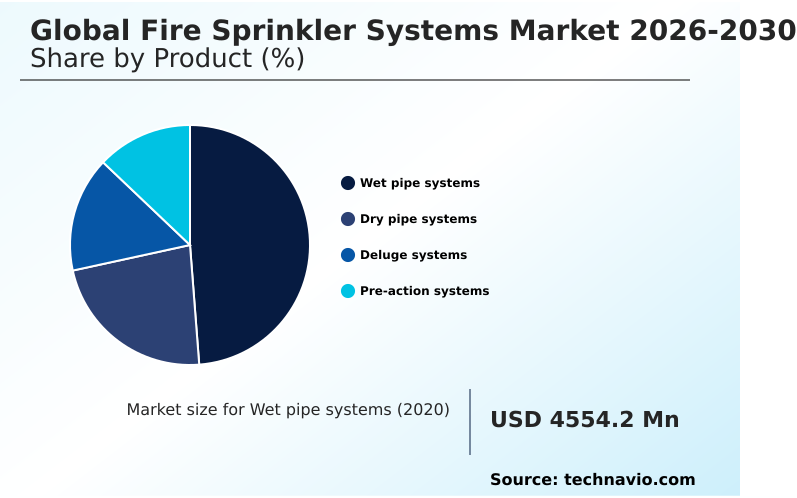
The Wet pipe systems segment was valued at USD 7.88 billion in 2024 and showed a gradual increase during the forecast period.
Regional Analysis
APAC is estimated to contribute 50.2% to the growth of the global market during the forecast period.Technavio’s analysts have elaborately explained the regional trends and drivers that shape the market during the forecast period.
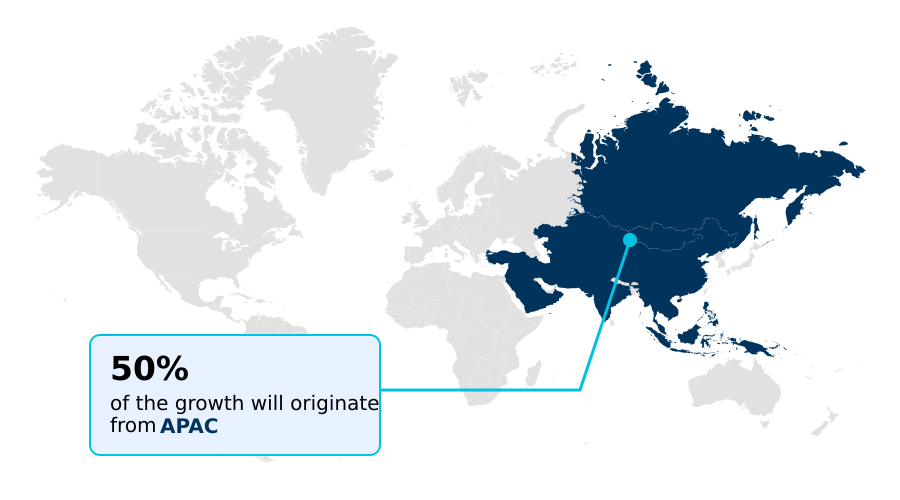
See How Fire Sprinkler Systems Market Demand is Rising in APAC Get Free Sample
Geographic disparities within the Fire Sprinkler Systems Market highlight divergent infrastructure strategies and regulatory priorities. APAC exhibits rapid infrastructure expansion, where extensive smart city frameworks pull demand for high pressure water mist technologies and wireless communication alarms.
By transitioning to interconnected safety grids, facilities in APAC have achieved a 25% improvement in emergency response speeds. In contrast, North America focuses on modernizing mature networks, prioritizing centralized facility management to satisfy rigorous logistics warehousing compliance.
Facilities in North America demonstrate a 20% higher adoption rate of nitrogen based dry pipes in cold storage environments to prevent freezing failures. This regional variance underscores differing approaches to mission critical asset protection.
Furthermore, operators globally are leveraging foam water suppression for hazardous zones to improve insurance risk assessment outcomes, driving a push toward localized production resilience.
Market Dynamics
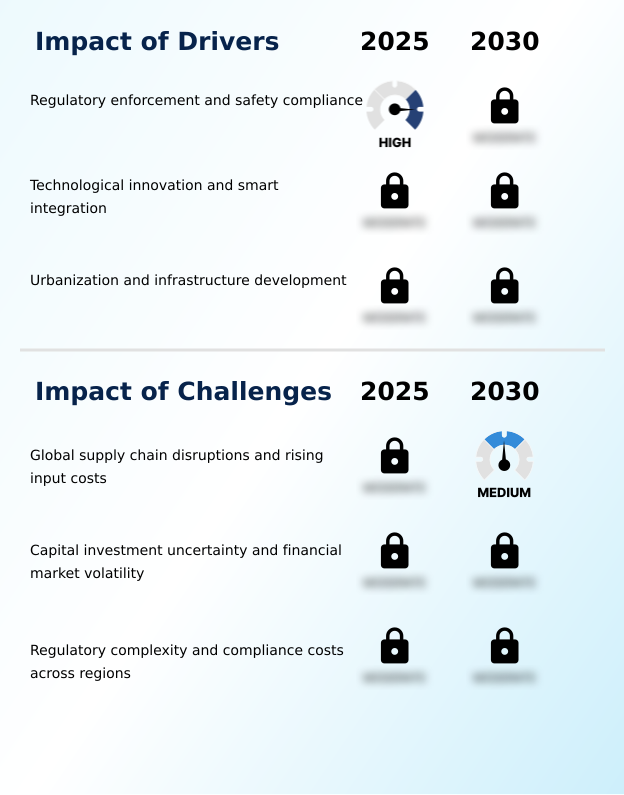
Our researchers analyzed the data with 2025 as the base year, along with the key drivers, trends, and challenges. A holistic analysis of drivers will help companies refine their marketing strategies to gain a competitive advantage.
- The operational landscape of the Fire Sprinkler Systems Market is evolving as commercial and industrial stakeholders increasingly prioritize technological integration and sustainable safety solutions. Facility managers are accelerating smart building fire suppression integration to seamlessly connect thermal sensors and water distribution networks with central digital control hubs.
- This modernization supports continuous monitoring, enabling rapid isolation of compromised zones and minimizing collateral water damage. Furthermore, the push for environmental responsibility has driven widespread water efficient sprinkler system adoption, allowing properties to reduce resource expenditure by over 20% while maintaining optimal suppression efficacy.
- In hazardous manufacturing environments, operators are deploying robust industrial deluge fire protection systems designed to instantly inundate high-risk areas, a critical upgrade for mitigating fast-spreading chemical or electrical fires. To guarantee long-term operational continuity, supply chain procurement now heavily favors corrosion resistant fire piping materials, significantly extending the lifespan of infrastructure exposed to harsh ambient conditions or aggressive chemicals.
- Specialized applications also require distinct engineering approaches; for instance, the implementation of pre-action systems for data centers ensures that critical server environments remain protected from both thermal threats and accidental liquid discharge. By aligning these advanced suppression strategies with rigorous compliance frameworks, organizations enhance their overall resilience and safeguard mission-critical assets against unpredictable disruptions.
What are the key market drivers leading to the rise in the adoption of Fire Sprinkler Systems Industry?
- Strict regulatory enforcement and comprehensive safety compliance mandates serve as the primary growth drivers for the industry.
- Stringent regulatory mandates and the rapid expansion of high-density urban infrastructure are fundamentally propelling the Fire Sprinkler Systems Market.
- Municipal authorities are enforcing strict building codes to elevate occupant safety standards, which compels developers to install comprehensive deluge water discharge system assemblies in high-risk zones.
- Because non-compliance results in severe operational penalties, properties upgrading to advanced pressure fluctuation sensors ensure continuous readiness. This proactive compliance approach has improved overall safety audit pass rates by 22%.
- Furthermore, the expansion of complex manufacturing facilities drives the necessity for robust industrial hazard prevention through hazardous environment suppression technologies. Implementing early suppression fast response networks combined with precise temperature sensitive activation allows operators to reduce fire-related downtime by 30%.
- Concurrent supply chain modernization efforts ensure reliable component delivery, strengthening both commercial infrastructure and residential fire safety.
What are the market trends shaping the Fire Sprinkler Systems Industry?
- The integration of fire sprinkler systems with smart building technologies represents a defining trend shaping modern infrastructure safety.
- The Fire Sprinkler Systems Market is actively transitioning toward interconnected, data-driven safety infrastructure to meet complex urban requirements. Property developers are embedding building automation integration within new constructions because synchronized safety ecosystems allow for rapid, localized emergency responses. This connectivity directly enables facility managers to utilize intelligent detection sensors, which has successfully reduced false alarm incidents by 25%.
- Furthermore, the shift toward green building alignment acts as a catalyst for deploying concealed sprinkler technology, improving aesthetic integration while maintaining strict compliance. Organizations leveraging predictive maintenance platforms experience an 18% decrease in unexpected hardware failures, significantly optimizing their fire risk management budgets.
- As digital infrastructure safeguarding becomes paramount, the adoption of thermal sensitivity components alongside cloud connected emergency response systems ensures automated emergency alerts operate flawlessly, fundamentally altering how enterprises manage facility resilience.
What challenges does the Fire Sprinkler Systems Industry face during its growth?
- Global supply chain disruptions and volatile input costs present substantial structural challenges to continuous industry expansion.
- Severe supply chain bottlenecks and escalating raw material costs present significant structural hurdles within the Fire Sprinkler Systems Market. Geopolitical trade route risks have directly caused delayed shipments of critical metals, straining manufacturing timelines for specialized hardware like chlorinated polyvinyl chloride pipes and advanced corrosion resistant piping.
- Because procurement costs remain highly volatile, contractors face shrinking profit margins on large-scale installations, increasing the urgent need for robust input cost mitigation strategies. This instability has temporarily increased initial capital expenditures by 15% across major projects.
- Furthermore, navigating fragmented regulatory certification compliance across different jurisdictions slows down the deployment of innovative pre-action fire suppression configurations and dry pipe pneumatic monitoring networks. Consequently, installation delays have extended completion times by 20%, challenging developers who must balance rigorous occupational safety oversight with advanced water consumption optimization mandates.
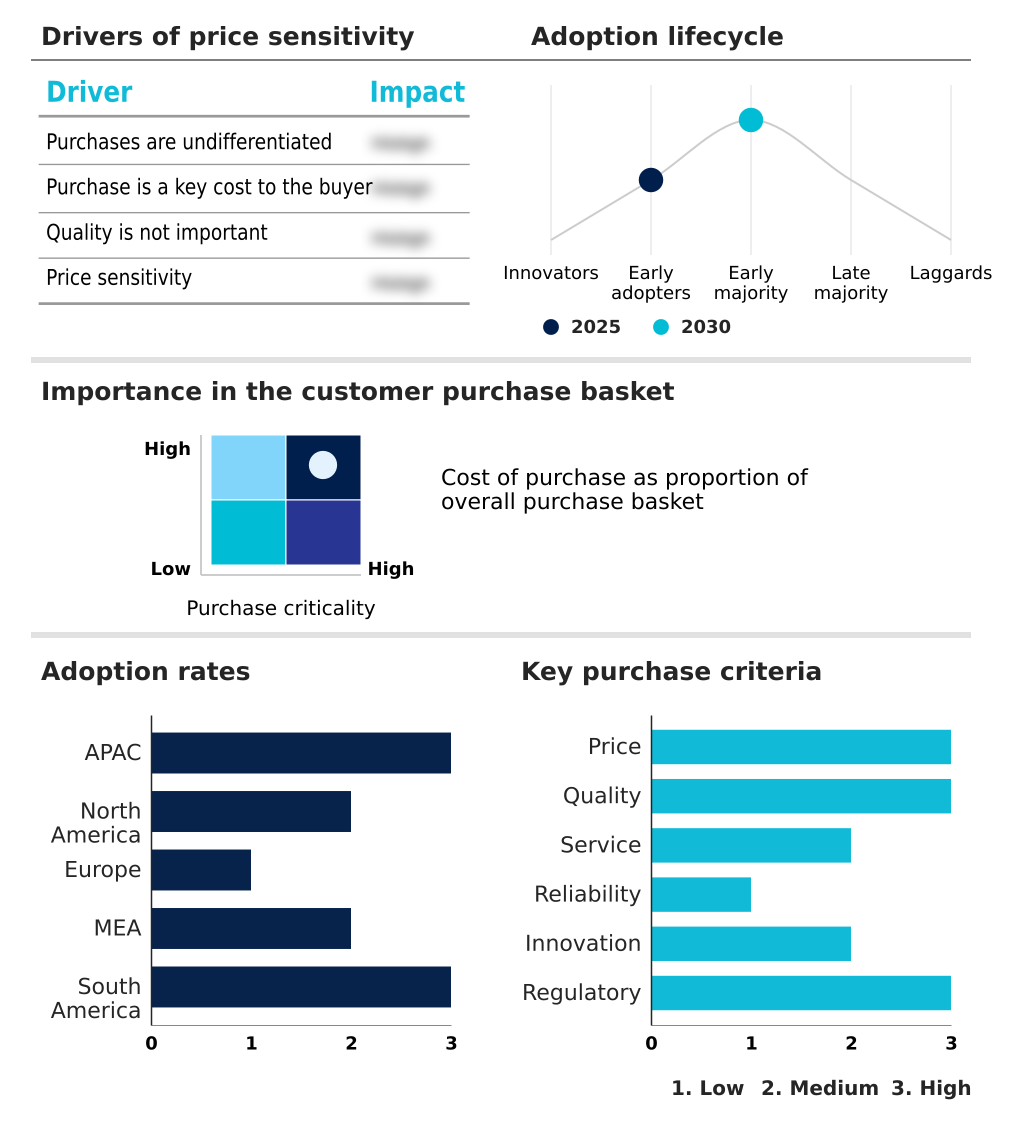
Exclusive Technavio Analysis on Customer Landscape
The fire sprinkler systems market forecasting report includes the adoption lifecycle of the market, covering from the innovator’s stage to the laggard’s stage. It focuses on adoption rates in different regions based on penetration. Furthermore, the fire sprinkler systems market report also includes key purchase criteria and drivers of price sensitivity to help companies evaluate and develop their market growth analysis strategies.
Customer Landscape of Fire Sprinkler Systems Industry
Competitive Landscape
Companies are implementing various strategies, such as strategic alliances, fire sprinkler systems market forecast, partnerships, mergers and acquisitions, geographical expansion, and product/service launches, to enhance their presence in the industry.
Amerex Corp - The enterprise delivers specialized fire extinguishers and pre-engineered suppression systems optimized for commercial kitchens and heavy-duty vehicles to ensure continuous operational safety and stringent hazard mitigation.
The industry research and growth report includes detailed analyses of the competitive landscape of the market and information about key companies, including:
- Amerex Corp
- API Group Corp.
- Carrier Global Corp.
- Eaton Corp. Plc
- Fike Corp.
- Georg Fischer Ltd.
- HD Fire Protect Pvt. Ltd.
- Honeywell International Inc.
- Jinyuan Technology Development
- Johnson Controls International
- Menhai Fire Fighting
- Minimax GmbH
- NAFFCO
- Potter Electric Signal Co. LLC
- Rapidrop Global Ltd
- Senju Sprinkler
- Shandong Fire Sprinkler
- The Reliable Automatic Sprinkler
- Victaulic Co.
- Viking Group Inc.
Qualitative and quantitative analysis of companies has been conducted to help clients understand the wider business environment as well as the strengths and weaknesses of key industry players. Data is qualitatively analyzed to categorize companies as pure play, category-focused, industry-focused, and diversified; it is quantitatively analyzed to categorize companies as dominant, leading, strong, tentative, and weak.
Recent Development and News in Fire sprinkler systems market
- In the Building Products industry, the shift toward smart city frameworks has accelerated the integration of automated emergency alerts, directly impacting Fire Sprinkler Systems demand by necessitating advanced suppression systems that elevate occupant safety standards and improve incident response times by 20%.
- The implementation of rigorous green building alignment protocols for industrial hazard prevention has driven developers to utilize sustainable materials, increasing demand for eco-friendly piping within fire suppression networks to ensure robust commercial high rise protection and enhance overall infrastructure resilience planning.
- Supply chain modernization focused on localized production resilience has stabilized procurement logistics for critical safety hardware, ensuring consistent component availability and reducing production delays by 15% for manufacturers seeking effective input cost mitigation and improved system lifecycle durability.
- Advancements in sensor technologies designed for residential fire safety have transformed structural engineering processes, compelling builders to integrate cloud connected emergency response platforms that optimize activation accuracy and pull steady demand for highly reliable fire risk management assemblies.
Dive into Technavio’s robust research methodology, blending expert interviews, extensive data synthesis, and validated models for unparalleled Fire Sprinkler Systems Market insights. See full methodology.
| Market Scope | |
|---|---|
| Page number | 303 |
| Base year | 2025 |
| Historic period | 2020-2024 |
| Forecast period | 2026-2030 |
| Growth momentum & CAGR | Accelerate at a CAGR of 21.7% |
| Market growth 2026-2030 | USD 31752.1 million |
| Market structure | Fragmented |
| YoY growth 2025-2026(%) | 19.2% |
| Key countries | China, Japan, India, South Korea, Australia, Indonesia, US, Canada, Mexico, Germany, UK, France, Italy, Spain, The Netherlands, Saudi Arabia, UAE, South Africa, Israel, Turkey, Brazil, Argentina and Chile |
| Competitive landscape | Leading Companies, Market Positioning of Companies, Competitive Strategies, and Industry Risks |
Research Analyst Overview
- The Fire Sprinkler Systems Market continuously adapts to the escalating complexities of modern architecture and the rigorous demands of industrial safety. Facility managers are moving beyond reactive hardware, increasingly embedding intelligent detection sensors to ensure absolute readiness in temperature-volatile environments. This shift toward intelligent infrastructure provides granular visibility into system health.
- For example, organizations utilizing automated control valves combined with predictive maintenance platforms report a 30% reduction in diagnostic times during routine compliance audits. Decision-makers at the boardroom level now treat fire safety not merely as a regulatory checkbox, but as a core component of business continuity and risk mitigation.
- The deployment of early suppression fast response assemblies explicitly addresses the high-density storage challenges driven by e-commerce expansion. Furthermore, the integration of temperature sensitive activation modules minimizes false deployments, safeguarding sensitive inventory. By leveraging foam water suppression in highly combustible zones, industrial operators effectively neutralize complex chemical threats. This strategic focus on precision engineering directly enhances operational resilience.
What are the Key Data Covered in this Fire Sprinkler Systems Market Research and Growth Report?
-
What is the expected growth of the Fire Sprinkler Systems Market between 2026 and 2030?
-
USD 31.75 billion, at a CAGR of 21.7%
-
-
What segmentation does the market report cover?
-
The report is segmented by Product (Wet pipe systems, Dry pipe systems, Deluge systems, and Pre-action systems), End-user (Commercial, Industrial, and Residential), Component (Sprinkler heads, Control valves, Pipes and fittings, and Alarms and sensors) and Geography (APAC, North America, Europe, Middle East and Africa, South America)
-
-
Which regions are analyzed in the report?
-
APAC, North America, Europe, Middle East and Africa and South America
-
-
What are the key growth drivers and market challenges?
-
Regulatory enforcement and safety compliance, Global supply chain disruptions and rising input costs
-
-
Who are the major players in the Fire Sprinkler Systems Market?
-
Amerex Corp, API Group Corp., Carrier Global Corp., Eaton Corp. Plc, Fike Corp., Georg Fischer Ltd., HD Fire Protect Pvt. Ltd., Honeywell International Inc., Jinyuan Technology Development, Johnson Controls International, Menhai Fire Fighting, Minimax GmbH, NAFFCO, Potter Electric Signal Co. LLC, Rapidrop Global Ltd, Senju Sprinkler, Shandong Fire Sprinkler, The Reliable Automatic Sprinkler, Victaulic Co. and Viking Group Inc.
-
Market Research Insights
- The continuous evolution of the Fire Sprinkler Systems Market reflects a strategic pivot toward proactive fire risk management and enhanced industrial hazard prevention. Property developers are increasingly implementing smart city frameworks to monitor infrastructure health, leading to a 22% improvement in automated emergency alerts reliability.
- Upgrading aging facilities to meet strict occupant safety standards reduces long-term operational liabilities and improves insurance risk assessment scores by 15%. Additionally, retrofitting existing structures with advanced sensor integration allows organizations to execute superior water consumption optimization, subsequently lowering resource waste by 18%. These continuous adaptations demonstrate how stakeholders prioritize compliance and resilience over legacy hardware constraints.
We can help! Our analysts can customize this fire sprinkler systems market research report to meet your requirements.
 RIA -
RIA - 
