Food Container Market Size 2025-2029
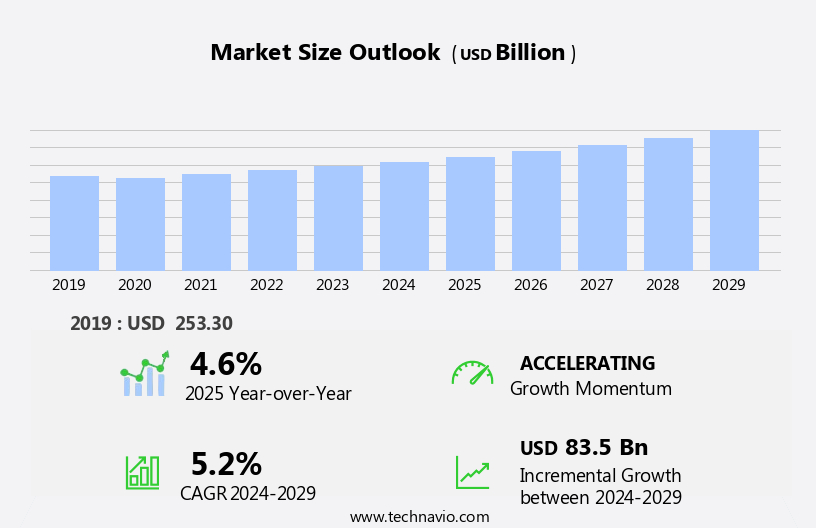
The food container market size is forecast to increase by USD 83.5 billion, at a CAGR of 5.2% between 2024 and 2029.
- The market is experiencing significant growth, driven primarily by the increasing demand for convenience in consumer lifestyles. This trend is particularly evident in the ready-to-eat and takeaway food industries, where the use of food containers is essential. Additionally, the growing importance of sustainable containers is another key driver for market growth. As consumers become increasingly conscious of their environmental impact, there is a rising demand for eco-friendly and reusable food containers. However, the market also faces challenges. Health and environmental safety issues associated with plastics food containers continue to be a concern. Reports of chemicals leaching from plastic containers into food have raised awareness and concerns among consumers.
- This has led to a shift towards alternative materials such as glass, stainless steel, and biodegradable plastics. Companies must address these challenges by investing in research and development of safer and more sustainable food container solutions to meet evolving consumer demands and regulations.
What will be the Size of the Food Container Market during the forecast period?
The market continues to evolve, with dynamic market activities unfolding across various sectors. Entities involved in this industry, such as filling machines, bulk packaging systems, plastic containers, container closure suppliers, and food safety regulators, collaborate to ensure the delivery of safe and high-quality food products. Injection molding and blow molding technologies enable the production of various container types, including glass, plastic, and metal containers, catering to diverse consumer preferences and applications. Sustainability remains a key focus, with the emergence of eco-friendly packaging solutions, such as biodegradable and compostable containers, gaining traction. Packaging machinery, including filling lines, labeling machines, and capping machines, streamline production processes and enhance efficiency.
Food processing and food service industries rely on these solutions to maintain stringent food safety standards and provide consumers with convenient, portion-controlled offerings. Grocery stores and convenience stores incorporate these containers into their supply chains, ensuring the efficient transportation and storage of various food items. Paper containers, another sustainable alternative, offer versatility and are suitable for a wide range of applications, from food packaging to waste management. The food industry's continuous evolution is driven by the need for innovation, quality control, and consumer demand for convenience and sustainability. Market dynamics remain fluid, with ongoing advancements in packaging materials, food preservation techniques, and packaging regulations shaping the industry's future.
How is this Food Container Industry segmented?
The food container industry research report provides comprehensive data (region-wise segment analysis), with forecasts and estimates in "USD billion" for the period 2025-2029, as well as historical data from 2019-2023 for the following segments.
- Product
- Bottles and jars
- Cans
- Cups and tubs
- Boxes
- Others
- Material
- Plastic
- Metal
- Glass
- Others
- Application
- Fruits and vegetables
- Dairy
- Meat products
- Frozen foods
- Others
- Type
- Rigid
- Flexible
- Geography
- North America
- US
- Canada
- Europe
- France
- Germany
- Italy
- UK
- APAC
- China
- India
- Japan
- South Korea
- Rest of World (ROW)
- North America
By Product Insights
The bottles and jars segment is estimated to witness significant growth during the forecast period.
In the dynamic food packaging market, various solutions cater to the diverse needs of the food industry. Glass containers, valued for their non-reactive properties, preserve the quality and taste of food products, particularly sauces, condiments, juices, and beverages. Their ability to protect against light and oxygen makes them ideal for extended food preservation. Conversely, plastic containers offer a lightweight and cost-effective alternative for a broad spectrum of food items. PET bottles, widely used in water, soft drink, juice, and non-carbonated beverage packaging, are a notable trend. Sustainability is a significant factor influencing the market, with an emphasis on sustainable packaging solutions such as biodegradable, compostable, and reusable containers.
Bulk packaging and portion control are also key considerations, with filling machines, injection molding, blow molding, and capping machines streamlining production processes. Food safety regulations mandate stringent quality control measures, ensuring leak-proof and microwave-safe containers. Delivery services and convenience stores further expand the market reach, while packaging materials like paper and metal containers cater to various applications. Waste management and environmental impact are critical concerns, driving innovation in eco-friendly and recyclable packaging solutions. Food processing, packaging design, and labeling machines are essential components of the packaging lines in the food industry. Overall, the food packaging market is a dynamic and evolving landscape, responding to the demands of the food industry and consumer preferences.
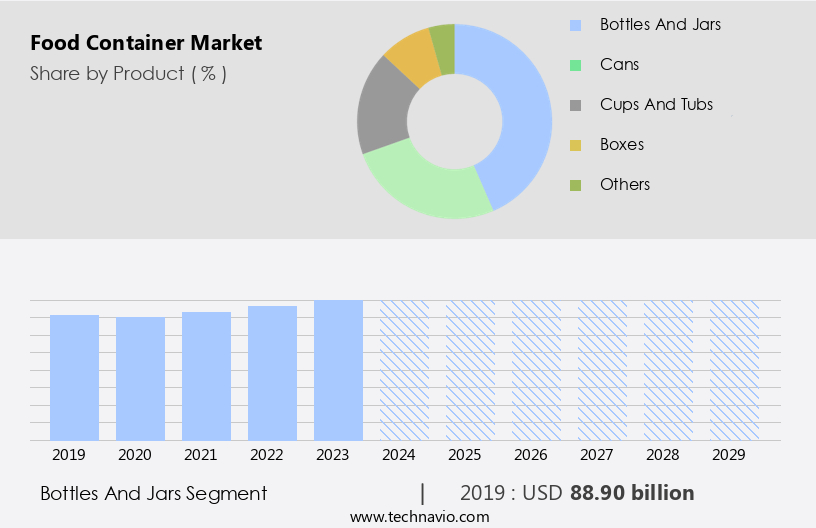
The Bottles and jars segment was valued at USD 88.90 billion in 2019 and showed a gradual increase during the forecast period.
Regional Analysis
APAC is estimated to contribute 37% to the growth of the global market during the forecast period.Technavio’s analysts have elaborately explained the regional trends and drivers that shape the market during the forecast period.
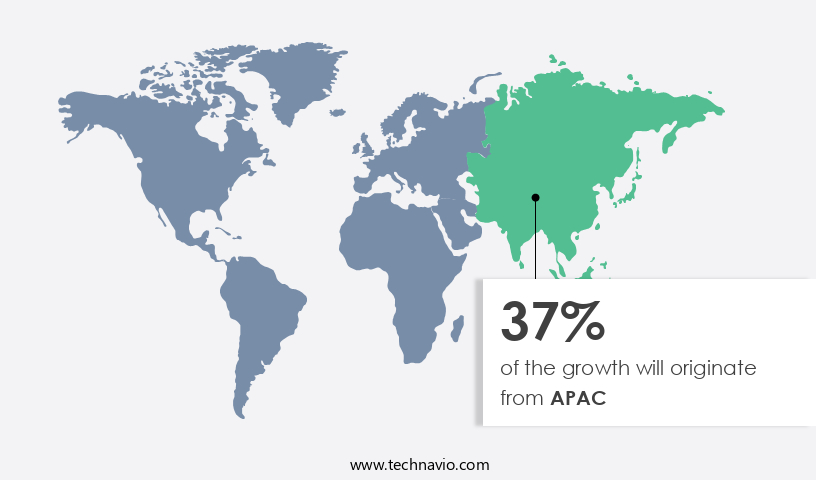
The market in APAC holds a significant share in the global industry, with key contributors being China and India. Consumer preferences for convenience and sustainability are primary growth drivers. The region's mature the market caters to the increasing demand for processed and packaged foods. Sustainable packaging solutions, such as biodegradable, compostable, and reusable containers, are gaining popularity due to growing environmental concerns. Injection molding, blow molding, and capping machines are essential packaging machinery used in the production of various food containers. Food safety and quality control are crucial factors in the food industry, making leak-proof and microwave-safe containers a priority.
Grocery stores and convenience stores are significant consumers of food containers, while delivery services and food processing industries also contribute to the market's growth. Paper, plastic, glass, and metal containers are common packaging materials used for food storage and transportation. Food preservation is another critical aspect, leading to the use of advanced packaging designs and materials. Packaging regulations ensure food safety and minimize environmental impact, making waste management an essential consideration for manufacturers. Consumer goods companies and food service industries are significant end-users of food containers, further fueling market growth.
Market Dynamics
Our researchers analyzed the data with 2024 as the base year, along with the key drivers, trends, and challenges. A holistic analysis of drivers will help companies refine their marketing strategies to gain a competitive advantage.
What are the key market drivers leading to the rise in the adoption of Food Container Industry?
- The market is propelled forward by the escalating demand for convenience from consumers.
- The market is experiencing significant growth due to the increasing demand for convenience in today's fast-paced lifestyle. Consumers are seeking time-saving solutions for their busy schedules, leading to an increased preference for convenient food options. Food containers provide a practical solution for packaging and storing various food products, enabling consumers to enjoy meals at their convenience. This trend is observed across a range of food items, including pre-packaged salads, microwaveable meals, and portable snacks. The convenience offered by food containers eliminates the need for lengthy meal preparation or dining out, making them an essential commodity in modern households and convenience stores.
- The market is poised for continued growth as consumers continue to prioritize convenience and flexibility in their food choices.
What are the market trends shaping the Food Container Industry?
- The growing significance of sustainable containers is an emerging market trend. This shift towards eco-friendly and reusable packaging solutions is a noteworthy development in the industry.
- The market is experiencing significant growth as consumers prioritize eco-friendly and sustainable packaging solutions. Companies are investing in advanced technologies, such as injection molding and filling machines, to produce containers made from versatile materials. These materials offer benefits like temperature resistance, durability, and insulation, making them suitable for various industries, including food and beverage. However, the shift towards sustainable packaging is limiting the potential of conventional plastic containers due to increasing environmental regulations.
- Manufacturers are focusing on developing recyclable and moisture-resistant containers to meet consumer demands and regulatory requirements. Container closures that ensure food safety and portion control are also gaining popularity. Overall, the market is evolving to meet the needs of modern consumers while prioritizing sustainability and innovation.
What challenges does the Food Container Industry face during its growth?
- The expansion of the food industry faces significant challenges due to health and environmental safety concerns associated with the use of plastics containers. These issues, which include potential health risks from chemical leaching and environmental harm from non-biodegradable waste, necessitate ongoing research and innovation to develop safer and more sustainable alternatives.
- In the dynamic food industry, adhering to food standards is paramount to ensure consumer safety. In the US, the Food and Drug Administration (FDA) and the US Department of Agriculture regulate food packaging to prevent contamination from additives used in plastic manufacturing. These additives, while enhancing plastic properties, can migrate into packaged food, posing health risks. Food packaging solutions encompass various types, including glass containers, disposable containers, and microwave-safe containers. Packaging machinery plays a crucial role in maintaining the integrity of these containers during production. Paper containers are also gaining popularity due to their eco-friendliness. Delivery services have significantly influenced the food packaging landscape, necessitating microwave-safe and durable containers for efficient food transportation.
- As a result, food packaging continues to evolve, focusing on preserving food quality, enhancing consumer convenience, and ensuring safety. Manufacturers must comply with FDA regulations, obtaining approval or permission through threshold of regulation exemption letters or Food Contact Notifications. This regulatory oversight ensures the safety and quality of food packaging in the US market.
Exclusive Customer Landscape
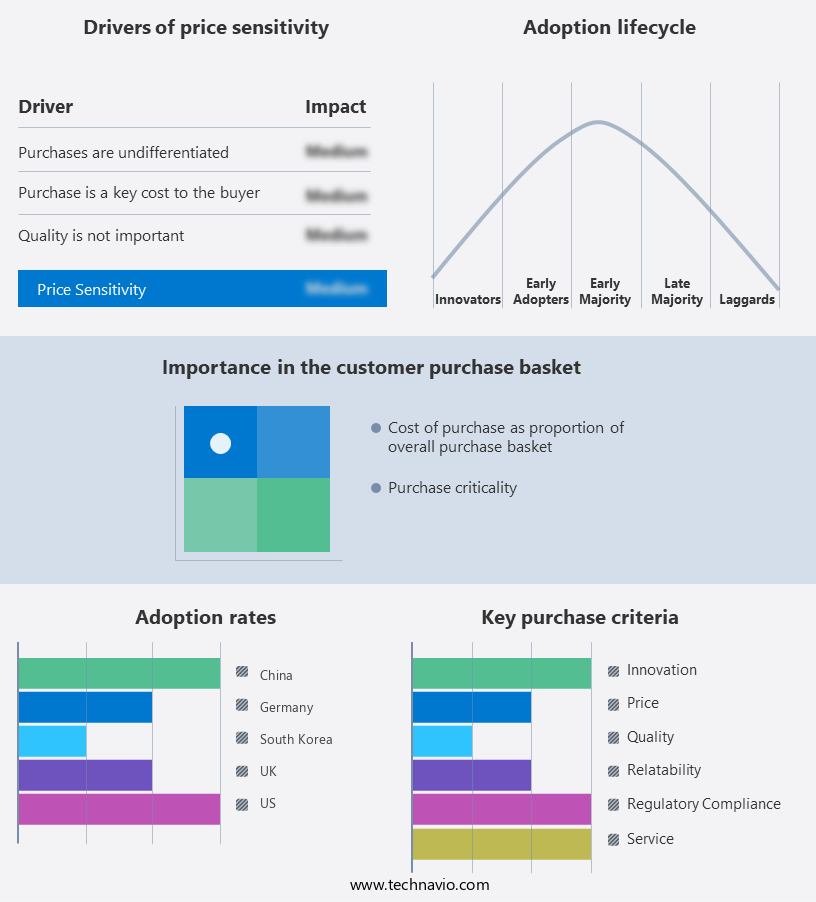
The food container market forecasting report includes the adoption lifecycle of the market, covering from the innovator’s stage to the laggard’s stage. It focuses on adoption rates in different regions based on penetration. Furthermore, the food container market report also includes key purchase criteria and drivers of price sensitivity to help companies evaluate and develop their market growth analysis strategies.
Customer Landscape
Key Companies & Market Insights
Companies are implementing various strategies, such as strategic alliances, food container market forecast, partnerships, mergers and acquisitions, geographical expansion, and product/service launches, to enhance their presence in the industry.
Amcor Plc - The company specializes in innovative food container solutions, including HeatReady, Lifespan, and GoSmart series. These containers are designed with advanced technology to ensure optimal food preservation and heating capabilities. HeatReady containers maintain food temperature for extended periods, while Lifespan containers boast extended durability. GoSmart containers offer smart technology features for enhanced convenience. By investing in these containers, consumers can enjoy fresh, high-quality food for longer periods, reducing food waste and saving time and resources.
The industry research and growth report includes detailed analyses of the competitive landscape of the market and information about key companies, including:
- Amcor Plc
- Anchor Glass Container Corp.
- Ardagh Group SA
- Ball Corp.
- Berry Global Inc.
- Gordon Food Service Inc.
- Graham Packaging Co. LP
- Graphic Packaging Holding Co.
- Newell Brands Inc.
- Pactiv Evergreen Inc.
- Plastipak Holdings Inc.
- PMMI Media Group
- Printpack Inc.
- Reem Packaging Inc.
- S.C. Johnson and Son Inc.
- Sonoco Products Co.
- The Clorox Co.
- Tupperware Brands Corp.
- Viking Packaging
Qualitative and quantitative analysis of companies has been conducted to help clients understand the wider business environment as well as the strengths and weaknesses of key industry players. Data is qualitatively analyzed to categorize companies as pure play, category-focused, industry-focused, and diversified; it is quantitatively analyzed to categorize companies as dominant, leading, strong, tentative, and weak.
Recent Development and News in Food Container Market
- In February 2023, Danish packaging solutions provider, Danimer Scientific, announced the commercial launch of its biodegradable food container, PHA-based Nodaxâ¢, in collaboration with McDonald's USA. This strategic partnership marks a significant step towards sustainable food packaging (Danimer Scientific Press Release, 2023).
- In July 2024, Amcor, a global packaging leader, completed the acquisition of Bemis Company, Inc., a major player in flexible and rigid packaging. This merger bolstered Amcor's presence in the market, expanding its product portfolio and enhancing its capabilities in innovation and sustainability (Amcor Press Release, 2024).
- In October 2024, the European Union (EU) approved the use of PLA (Polylactic Acid) as a food contact material. This regulatory approval opened new opportunities for companies specializing in biodegradable food containers, as PLA is a widely used material for sustainable food packaging (European Commission, 2024).
- In March 2025, Berry Global, a global packaging solutions provider, unveiled its new state-of-the-art manufacturing facility in Mexico. This expansion enabled the company to cater to the growing demand for food containers in the North American market, strengthening its position as a key player in the industry (Berry Global Press Release, 2025).
Research Analyst Overview
- In the dynamic the market, vacuum packaging and digital printing are prominent trends, offering product protection and brand identity enhancement. Recyclable materials, such as renewable resources and plant-based materials, are gaining traction due to consumer appeal and supply chain sustainability concerns. Edible packaging and bio-based coatings, including UV protection and oxygen barrier properties, extend shelf life and improve product preservation. Packaging innovation continues with temperature resistance, moisture barrier, and chemical resistance, enabling cost optimization and inventory management. Active packaging and smart packaging technologies provide real-time monitoring and enhance supply chain efficiency.
- UV protection and barrier properties are crucial for maintaining product quality, while 3D printing and bio-based plastics offer packaging efficiency and novelty. Ultimately, the market is driven by the need for product protection, extended shelf life, and consumer appeal, with innovation in materials, technologies, and sustainability shaping its future.
Dive into Technavio’s robust research methodology, blending expert interviews, extensive data synthesis, and validated models for unparalleled Food Container Market insights. See full methodology.
|
Market Scope |
|
|
Report Coverage |
Details |
|
Page number |
233 |
|
Base year |
2024 |
|
Historic period |
2019-2023 |
|
Forecast period |
2025-2029 |
|
Growth momentum & CAGR |
Accelerate at a CAGR of 5.2% |
|
Market growth 2025-2029 |
USD 83.5 billion |
|
Market structure |
Fragmented |
|
YoY growth 2024-2025(%) |
4.6 |
|
Key countries |
US, China, Japan, Germany, India, UK, South Korea, France, Italy, and Canada |
|
Competitive landscape |
Leading Companies, Market Positioning of Companies, Competitive Strategies, and Industry Risks |
What are the Key Data Covered in this Food Container Market Research and Growth Report?
- CAGR of the Food Container industry during the forecast period
- Detailed information on factors that will drive the growth and forecasting between 2025 and 2029
- Precise estimation of the size of the market and its contribution of the industry in focus to the parent market
- Accurate predictions about upcoming growth and trends and changes in consumer behaviour
- Growth of the market across APAC, Europe, North America, Middle East and Africa, and South America
- Thorough analysis of the market’s competitive landscape and detailed information about companies
- Comprehensive analysis of factors that will challenge the food container market growth of industry companies
We can help! Our analysts can customize this food container market research report to meet your requirements.
 RIA -
RIA - 
