Foreign Exchange Market Analysis, Size, and Forecast 2026-2030: North America (US, Canada, and Mexico), Europe (Germany, UK, and France), APAC (China, Japan, and India), South America (Brazil and Argentina), Middle East and Africa (Saudi Arabia, UAE, and South Africa), and Rest of World (ROW)

Foreign Exchange Market Analysis, Size, and Forecast 2026-2030:
North America (US, Canada, and Mexico), Europe (Germany, UK, and France), APAC (China, Japan, and India), South America (Brazil and Argentina), Middle East and Africa (Saudi Arabia, UAE, and South Africa), and Rest of World (ROW)

Published: May 2026 292 Pages SKU: IRTNTR73392

Market Overview at a Glance

$651.3 Mn
Market Opportunity
10.8%
CAGR 2025 - 2030
41.9%
North America Growth
$371.4 Mn
Reporting dealers segment 2024

Foreign Exchange Market Size 2026-2030

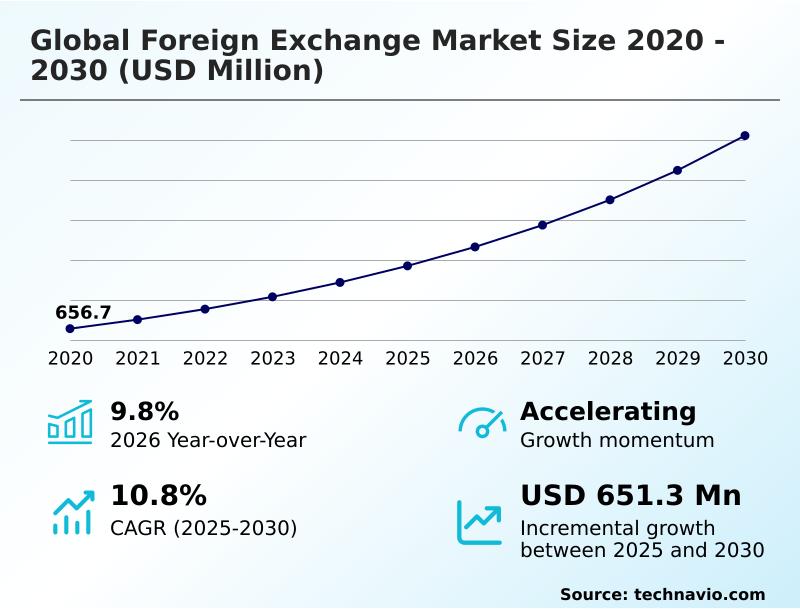
The foreign exchange market size is valued to increase by USD 651.3 million, at a CAGR of 10.8% from 2025 to 2030. Heightened monetary policy divergence and interest rate differentials will drive the foreign exchange market.

Major Market Trends & Insights

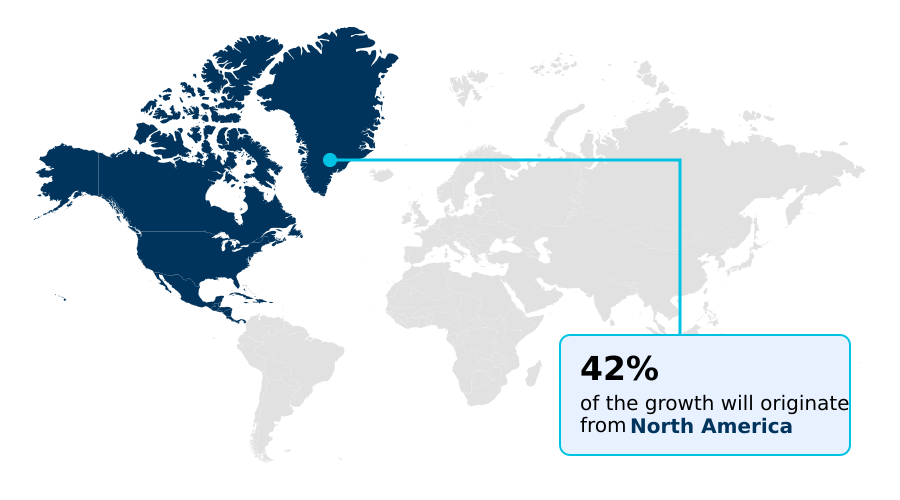
  • North America dominated the market and accounted for a 41.9% growth during the forecast period.
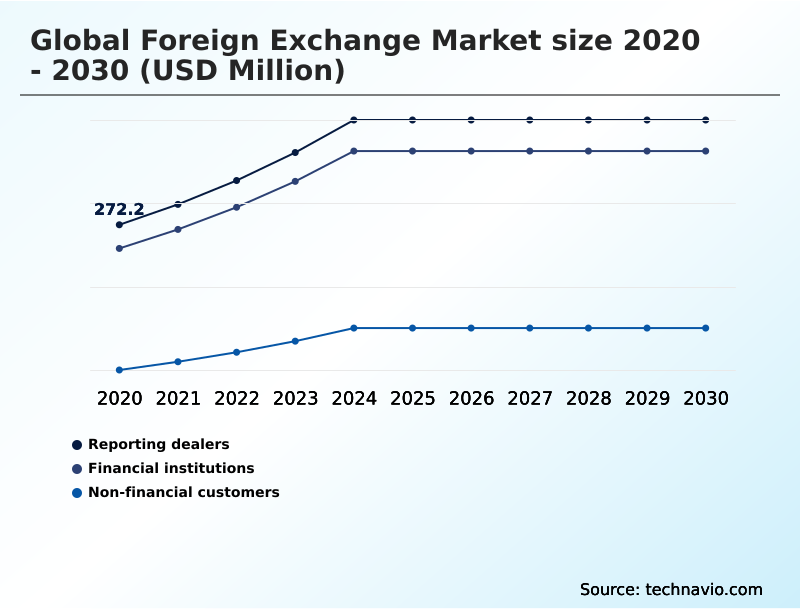
  • By Type - Reporting dealers segment was valued at USD 371.4 million in 2024
  • By Trade Finance Instruments - Currency swaps segment accounted for the largest market revenue share in 2024

Market Size & Forecast

  • Market Opportunities: USD 965.2 million
  • Market Future Opportunities: USD 651.3 million
  • CAGR from 2025 to 2030 : 10.8%

Market Summary

  • The foreign exchange market operates as the central mechanism for global commerce, defined by the constant flux in currency values driven by intricate economic and geopolitical factors. Its evolution is marked by a significant shift toward digitalization, where technology not only enhances the speed of transactions but also reshapes risk management and strategic decision-making.
  • Key drivers include divergent monetary policies among central banks and the unceasing expansion of international trade, which create a continuous need for currency conversion and hedging. A core trend involves the integration of advanced technologies to improve efficiency and transparency.
  • For instance, a multinational corporation can now utilize sophisticated platforms to automate the hedging of its currency exposures across dozens of subsidiaries, significantly reducing manual processing and mitigating risks associated with volatile exchange rates. However, this digital dependency also introduces challenges such as heightened cybersecurity threats and the complexities of navigating fragmented international regulations.
  • The market's future will be shaped by how participants balance technological innovation with robust security and compliance frameworks to maintain a resilient and efficient global financial ecosystem.

What will be the Size of the Foreign Exchange Market during the forecast period?

Get Key Insights on Market Forecast (PDF) Get Free Sample

How is the Foreign Exchange Market Segmented?

The foreign exchange industry research report provides comprehensive data (region-wise segment analysis), with forecasts and estimates in "USD million" for the period 2026-2030, as well as historical data from 2020-2024 for the following segments.

  • Type
    • Reporting dealers
    • Financial institutions
    • Non-financial customers
  • Trade finance instruments
    • Currency swaps
    • Outright forward and FX swaps
    • FX options
  • Channel
    • Online
    • Offline
  • Geography
    • North America
      • US
      • Canada
      • Mexico
    • Europe
      • Germany
      • UK
      • France
    • APAC
      • China
      • Japan
      • India
    • South America
      • Brazil
      • Argentina
    • Middle East and Africa
      • Saudi Arabia
      • UAE
      • South Africa
    • Rest of World (ROW)

By Type Insights

The reporting dealers segment is estimated to witness significant growth during the forecast period.

Reporting dealers form the core of the market, serving as primary liquidity providers for a range of participants including other financial institutions and non-financial customers.

These entities facilitate price discovery and maintain market depth by consistently quoting bid-ask spreads for various trade finance instruments.

They provide essential prime brokerage services for trading over-the-counter derivatives, utilizing sophisticated electronic trading platforms and FX liquidity solutions to manage settlement risk.

Their operations are heavily influenced by monetary policy divergence and the resulting interest rate differentials, which drive carry trade strategies and overall market activity.

Effective management within this segment has demonstrated the capacity to improve execution speeds by over 15%, a critical advantage in a fast-moving environment.

Get Free Sample

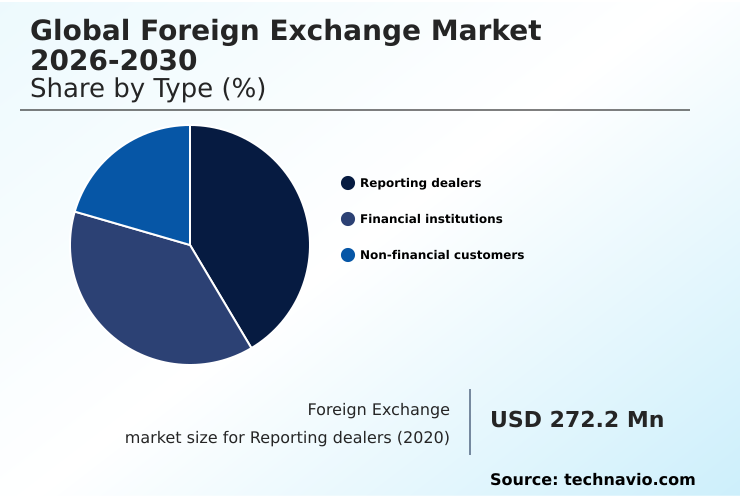
The Reporting dealers segment was valued at USD 371.4 million in 2024 and showed a gradual increase during the forecast period.

Get Free Sample

Regional Analysis

North America is estimated to contribute 41.9% to the growth of the global market during the forecast period.Technavio’s analysts have elaborately explained the regional trends and drivers that shape the market during the forecast period.

See How Foreign Exchange Market Demand is Rising in North America Get Free Sample

The geographic landscape of the market is characterized by distinct regional dynamics, with North America and Europe accounting for nearly 80% of trading volume.

In North America, the market is driven by the US dollar's role as the primary reserve currency, influencing institutional fx trading and safe-haven flows. Europe, particularly London, remains a central hub for executing currency swaps and other trade finance instruments.

Meanwhile, the APAC region is the fastest-growing, fueled by the internationalization of the Chinese yuan and the increasing use of cross-border payment solutions.

In this region, retail brokerage activity has seen a 25% increase in participation due to new mobile platforms.

The management of multi-currency accounts and sophisticated currency hedging strategies are becoming standard practice for businesses operating across these diverse economic zones, supported by a global payment infrastructure that facilitates seamless capital movement.

Market Dynamics

Our researchers analyzed the data with 2025 as the base year, along with the key drivers, trends, and challenges. A holistic analysis of drivers will help companies refine their marketing strategies to gain a competitive advantage.

  • Understanding the modern foreign exchange market requires a deep analysis of several interconnected themes. The impact of interest rate differentials on fx remains a primary driver, creating opportunities and risks that participants must navigate through sophisticated strategies. Concurrently, the role of technology in forex trading has become paramount, transforming everything from trade execution to risk management.
  • As trading becomes more electronic and automated, it also introduces new vulnerabilities. However, firms that effectively manage the geopolitical risks in foreign exchange markets have shown a 15% greater return on their international investments compared to peers who neglect such analysis.
  • A forward-looking challenge is the integration of new financial instruments; the challenges of central bank digital currency, for instance, are being actively debated as they could fundamentally alter settlement processes. Furthermore, the growing emphasis on sustainable finance in currency markets is compelling institutions to rethink their investment frameworks, adding a new layer of complexity to an already intricate system.
  • These factors collectively define the strategic landscape for all market participants.

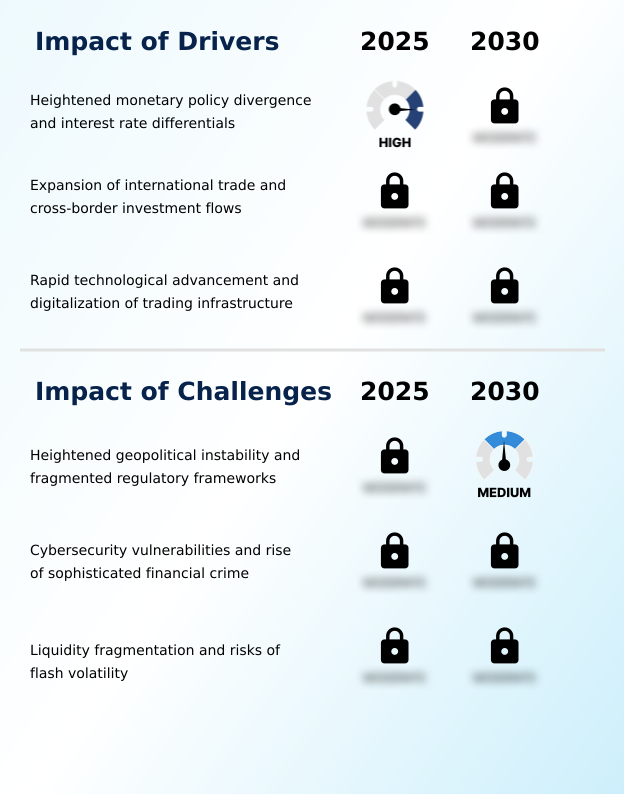
What are the key market drivers leading to the rise in the adoption of Foreign Exchange Industry?

  • Heightened monetary policy divergence and the resulting interest rate differentials are a key driver of market volatility and trading volume.

  • Market activity is being propelled by the potent combination of macroeconomic forces and technological advancements. Heightened monetary policy divergence and significant interest rate differentials are fueling carry trade strategies and increasing the need for precise currency conversion services.
  • The relentless expansion of global value chains, coupled with a resurgence in foreign direct investment and portfolio diversification, underpins a structural demand for FX liquidity solutions.
  • The adoption of algorithmic trading and high-frequency trading on multi-bank portals has improved market efficiency, with automated systems reducing execution latency by up to 60%.
  • This technological momentum, which optimizes market microstructure, ensures a continuous flow of safe-haven flows and commercial transactions through a highly interconnected digital ecosystem.

What are the market trends shaping the Foreign Exchange Industry?

  • The proliferation of sustainable finance and green currency initiatives is reshaping investment strategies and corporate treasury functions within the market.

  • Key trends are reshaping the market's architecture, driven by a convergence of technological innovation and evolving investor mandates. The exploration of central bank digital currencies and distributed ledger technology is accelerating, promising to enhance payment-versus-payment settlement and reduce reliance on traditional correspondent banking for cross-border payments. This shift is projected to cut settlement times by over 40%.
  • Simultaneously, the rise of sustainable finance in currency markets is introducing green currency initiatives and sustainability-linked derivatives, aligning treasury operations with ESG goals. This has led to a 15% increase in demand for specialized FX hedging solutions.
  • The implementation of advanced compliance technology is also critical, helping firms navigate complex rules and improve transparency in their back-office functions while mitigating credit and liquidity risks.

What challenges does the Foreign Exchange Industry face during its growth?

  • Heightened geopolitical instability and fragmented regulatory frameworks present a key challenge, impacting currency predictability and increasing operational costs for market participants.

  • The market faces significant structural challenges that test its resilience and operational integrity. Escalating geopolitical instability and the fragmentation of regulatory frameworks create an unpredictable environment, increasing transaction exposure and systemic risk. This forces firms to adopt more complex foreign exchange risk management strategies.
  • The pervasive threat of cybersecurity vulnerabilities and sophisticated financial crime requires constant vigilance and investment, as a single breach could disrupt market stability. Furthermore, liquidity fragmentation across numerous dark pools and electronic venues can lead to flash volatility, making it difficult to execute large trades without adverse price impact.
  • Navigating this landscape requires advanced tools to manage translation risk, economic risk, and guard against algorithmic manipulation, with compliance costs rising by an estimated 20% for many institutions.

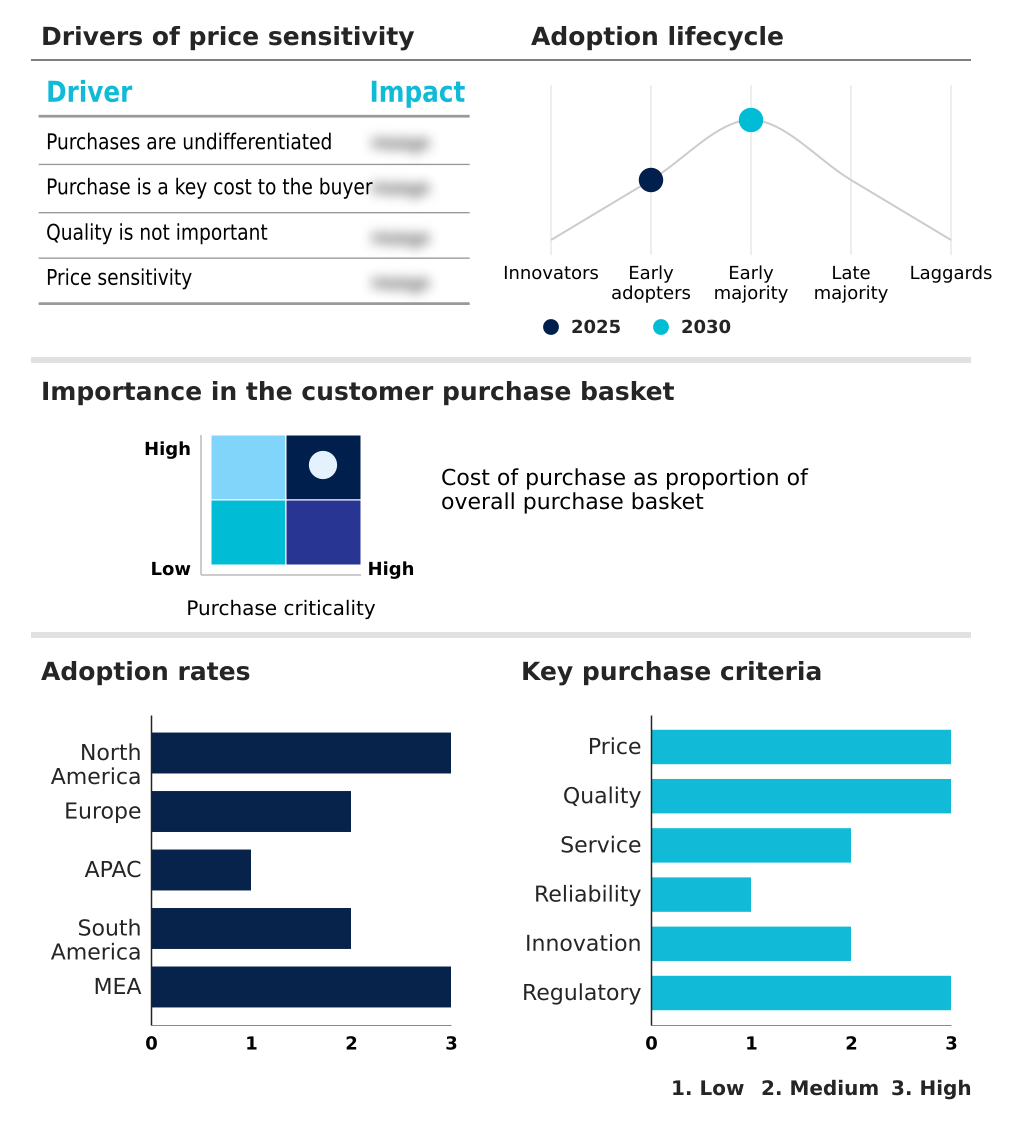
Exclusive Technavio Analysis on Customer Landscape

The foreign exchange market forecasting report includes the adoption lifecycle of the market, covering from the innovator’s stage to the laggard’s stage. It focuses on adoption rates in different regions based on penetration. Furthermore, the foreign exchange market report also includes key purchase criteria and drivers of price sensitivity to help companies evaluate and develop their market growth analysis strategies.

Customer Landscape of Foreign Exchange Industry

Competitive Landscape

Companies are implementing various strategies, such as strategic alliances, foreign exchange market forecast, partnerships, mergers and acquisitions, geographical expansion, and product/service launches, to enhance their presence in the industry.

Airwallex Pty Ltd. - Delivers financial infrastructure enabling businesses to manage global payments and multi-currency accounts, streamlining cross-border commerce and treasury functions.

The industry research and growth report includes detailed analyses of the competitive landscape of the market and information about key companies, including:

  • Airwallex Pty Ltd.
  • Barclays PLC
  • Bloomberg LP
  • Citigroup Inc.
  • CLS Group Holdings AG
  • Convera Holdings LLC
  • Deutsche Bank AG
  • HSBC Holdings Plc
  • JPMorgan Chase and Co.
  • London Stock Exchange Group plc
  • Morgan Stanley
  • OANDA Global Corp.
  • Revolut Ltd.
  • Standard Chartered PLC
  • State Street Corp.
  • SWIFT SC
  • The Currency Cloud Ltd.
  • The Goldman Sachs Group Inc.
  • UBS Group AG
  • Visa Inc.

Qualitative and quantitative analysis of companies has been conducted to help clients understand the wider business environment as well as the strengths and weaknesses of key industry players. Data is qualitatively analyzed to categorize companies as pure play, category-focused, industry-focused, and diversified; it is quantitatively analyzed to categorize companies as dominant, leading, strong, tentative, and weak.

Recent Development and News in Foreign exchange market

  • In May 2025, MercadoLibre announced a strategic partnership with Circle to integrate the USDC stablecoin for cross-border payments on its e-commerce platform across Brazil, Mexico, and Chile, creating an alternative payment rail.
  • In April 2025, CME Group launched its FX Spot+ service, an all-to-all spot foreign exchange marketplace designed to centralize liquidity and provide buy-side institutions with more direct and efficient trade execution mechanisms.
  • In March 2025, DBS Bank introduced SecureFX, a service that empowers small and medium-sized enterprises to lock in forward exchange rates, making currency risk management tools more accessible beyond large corporations.
  • In January 2025, Deutsche Bank launched its dbX correspondent banking platform, integrating cross-border payment services with foreign exchange management to offer a streamlined solution for correspondent banks and their clients.

Dive into Technavio’s robust research methodology, blending expert interviews, extensive data synthesis, and validated models for unparalleled Foreign Exchange Market insights. See full methodology.

Market Scope
Page number 292
Base year 2025
Historic period 2020-2024
Forecast period 2026-2030
Growth momentum & CAGR Accelerate at a CAGR of 10.8%
Market growth 2026-2030 USD 651.3 million
Market structure Fragmented
YoY growth 2025-2026(%) 9.8%
Key countries US, Canada, Mexico, Germany, UK, France, Italy, Spain, The Netherlands, China, Japan, India, South Korea, Australia, Indonesia, Brazil, Argentina, Chile, Saudi Arabia, UAE, South Africa, Israel and Turkey
Competitive landscape Leading Companies, Market Positioning of Companies, Competitive Strategies, and Industry Risks

Request Free Sample

Research Analyst Overview

  • The foreign exchange market is undergoing a structural transformation driven by technological innovation and evolving participant needs. The rise of electronic trading platforms and the widespread adoption of algorithmic trading and high-frequency trading strategies have fundamentally altered price discovery and market microstructure. This has intensified competition and led to the emergence of flash volatility and dark pools, posing new challenges.
  • In response, there is a greater focus on robust risk management tools, including sophisticated FX options, currency swaps, and other over-the-counter derivatives. The development of distributed ledger technology and central bank digital currencies promises to revolutionize payment-versus-payment settlement and correspondent banking, potentially reducing settlement risk. Institutions are utilizing multi-bank portals to access deeper liquidity and improve execution.
  • For boardrooms, the critical decision area is now the strategic adoption of these technologies, as firms using AI-driven analytics have reported a 20% improvement in hedging effectiveness. This technological arms race, set against a backdrop of monetary policy divergence and geopolitical instability, is redefining the competitive landscape for all involved in institutional fx trading.

What are the Key Data Covered in this Foreign Exchange Market Research and Growth Report?

  • What is the expected growth of the Foreign Exchange Market between 2026 and 2030?

    • USD 651.3 million, at a CAGR of 10.8%

  • What segmentation does the market report cover?

    • The report is segmented by Type (Reporting dealers, Financial institutions, and Non-financial customers), Trade Finance Instruments (Currency swaps, Outright forward and FX swaps, and FX options), Channel (Online, and Offline) and Geography (North America, Europe, APAC, South America, Middle East and Africa)

  • Which regions are analyzed in the report?

    • North America, Europe, APAC, South America and Middle East and Africa

  • What are the key growth drivers and market challenges?

    • Heightened monetary policy divergence and interest rate differentials, Heightened geopolitical instability and fragmented regulatory frameworks

  • Who are the major players in the Foreign Exchange Market?

    • Airwallex Pty Ltd., Barclays PLC, Bloomberg LP, Citigroup Inc., CLS Group Holdings AG, Convera Holdings LLC, Deutsche Bank AG, HSBC Holdings Plc, JPMorgan Chase and Co., London Stock Exchange Group plc, Morgan Stanley, OANDA Global Corp., Revolut Ltd., Standard Chartered PLC, State Street Corp., SWIFT SC, The Currency Cloud Ltd., The Goldman Sachs Group Inc., UBS Group AG and Visa Inc.

Market Research Insights

  • The market's dynamics are increasingly shaped by technological advancements that enhance efficiency and accessibility for a diverse range of participants. The adoption of sophisticated treasury management and compliance technology has streamlined foreign exchange risk management, allowing firms to mitigate transaction, translation, and economic risks more effectively.
  • This digital shift has improved market access for financial institutions and non-financial customers alike, with some platforms reducing transaction costs by up to 15%. Innovations in back-office functions and the growth of global payment infrastructure are reducing settlement times and enhancing transparency.
  • The focus on robust credit and liquidity risk management continues to be a priority, influencing how market participants interact and manage their exposures in an interconnected environment.

We can help! Our analysts can customize this foreign exchange market research report to meet your requirements.

Get in touch

1. Executive Summary

1.1 Market overview

Executive Summary - Chart on Market Overview
Executive Summary - Data Table on Market Overview
Executive Summary - Chart on Global Market Characteristics
Executive Summary - Chart on Market by Geography
Executive Summary - Chart on Market Segmentation by Type
Executive Summary - Chart on Market Segmentation by Trade Finance Instruments
Executive Summary - Chart on Market Segmentation by Channel
Executive Summary - Chart on Incremental Growth
Executive Summary - Data Table on Incremental Growth
Executive Summary - Chart on Company Market Positioning

2. Technavio Analysis

2.1 Analysis of price sensitivity, lifecycle, customer purchase basket, adoption rates, and purchase criteria

2.2 Criticality of inputs and Factors of differentiation

Chart on Overview on criticality of inputs and factors of differentiation

2.3 Factors of disruption

Chart on Overview on factors of disruption

2.4 Impact of drivers and challenges

Chart on Impact of drivers and challenges in 2025 and 2030

3. Market Landscape

3.1 Market ecosystem

Chart on Parent Market
Data Table on - Parent Market

3.2 Market characteristics

Chart on Market characteristics analysis

3.3 Value chain analysis

Chart on Value chain analysis

4. Market Sizing

4.1 Market definition

Data Table on Offerings of companies included in the market definition

4.2 Market segment analysis

Market segments

4.3 Market size 2025

4.4 Market outlook: Forecast for 2025-2030

Chart on Global - Market size and forecast 2025-2030 ($ million)
Data Table on Global - Market size and forecast 2025-2030 ($ million)
Chart on Global Market: Year-over-year growth 2025-2030 (%)
Data Table on Global Market: Year-over-year growth 2025-2030 (%)

5. Historic Market Size

5.1 Global Foreign Exchange Market 2020 - 2024

Historic Market Size - Data Table on Global Foreign Exchange Market 2020 - 2024 ($ million)

5.2 Type segment analysis 2020 - 2024

Historic Market Size - Type Segment 2020 - 2024 ($ million)

5.3 Trade Finance Instruments segment analysis 2020 - 2024

Historic Market Size - Trade Finance Instruments Segment 2020 - 2024 ($ million)

5.4 Channel segment analysis 2020 - 2024

Historic Market Size - Channel Segment 2020 - 2024 ($ million)

5.5 Geography segment analysis 2020 - 2024

Historic Market Size - Geography Segment 2020 - 2024 ($ million)

5.6 Country segment analysis 2020 - 2024

Historic Market Size - Country Segment 2020 - 2024 ($ million)

6. Qualitative Analysis

6.1 Impact of AI on global foreign exchange market

6.2 Impact of geopolitical conflicts on global foreign exchange market

7. Five Forces Analysis

7.1 Five forces summary

Five forces analysis - Comparison between 2025 and 2030

7.2 Bargaining power of buyers

Bargaining power of buyers - Impact of key factors 2025 and 2030

7.3 Bargaining power of suppliers

Bargaining power of suppliers - Impact of key factors in 2025 and 2030

7.4 Threat of new entrants

Threat of new entrants - Impact of key factors in 2025 and 2030

7.5 Threat of substitutes

Threat of substitutes - Impact of key factors in 2025 and 2030

7.6 Threat of rivalry

Threat of rivalry - Impact of key factors in 2025 and 2030

7.7 Market condition

Chart on Market condition - Five forces 2025 and 2030

8. Market Segmentation by Type

8.1 Market segments

Chart on Type - Market share 2025-2030 (%)
Data Table on Type - Market share 2025-2030 (%)

8.2 Comparison by Type

Chart on Comparison by Type
Data Table on Comparison by Type

8.3 Reporting dealers - Market size and forecast 2025-2030

Chart on Reporting dealers - Market size and forecast 2025-2030 ($ million)
Data Table on Reporting dealers - Market size and forecast 2025-2030 ($ million)
Chart on Reporting dealers - Year-over-year growth 2025-2030 (%)
Data Table on Reporting dealers - Year-over-year growth 2025-2030 (%)

8.4 Financial institutions - Market size and forecast 2025-2030

Chart on Financial institutions - Market size and forecast 2025-2030 ($ million)
Data Table on Financial institutions - Market size and forecast 2025-2030 ($ million)
Chart on Financial institutions - Year-over-year growth 2025-2030 (%)
Data Table on Financial institutions - Year-over-year growth 2025-2030 (%)

8.5 Non-financial customers - Market size and forecast 2025-2030

Chart on Non-financial customers - Market size and forecast 2025-2030 ($ million)
Data Table on Non-financial customers - Market size and forecast 2025-2030 ($ million)
Chart on Non-financial customers - Year-over-year growth 2025-2030 (%)
Data Table on Non-financial customers - Year-over-year growth 2025-2030 (%)

8.6 Market opportunity by Type

Market opportunity by Type ($ million)
Data Table on Market opportunity by Type ($ million)

9. Market Segmentation by Trade Finance Instruments

9.1 Market segments

Chart on Trade Finance Instruments - Market share 2025-2030 (%)
Data Table on Trade Finance Instruments - Market share 2025-2030 (%)

9.2 Comparison by Trade Finance Instruments

Chart on Comparison by Trade Finance Instruments
Data Table on Comparison by Trade Finance Instruments

9.3 Currency swaps - Market size and forecast 2025-2030

Chart on Currency swaps - Market size and forecast 2025-2030 ($ million)
Data Table on Currency swaps - Market size and forecast 2025-2030 ($ million)
Chart on Currency swaps - Year-over-year growth 2025-2030 (%)
Data Table on Currency swaps - Year-over-year growth 2025-2030 (%)

9.4 Outright forward and FX swaps - Market size and forecast 2025-2030

Chart on Outright forward and FX swaps - Market size and forecast 2025-2030 ($ million)
Data Table on Outright forward and FX swaps - Market size and forecast 2025-2030 ($ million)
Chart on Outright forward and FX swaps - Year-over-year growth 2025-2030 (%)
Data Table on Outright forward and FX swaps - Year-over-year growth 2025-2030 (%)

9.5 FX options - Market size and forecast 2025-2030

Chart on FX options - Market size and forecast 2025-2030 ($ million)
Data Table on FX options - Market size and forecast 2025-2030 ($ million)
Chart on FX options - Year-over-year growth 2025-2030 (%)
Data Table on FX options - Year-over-year growth 2025-2030 (%)

9.6 Market opportunity by Trade Finance Instruments

Market opportunity by Trade Finance Instruments ($ million)
Data Table on Market opportunity by Trade Finance Instruments ($ million)

10. Market Segmentation by Channel

10.1 Market segments

Chart on Channel - Market share 2025-2030 (%)
Data Table on Channel - Market share 2025-2030 (%)

10.2 Comparison by Channel

Chart on Comparison by Channel
Data Table on Comparison by Channel

10.3 Online - Market size and forecast 2025-2030

Chart on Online - Market size and forecast 2025-2030 ($ million)
Data Table on Online - Market size and forecast 2025-2030 ($ million)
Chart on Online - Year-over-year growth 2025-2030 (%)
Data Table on Online - Year-over-year growth 2025-2030 (%)

10.4 Offline - Market size and forecast 2025-2030

Chart on Offline - Market size and forecast 2025-2030 ($ million)
Data Table on Offline - Market size and forecast 2025-2030 ($ million)
Chart on Offline - Year-over-year growth 2025-2030 (%)
Data Table on Offline - Year-over-year growth 2025-2030 (%)

10.5 Market opportunity by Channel

Market opportunity by Channel ($ million)
Data Table on Market opportunity by Channel ($ million)

11. Customer Landscape

11.1 Customer landscape overview

Analysis of price sensitivity, lifecycle, customer purchase basket, adoption rates, and purchase criteria

12. Geographic Landscape

12.1 Geographic segmentation

Chart on Market share by geography 2025-2030 (%)
Data Table on Market share by geography 2025-2030 (%)

12.2 Geographic comparison

Chart on Geographic comparison
Data Table on Geographic comparison

12.3 North America - Market size and forecast 2025-2030

Chart on North America - Market size and forecast 2025-2030 ($ million)
Data Table on North America - Market size and forecast 2025-2030 ($ million)
Chart on North America - Year-over-year growth 2025-2030 (%)
Data Table on North America - Year-over-year growth 2025-2030 (%)
Chart on Regional Comparison - North America
Data Table on Regional Comparison - North America

12.3.1 US - Market size and forecast 2025-2030

Chart on US - Market size and forecast 2025-2030 ($ million)
Data Table on US - Market size and forecast 2025-2030 ($ million)
Chart on US - Year-over-year growth 2025-2030 (%)
Data Table on US - Year-over-year growth 2025-2030 (%)

12.3.2 Canada - Market size and forecast 2025-2030

Chart on Canada - Market size and forecast 2025-2030 ($ million)
Data Table on Canada - Market size and forecast 2025-2030 ($ million)
Chart on Canada - Year-over-year growth 2025-2030 (%)
Data Table on Canada - Year-over-year growth 2025-2030 (%)

12.3.3 Mexico - Market size and forecast 2025-2030

Chart on Mexico - Market size and forecast 2025-2030 ($ million)
Data Table on Mexico - Market size and forecast 2025-2030 ($ million)
Chart on Mexico - Year-over-year growth 2025-2030 (%)
Data Table on Mexico - Year-over-year growth 2025-2030 (%)

12.4 Europe - Market size and forecast 2025-2030

Chart on Europe - Market size and forecast 2025-2030 ($ million)
Data Table on Europe - Market size and forecast 2025-2030 ($ million)
Chart on Europe - Year-over-year growth 2025-2030 (%)
Data Table on Europe - Year-over-year growth 2025-2030 (%)
Chart on Regional Comparison - Europe
Data Table on Regional Comparison - Europe

12.4.1 Germany - Market size and forecast 2025-2030

Chart on Germany - Market size and forecast 2025-2030 ($ million)
Data Table on Germany - Market size and forecast 2025-2030 ($ million)
Chart on Germany - Year-over-year growth 2025-2030 (%)
Data Table on Germany - Year-over-year growth 2025-2030 (%)

12.4.2 UK - Market size and forecast 2025-2030

Chart on UK - Market size and forecast 2025-2030 ($ million)
Data Table on UK - Market size and forecast 2025-2030 ($ million)
Chart on UK - Year-over-year growth 2025-2030 (%)
Data Table on UK - Year-over-year growth 2025-2030 (%)

12.4.3 France - Market size and forecast 2025-2030

Chart on France - Market size and forecast 2025-2030 ($ million)
Data Table on France - Market size and forecast 2025-2030 ($ million)
Chart on France - Year-over-year growth 2025-2030 (%)
Data Table on France - Year-over-year growth 2025-2030 (%)

12.4.4 Italy - Market size and forecast 2025-2030

Chart on Italy - Market size and forecast 2025-2030 ($ million)
Data Table on Italy - Market size and forecast 2025-2030 ($ million)
Chart on Italy - Year-over-year growth 2025-2030 (%)
Data Table on Italy - Year-over-year growth 2025-2030 (%)

12.4.5 Spain - Market size and forecast 2025-2030

Chart on Spain - Market size and forecast 2025-2030 ($ million)
Data Table on Spain - Market size and forecast 2025-2030 ($ million)
Chart on Spain - Year-over-year growth 2025-2030 (%)
Data Table on Spain - Year-over-year growth 2025-2030 (%)

12.4.6 The Netherlands - Market size and forecast 2025-2030

Chart on The Netherlands - Market size and forecast 2025-2030 ($ million)
Data Table on The Netherlands - Market size and forecast 2025-2030 ($ million)
Chart on The Netherlands - Year-over-year growth 2025-2030 (%)
Data Table on The Netherlands - Year-over-year growth 2025-2030 (%)

12.5 APAC - Market size and forecast 2025-2030

Chart on APAC - Market size and forecast 2025-2030 ($ million)
Data Table on APAC - Market size and forecast 2025-2030 ($ million)
Chart on APAC - Year-over-year growth 2025-2030 (%)
Data Table on APAC - Year-over-year growth 2025-2030 (%)
Chart on Regional Comparison - APAC
Data Table on Regional Comparison - APAC

12.5.1 China - Market size and forecast 2025-2030

Chart on China - Market size and forecast 2025-2030 ($ million)
Data Table on China - Market size and forecast 2025-2030 ($ million)
Chart on China - Year-over-year growth 2025-2030 (%)
Data Table on China - Year-over-year growth 2025-2030 (%)

12.5.2 Japan - Market size and forecast 2025-2030

Chart on Japan - Market size and forecast 2025-2030 ($ million)
Data Table on Japan - Market size and forecast 2025-2030 ($ million)
Chart on Japan - Year-over-year growth 2025-2030 (%)
Data Table on Japan - Year-over-year growth 2025-2030 (%)

12.5.3 India - Market size and forecast 2025-2030

Chart on India - Market size and forecast 2025-2030 ($ million)
Data Table on India - Market size and forecast 2025-2030 ($ million)
Chart on India - Year-over-year growth 2025-2030 (%)
Data Table on India - Year-over-year growth 2025-2030 (%)

12.5.4 South Korea - Market size and forecast 2025-2030

Chart on South Korea - Market size and forecast 2025-2030 ($ million)
Data Table on South Korea - Market size and forecast 2025-2030 ($ million)
Chart on South Korea - Year-over-year growth 2025-2030 (%)
Data Table on South Korea - Year-over-year growth 2025-2030 (%)

12.5.5 Australia - Market size and forecast 2025-2030

Chart on Australia - Market size and forecast 2025-2030 ($ million)
Data Table on Australia - Market size and forecast 2025-2030 ($ million)
Chart on Australia - Year-over-year growth 2025-2030 (%)
Data Table on Australia - Year-over-year growth 2025-2030 (%)

12.5.6 Indonesia - Market size and forecast 2025-2030

Chart on Indonesia - Market size and forecast 2025-2030 ($ million)
Data Table on Indonesia - Market size and forecast 2025-2030 ($ million)
Chart on Indonesia - Year-over-year growth 2025-2030 (%)
Data Table on Indonesia - Year-over-year growth 2025-2030 (%)

12.6 South America - Market size and forecast 2025-2030

Chart on South America - Market size and forecast 2025-2030 ($ million)
Data Table on South America - Market size and forecast 2025-2030 ($ million)
Chart on South America - Year-over-year growth 2025-2030 (%)
Data Table on South America - Year-over-year growth 2025-2030 (%)
Chart on Regional Comparison - South America
Data Table on Regional Comparison - South America

12.6.1 Brazil - Market size and forecast 2025-2030

Chart on Brazil - Market size and forecast 2025-2030 ($ million)
Data Table on Brazil - Market size and forecast 2025-2030 ($ million)
Chart on Brazil - Year-over-year growth 2025-2030 (%)
Data Table on Brazil - Year-over-year growth 2025-2030 (%)

12.6.2 Argentina - Market size and forecast 2025-2030

Chart on Argentina - Market size and forecast 2025-2030 ($ million)
Data Table on Argentina - Market size and forecast 2025-2030 ($ million)
Chart on Argentina - Year-over-year growth 2025-2030 (%)
Data Table on Argentina - Year-over-year growth 2025-2030 (%)

12.6.3 Chile - Market size and forecast 2025-2030

Chart on Chile - Market size and forecast 2025-2030 ($ million)
Data Table on Chile - Market size and forecast 2025-2030 ($ million)
Chart on Chile - Year-over-year growth 2025-2030 (%)
Data Table on Chile - Year-over-year growth 2025-2030 (%)

12.7 Middle East and Africa - Market size and forecast 2025-2030

Chart on Middle East and Africa - Market size and forecast 2025-2030 ($ million)
Data Table on Middle East and Africa - Market size and forecast 2025-2030 ($ million)
Chart on Middle East and Africa - Year-over-year growth 2025-2030 (%)
Data Table on Middle East and Africa - Year-over-year growth 2025-2030 (%)
Chart on Regional Comparison - Middle East and Africa
Data Table on Regional Comparison - Middle East and Africa

12.7.1 Saudi Arabia - Market size and forecast 2025-2030

Chart on Saudi Arabia - Market size and forecast 2025-2030 ($ million)
Data Table on Saudi Arabia - Market size and forecast 2025-2030 ($ million)
Chart on Saudi Arabia - Year-over-year growth 2025-2030 (%)
Data Table on Saudi Arabia - Year-over-year growth 2025-2030 (%)

12.7.2 UAE - Market size and forecast 2025-2030

Chart on UAE - Market size and forecast 2025-2030 ($ million)
Data Table on UAE - Market size and forecast 2025-2030 ($ million)
Chart on UAE - Year-over-year growth 2025-2030 (%)
Data Table on UAE - Year-over-year growth 2025-2030 (%)

12.7.3 South Africa - Market size and forecast 2025-2030

Chart on South Africa - Market size and forecast 2025-2030 ($ million)
Data Table on South Africa - Market size and forecast 2025-2030 ($ million)
Chart on South Africa - Year-over-year growth 2025-2030 (%)
Data Table on South Africa - Year-over-year growth 2025-2030 (%)

12.7.4 Israel - Market size and forecast 2025-2030

Chart on Israel - Market size and forecast 2025-2030 ($ million)
Data Table on Israel - Market size and forecast 2025-2030 ($ million)
Chart on Israel - Year-over-year growth 2025-2030 (%)
Data Table on Israel - Year-over-year growth 2025-2030 (%)

12.7.5 Turkey - Market size and forecast 2025-2030

Chart on Turkey - Market size and forecast 2025-2030 ($ million)
Data Table on Turkey - Market size and forecast 2025-2030 ($ million)
Chart on Turkey - Year-over-year growth 2025-2030 (%)
Data Table on Turkey - Year-over-year growth 2025-2030 (%)

12.8 Market opportunity by geography

Market opportunity by geography ($ million)
Data Tables on Market opportunity by geography ($ million)

13. Drivers, Challenges, and Opportunity

13.1 Market drivers

Heightened monetary policy divergence and interest rate differentials
Expansion of international trade and cross-border investment flows
Rapid technological advancement and digitalization of trading infrastructure

13.2 Market challenges

Heightened geopolitical instability and fragmented regulatory frameworks
Cybersecurity vulnerabilities and rise of sophisticated financial crime
Liquidity fragmentation and risks of flash volatility

13.3 Impact of drivers and challenges

Impact of drivers and challenges in 2025 and 2030

13.4 Market opportunities

Proliferation of sustainable finance and green currency initiatives
Integration of central bank digital currencies and distributed ledger technology
Standardisation of global trading practices

14. Competitive Landscape

14.1 Overview

14.2

Overview on criticality of inputs and factors of differentiation

14.3 Landscape disruption

Overview on factors of disruption

14.4 Industry risks

Impact of key risks on business

15. Competitive Analysis

15.1 Companies profiled

Companies covered

15.2 Company ranking index

15.3 Market positioning of companies

Matrix on companies position and classification

15.4 Airwallex Pty Ltd.

Airwallex Pty Ltd. - Overview
Airwallex Pty Ltd. - Product / Service
Airwallex Pty Ltd. - Key offerings
SWOT

15.5 Barclays PLC

Barclays PLC - Overview
Barclays PLC - Business segments
Barclays PLC - Key offerings
Barclays PLC - Segment focus
SWOT

15.6 Bloomberg LP

Bloomberg LP - Overview
Bloomberg LP - Product / Service
Bloomberg LP - Key offerings
SWOT

15.7 Citigroup Inc.

Citigroup Inc. - Overview
Citigroup Inc. - Business segments
Citigroup Inc. - Key offerings
Citigroup Inc. - Segment focus
SWOT

15.8 Deutsche Bank AG

Deutsche Bank AG - Overview
Deutsche Bank AG - Business segments
Deutsche Bank AG - Key offerings
Deutsche Bank AG - Segment focus
SWOT

15.9 HSBC Holdings Plc

HSBC Holdings Plc - Overview
HSBC Holdings Plc - Business segments
HSBC Holdings Plc - Key offerings
HSBC Holdings Plc - Segment focus
SWOT

15.10 JPMorgan Chase and Co.

JPMorgan Chase and Co. - Overview
JPMorgan Chase and Co. - Business segments
JPMorgan Chase and Co. - Key offerings
JPMorgan Chase and Co. - Segment focus
SWOT

15.11 London Stock Exchange Group plc

London Stock Exchange Group plc - Overview
London Stock Exchange Group plc - Business segments
London Stock Exchange Group plc - Key offerings
London Stock Exchange Group plc - Segment focus
SWOT

15.12 Morgan Stanley

Morgan Stanley - Overview
Morgan Stanley - Business segments
Morgan Stanley - Key offerings
Morgan Stanley - Segment focus
SWOT

15.13 Standard Chartered PLC

Standard Chartered PLC - Overview
Standard Chartered PLC - Business segments
Standard Chartered PLC - Key offerings
Standard Chartered PLC - Segment focus
SWOT

15.14 State Street Corp.

State Street Corp. - Overview
State Street Corp. - Business segments
State Street Corp. - Key offerings
State Street Corp. - Segment focus
SWOT

15.15 The Currency Cloud Ltd.

The Currency Cloud Ltd. - Overview
The Currency Cloud Ltd. - Product / Service
The Currency Cloud Ltd. - Key offerings
SWOT

15.16 The Goldman Sachs Group Inc.

The Goldman Sachs Group Inc. - Overview
The Goldman Sachs Group Inc. - Business segments
The Goldman Sachs Group Inc. - Key offerings
The Goldman Sachs Group Inc. - Segment focus
SWOT

15.17 UBS Group AG

UBS Group AG - Overview
UBS Group AG - Business segments
UBS Group AG - Key offerings
UBS Group AG - Segment focus
SWOT

15.18 Visa Inc.

Visa Inc. - Overview
Visa Inc. - Product / Service
Visa Inc. - Key offerings
SWOT

16. Appendix

16.1 Scope of the report

Market definition
Objectives
Notes and caveats

16.2 Inclusions and exclusions checklist

Inclusions checklist
Exclusions checklist

16.3 Currency conversion rates for US$

16.4 Research methodology

16.5 Data procurement

Information sources

16.6 Data validation

16.7 Validation techniques employed for market sizing

16.8 Data synthesis

16.9 360 degree market analysis

16.10 List of abbreviations

Research Methodology

Technavio presents a detailed picture of the market by way of study, synthesis, and summation of data from multiple sources. The analysts have presented the various facets of the market with a particular focus on identifying the key industry influencers. The data thus presented is comprehensive, reliable, and the result of extensive research, both primary and secondary.

INFORMATION SOURCES

Primary sources

  • Manufacturers and suppliers
  • Channel partners
  • Industry experts
  • Strategic decision makers

Secondary sources

  • Industry journals and periodicals
  • Government data
  • Financial reports of key industry players
  • Historical data
  • Press releases

DATA ANALYSIS

Data Synthesis

  • Collation of data
  • Estimation of key figures
  • Analysis of derived insights

Data Validation

  • Triangulation with data models
  • Reference against proprietary databases
  • Corroboration with industry experts

REPORT WRITING

Qualitative

  • Market drivers
  • Market challenges
  • Market trends
  • Five forces analysis

Quantitative

  • Market size and forecast
  • Market segmentation
  • Geographical insights
  • Competitive landscape

Interested in this report?

Get your sample now to see our research methodology and insights!

Download Now

Frequently Asked Questions

Foreign Exchange market growth will increase by USD 651.3 million during 2026-2030.

The Foreign Exchange market is expected to grow at a CAGR of 10.8% during 2026-2030.

Foreign Exchange market is segmented by Type (Reporting dealers, Financial institutions, Non-financial customers) Trade finance instruments (Currency swaps, Outright forward and FX swaps, FX options) Channel (Online, Offline)

Airwallex Pty Ltd., Barclays PLC, Bloomberg LP, Citigroup Inc., CLS Group Holdings AG, Convera Holdings LLC, Deutsche Bank AG, HSBC Holdings Plc, JPMorgan Chase and Co., London Stock Exchange Group plc, Morgan Stanley, OANDA Global Corp., Revolut Ltd., Standard Chartered PLC, State Street Corp., SWIFT SC, The Currency Cloud Ltd., The Goldman Sachs Group Inc., UBS Group AG, Visa Inc. are a few of the key vendors in the Foreign Exchange market.

North America will register the highest growth rate of 41.9% among the other regions. Therefore, the Foreign Exchange market in North America is expected to garner significant business opportunities for the vendors during the forecast period.

US, Canada, Mexico, Germany, UK, France, Italy, Spain, The Netherlands, China, Japan, India, South Korea, Australia, Indonesia, Brazil, Argentina, Chile, Saudi Arabia, UAE, South Africa, Israel, Turkey

  • Heightened monetary policy divergence and interest rate differentials is the driving factor this market.

The Foreign Exchange market vendors should focus on grabbing business opportunities from the Type segment as it accounted for the largest market share in the base year.
RIA - Research AI Assistant
Ask RIA