Frozen And Freeze Dried Pet Food Market Size 2025-2029
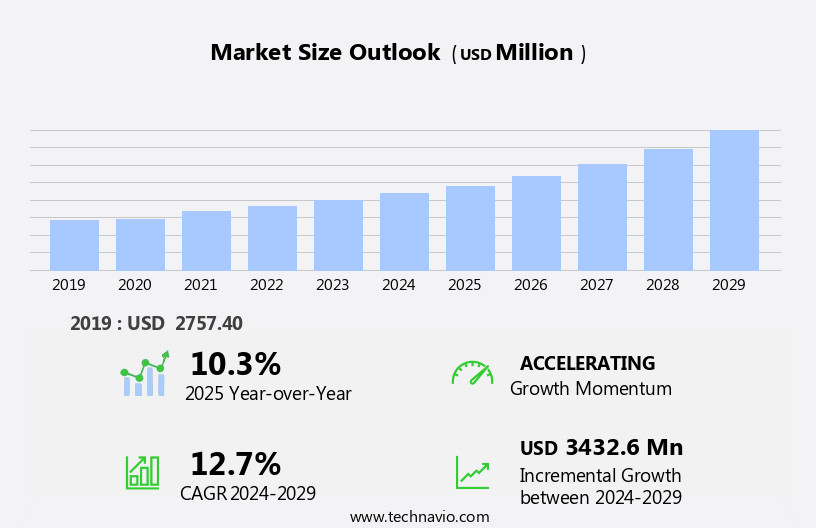
The frozen and freeze dried pet food market size is forecast to increase by USD 3.43 billion, at a CAGR of 12.7% between 2024 and 2029.
- The market is witnessing significant growth, driven by the rising awareness of pet nutrition and continuous progress in freeze drying technology. Pet owners are increasingly focusing on providing their pets with high-quality, nutritious food, leading to a surge in demand for frozen and freeze dried options. These methods of preservation help maintain the food's original texture, taste, and nutritional value, making them an attractive choice for discerning pet parents. However, the high production cost of frozen and freeze dried pet food poses a considerable challenge for market participants. The intricacies of these preservation techniques require substantial investments in specialized equipment and energy consumption, which can significantly increase the final product price.
- Companies must carefully balance the benefits of these premium offerings with the need to remain competitive and accessible to a broad consumer base. To capitalize on the market's potential, businesses must explore cost-effective production methods and innovative pricing strategies while maintaining the high-quality standards that differentiate frozen and freeze dried pet food from conventional alternatives.
What will be the Size of the Frozen And Freeze Dried Pet Food Market during the forecast period?
Explore in-depth regional segment analysis with market size data - historical 2019-2023 and forecasts 2025-2029 - in the full report.
Request Free Sample
The frozen and freeze-dried pet food market continues to evolve, driven by shifting consumer preferences and advancements in technology. Human-grade ingredients have gained prominence, with an increasing number of pet food brands focusing on high-quality, minimally processed offerings. Food recalls have heightened the importance of food safety and quality control, leading to stricter regulations and supply chain management. Frozen and freeze-dried pet foods offer extended shelf life, preserving nutritional value and flavor profiles. Super-premium pet food brands have capitalized on this trend, introducing innovative product formulations with optimal mineral, vitamin, fiber, protein, and fat content.
Manufacturing processes have evolved, with vacuum sealing and freeze-drying technology becoming standard practices. Packaging materials have also seen advancements, with pet food pouches and portion control packaging gaining popularity. Consumer preferences for holistic and organic pet food have led to the development of new product lines, while private label offerings have increased in response to demand. Labeling requirements and FDA regulations continue to shape the market, with a focus on transparency and clear communication. The ongoing unfolding of market activities includes the integration of preservation techniques, such as AAFCO standards and FDA regulations, to ensure food safety and nutritional value.
Ingredient sourcing and sustainability have become essential considerations, with pet owner demographics increasingly seeking eco-friendly and ethical options. The evolving dynamics of the market continue to shape the landscape, with ongoing innovations in flavor profiles, portion size, and packaging.
How is this Frozen And Freeze Dried Pet Food Industry segmented?
The frozen and freeze dried pet food industry research report provides comprehensive data (region-wise segment analysis), with forecasts and estimates in "USD million" for the period 2025-2029, as well as historical data from 2019-2023 for the following segments.
- Distribution Channel
- Offline
- Online
- Animal Type
- Dog
- Cat
- Others
- Geography
- North America
- US
- Canada
- Europe
- France
- Germany
- UK
- APAC
- Australia
- China
- India
- Japan
- South America
- Brazil
- Rest of World (ROW)
- North America
By Distribution Channel Insights
The offline segment is estimated to witness significant growth during the forecast period.
The Frozen and Freeze-Dried Pet Food Market in the US is experiencing significant growth, driven by consumer preferences for high-quality, nutritious options. Human-grade ingredients, free from recalls, are increasingly being used in pet food production. Pet food storage solutions, adhering to AAFCO standards, ensure the maintenance of essential minerals and vitamins. Organic and holistic pet food, with optimal fiber content, cater to the health-conscious pet owner demographic. Meat-based pet food, utilizing freeze-drying technology, offers extended shelf life and preserves the natural flavor profiles. Premium and super-premium pet food brands prioritize quality control, supply chain transparency, and innovative packaging, such as vacuum sealing and pet food pouches.
Consumer preferences lean towards raw diets, dehydrated pet food, and single-ingredient options. Recipe development and ingredient sourcing are crucial aspects of manufacturing processes, ensuring nutritional value and food safety. Vegetable-based pet food and grain-free options cater to diverse pet owner needs. Frozen pet food, with proper preservation techniques, offers a long shelf life and maintains the food's nutritional value. Packaging innovations, such as portion control and portion size, enhance the overall convenience for pet owners. Pet food brands prioritize labeling requirements and FDA regulations to maintain transparency and trust with consumers. Food safety and ingredient sourcing are essential considerations in the evolving pet food market.

The Offline segment was valued at USD 1.91 billion in 2019 and showed a gradual increase during the forecast period.
Regional Analysis
North America is estimated to contribute 41% to the growth of the global market during the forecast period.Technavio’s analysts have elaborately explained the regional trends and drivers that shape the market during the forecast period.
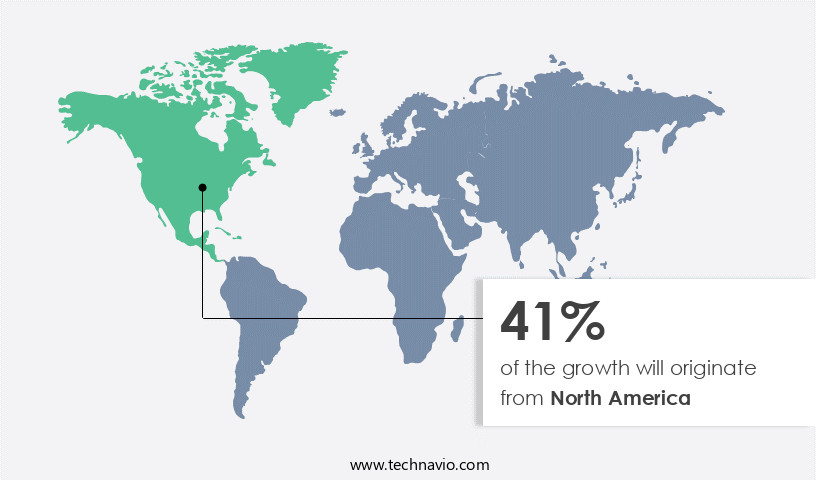
The frozen and freeze-dried pet food market in North America is experiencing significant growth due to the increasing trend of pet humanization and the growing awareness among pet owners about the importance of providing high-quality, nutritious food for their pets. This region's large pet population, particularly in countries like the US, Canada, and Mexico, is driving market demand. Pet owners in the US are increasingly scrutinizing the ingredients used in pet food, leading to a preference for human-grade, organic, and natural ingredients in frozen and freeze-dried pet food. The market is also witnessing a rise in demand for meat-based pet food, which is rich in protein and essential nutrients.
Frozen and freeze-dried pet foods offer several advantages, including longer shelf life, improved flavor profiles, and enhanced preservation techniques, such as vacuum sealing and nitrogen flushing. These foods are also available in convenient portions and various packaging formats, including pouches and resealable bags. The market is also witnessing an increase in the popularity of holistic and grain-free pet food options, which cater to specific dietary needs and preferences. Super-premium pet food brands are increasingly investing in packaging innovations, such as biodegradable and recyclable materials, to meet the evolving demands of consumers. The market's growth is also influenced by regulatory bodies, such as the Association of American Feed Control Officials (AAFCO), which sets standards for pet food labeling and nutritional requirements.
Manufacturers are focusing on recipe development, ingredient sourcing, and manufacturing processes to meet these standards and ensure food safety. The supply chain and distribution channels for frozen and freeze-dried pet food are also evolving, with an increasing number of private label offerings and e-commerce platforms providing easy access to consumers. The market's future growth is expected to be driven by consumer preferences for convenient, nutritious, and high-quality pet food options.
Market Dynamics
Our researchers analyzed the data with 2024 as the base year, along with the key drivers, trends, and challenges. A holistic analysis of drivers will help companies refine their marketing strategies to gain a competitive advantage.
In the dynamic and expanding pet care industry, the frozen and freeze-dried pet food market continues to gain popularity among pet owners seeking optimal nutrition for their beloved companions. This market encompasses a range of products, including raw frozen and freeze-dried meals, treats, and supplements. Key players in this sector prioritize high-quality ingredients, such as human-grade meats, fruits, and vegetables. The convenience of freeze-dried options allows for extended shelf life and easy storage, while frozen meals offer the benefits of fresh, preservative-free food. Consumers value the health advantages, including improved digestion and immune system support, associated with these products. Additionally, the customizable portion sizes cater to various breeds and dietary needs, making frozen and freeze-dried pet food a versatile and attractive choice. The market's growth is driven by increasing awareness of pet health and wellness, as well as the desire for more natural and authentic alternatives to traditional kibble.
What are the key market drivers leading to the rise in the adoption of Frozen And Freeze Dried Pet Food Industry?
- The significant rise in awareness and understanding of the nutritional needs of pets is the primary factor fueling market growth in this sector.
- The frozen and freeze-dried pet food market has experienced significant growth due to increasing consumer awareness regarding pet nutrition and health. Pets require specific dietary needs, which homemade diets may not consistently meet. Some human foods, such as raisins, grapes, chocolates, and macadamia nuts, are harmful to pets and can cause various health issues. To ensure optimal pet health, pet owners have turned to frozen and freeze-dried pet food, which employs advanced preservation techniques, including vacuum sealing and careful quality control, to maintain flavor profiles and high protein content. These methods also extend the shelf life of the food.
- The holistic approach of these pet food options appeals to consumers, as they prioritize their pets' well-being. The supply chain and distribution channels for frozen and freeze-dried pet food have evolved to meet the increasing demand, offering a range of vegetable-based and protein-rich options. These foods cater to various dietary needs and preferences while maintaining the highest standards of quality.
What are the market trends shaping the Frozen And Freeze Dried Pet Food Industry?
- Freeze drying technology is experiencing continuous advancements, representing a significant market trend in the industry. This progressive development is crucial for enhancing the preservation and quality of various products, including food and pharmaceuticals.
- The freeze-dried pet food market experiences continuous expansion due to advancements in freeze-drying technology. This innovative process enhances efficiency and cost-effectiveness, enabling manufacturers to create super-premium, nutrient-rich pet food products. Freeze drying preserves the natural nutrients and flavors of raw ingredients, aligning with the health-conscious preferences of pet owners. The freeze-drying process involves rapidly freezing the food and removing moisture through sublimation, ensuring the retention of nutritional content and palatability. Recipe development plays a crucial role in the market, with manufacturers focusing on creating formulations that cater to various dietary needs and preferences. Portion control is another essential aspect, with packaging innovations facilitating convenient portion sizes for pet owners.
- Dehydrated pet food, including freeze-dried options, has gained popularity due to its extended shelf life and ease of use. As pet food brands prioritize product quality and consumer satisfaction, freeze-dried pet food continues to be a significant market trend. Portion size packaging ensures convenience for pet owners, while maintaining the integrity of the nutrient-dense food.
What challenges does the Frozen And Freeze Dried Pet Food Industry face during its growth?
- The high production costs associated with frozen and freeze-dried pet food represent a significant challenge to the growth of the pet food industry. With increasing consumer demand for premium, nutritious pet food options, manufacturers must balance the costs of producing these high-quality products against the competitive market landscape.
- The frozen and freeze-dried pet food market faces a challenge from the high production costs associated with this technology. Freeze drying requires significant investment in specialized equipment and energy, leading to increased production expenses. These costs are frequently transferred to consumers, resulting in higher prices for freeze-dried pet food products. For instance, premium brands like Fromm's Adult Gold and pawTree Freeze-Dried Raw Real Turkey retail at approximately USD1.18 - USD1.36 per pound and USD2.50 per pound, respectively. In contrast, traditional pet food alternatives, such as kibble and canned food, are more affordable. However, pet owners' growing focus on nutritional value and food safety is driving demand for these products.
- Single-ingredient and grain-free pet foods, which are often freeze-dried, cater to this trend. Labeling requirements and FDA regulations ensure transparency in ingredient sourcing and food safety. Despite the higher costs, the market's growth is fueled by pet owner demographics, particularly millennials, who prioritize their pets' health and wellbeing. The market's dynamics remain influenced by these factors.
Exclusive Customer Landscape
The frozen and freeze dried pet food market forecasting report includes the adoption lifecycle of the market, covering from the innovator’s stage to the laggard’s stage. It focuses on adoption rates in different regions based on penetration. Furthermore, the frozen and freeze dried pet food market report also includes key purchase criteria and drivers of price sensitivity to help companies evaluate and develop their market growth analysis strategies.
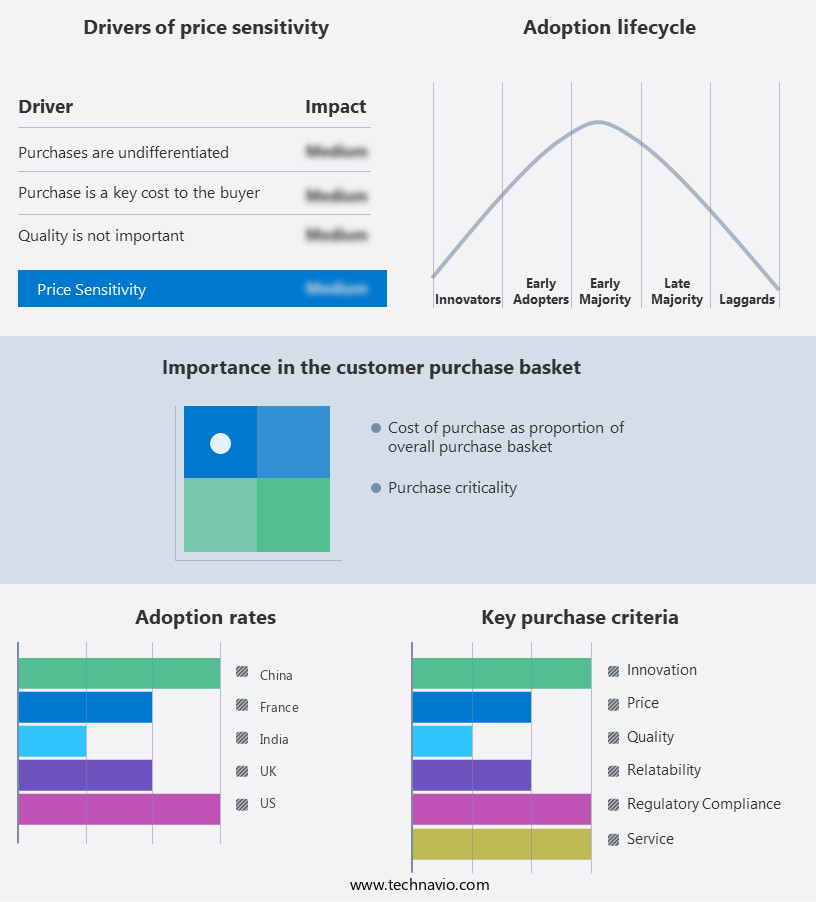
Customer Landscape
Key Companies & Market Insights
Companies are implementing various strategies, such as strategic alliances, frozen and freeze dried pet food market forecast, partnerships, mergers and acquisitions, geographical expansion, and product/service launches, to enhance their presence in the industry.
Bravo LLC - Frozen and freeze-dried pet food preserves nutrients by eliminating water, ensuring optimal nutrition for pets. This innovative approach enhances search engine visibility, delivering a research analyst's perspective on advanced pet food technology.
The industry research and growth report includes detailed analyses of the competitive landscape of the market and information about key companies, including:
- Bravo LLC
- BrightPet Nutrition Group LLC
- CanvasbackPets
- Carnivora
- Carnivore Meat Co. LLC
- Champion Petfoods Holding Inc.
- Doggie Dabbas Pvt Ltd.
- Fresh Is Best
- Grandma Lucys LLC
- MiracleCorp Products
- Natural Pet Food Group
- Natures Diet
- Natures Menu Ltd.
- Northwest Naturals Raw Pet Food
- NRG Plus Ltd.
- Primal Pet Foods Inc.
- RAWZ Natural Pet Food
- Stella and Chewys LLC
- Steves Real Food
- Wisconsin Freeze Dried
Qualitative and quantitative analysis of companies has been conducted to help clients understand the wider business environment as well as the strengths and weaknesses of key industry players. Data is qualitatively analyzed to categorize companies as pure play, category-focused, industry-focused, and diversified; it is quantitatively analyzed to categorize companies as dominant, leading, strong, tentative, and weak.
Recent Development and News in Frozen And Freeze Dried Pet Food Market
- In January 2024, Hill's Pet Nutrition, a leading pet food manufacturer, launched its new freeze-dried pet food line, "Science Diet Dental," in the US market. This expansion aimed to cater to the growing demand for convenient, nutritious, and dental-friendly pet food options (Source: Hill's Pet Nutrition Press Release).
- In March 2024, Nestlé Purina Petcare, a global pet food company, announced a strategic partnership with Bio-Techne Corporation, a biotech firm specializing in protein research and development. The collaboration aimed to explore new opportunities in the production of high-quality, sustainable, and innovative pet food ingredients (Source: Nestlé Purina Petcare Press Release).
- In May 2024, Blue Buffalo, a US pet food company, completed the acquisition of Ainsworth Pet Nutrition, a major Australian pet food manufacturer. This acquisition allowed Blue Buffalo to expand its geographic reach and strengthen its position in the global pet food market (Source: Blue Buffalo Press Release).
- In April 2025, The Pet Food Institute, a US trade association, announced the successful implementation of new labeling regulations for frozen and freeze-dried pet foods. These regulations aimed to provide clearer and more accurate information on pet food labels, enhancing consumer trust and transparency (Source: The Pet Food Institute Press Release).
Research Analyst Overview
- The frozen and freeze-dried pet food market exhibits dynamic trends, with packaging design playing a pivotal role in differentiating brands. Spray drying and air drying are popular dehydration methods, while sustainability initiatives, such as waste reduction and carbon footprint minimization, gain traction. Sensory evaluation and nutrient analysis are crucial in ensuring product quality, with ph meters and moisture meters used extensively in food processing. Automated packaging lines and e-commerce platforms streamline supply chain management, enabling efficient distribution and customer convenience. Ingredient traceability is essential for therapeutic pet food, senior pet food, kitten food, puppy food, and veterinary diets. Sustainable packaging solutions, such as recyclable materials, are increasingly preferred.
- Food processing equipment manufacturers invest in innovation, introducing advanced technology for moisture control, temperature management, and product consistency. Online retailers and traditional pet stores collaborate, expanding market reach and catering to diverse consumer preferences. Shelf-life testing remains vital to maintaining product integrity and customer trust.
Dive into Technavio’s robust research methodology, blending expert interviews, extensive data synthesis, and validated models for unparalleled Frozen And Freeze Dried Pet Food Market insights. See full methodology.
|
Market Scope |
|
|
Report Coverage |
Details |
|
Page number |
211 |
|
Base year |
2024 |
|
Historic period |
2019-2023 |
|
Forecast period |
2025-2029 |
|
Growth momentum & CAGR |
Accelerate at a CAGR of 12.7% |
|
Market growth 2025-2029 |
USD 3432.6 million |
|
Market structure |
Fragmented |
|
YoY growth 2024-2025(%) |
10.3 |
|
Key countries |
US, UK, Canada, Germany, China, Brazil, France, India, Japan, and Australia |
|
Competitive landscape |
Leading Companies, Market Positioning of Companies, Competitive Strategies, and Industry Risks |
What are the Key Data Covered in this Frozen And Freeze Dried Pet Food Market Research and Growth Report?
- CAGR of the Frozen And Freeze Dried Pet Food industry during the forecast period
- Detailed information on factors that will drive the growth and forecasting between 2025 and 2029
- Precise estimation of the size of the market and its contribution of the industry in focus to the parent market
- Accurate predictions about upcoming growth and trends and changes in consumer behaviour
- Growth of the market across North America, Europe, APAC, South America, and Middle East and Africa
- Thorough analysis of the market’s competitive landscape and detailed information about companies
- Comprehensive analysis of factors that will challenge the frozen and freeze dried pet food market growth of industry companies
We can help! Our analysts can customize this frozen and freeze dried pet food market research report to meet your requirements.