Furniture Market Analysis, Size, and Forecast 2026-2030: APAC (China, Japan, and India), Europe (Germany, UK, and France), North America (US, Canada, and Mexico), South America (Brazil and Argentina), Middle East and Africa (Saudi Arabia, UAE, and Turkey), and Rest of World (ROW)

Furniture Market Analysis, Size, and Forecast 2026-2030:
APAC (China, Japan, and India), Europe (Germany, UK, and France), North America (US, Canada, and Mexico), South America (Brazil and Argentina), Middle East and Africa (Saudi Arabia, UAE, and Turkey), and Rest of World (ROW)

Published: May 2026 288 Pages SKU: IRTNTR44836

Market Overview at a Glance

$168.5 B
Market Opportunity
4.7%
CAGR 2025 - 2030
46.1%
APAC Growth
$494.2 B
Home segment 2024

Furniture Market Size 2026-2030

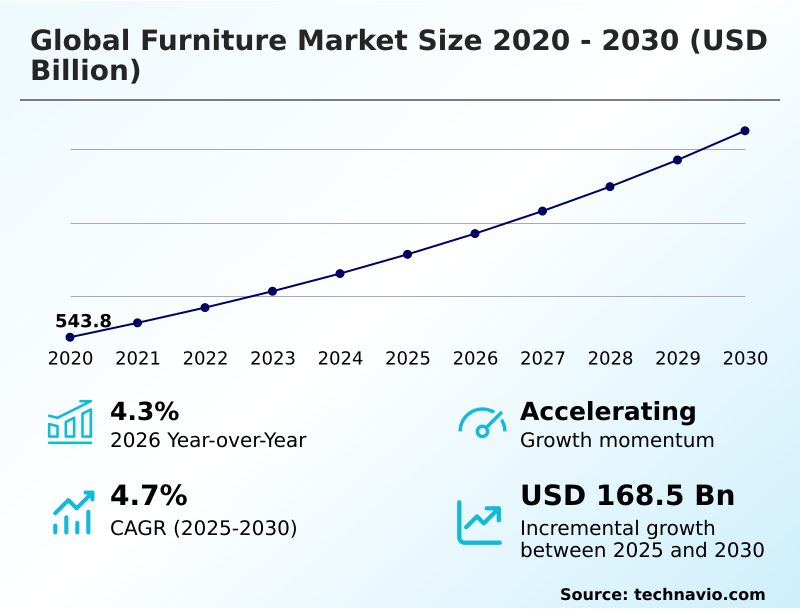
The furniture market size is valued to increase by USD 168.5 billion, at a CAGR of 4.7% from 2025 to 2030. Global urbanization and expansion of real estate sector will drive the furniture market.

Major Market Trends & Insights

  • APAC dominated the market and accounted for a 46.1% growth during the forecast period.
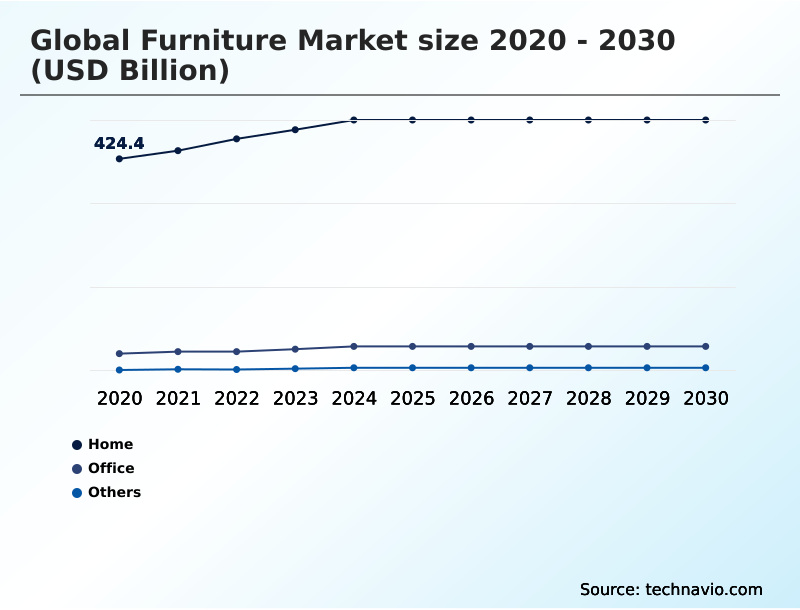
  • By Product - Home segment was valued at USD 494.2 billion in 2024
  • By Distribution Channel - Offline segment accounted for the largest market revenue share in 2024

Market Size & Forecast

  • Market Opportunities: USD 281.5 billion
  • Market Future Opportunities: USD 168.5 billion
  • CAGR from 2025 to 2030 : 4.7%

Market Summary

  • The furniture market is undergoing a significant transformation, moving beyond its traditional role of providing functional items to becoming an integral part of lifestyle expression and smart living environments. This evolution is driven by a confluence of factors, including the global expansion of the real estate sector and the growing aspirational consumer purchasing power of the middle class.
  • Key trends such as the ascendancy of sustainability are compelling a shift toward circular economy models, with a focus on sustainable material sourcing and end-of-life product management. Simultaneously, the integration of technology is creating new product categories, with smart furniture integration becoming a key differentiator.
  • For instance, a commercial real estate developer might partner with a manufacturer to outfit a new smart office building with desks that monitor usage to optimize space, demonstrating a direct link between product innovation and operational efficiency.
  • However, the industry grapples with challenges like intense market fragmentation and supply chain volatility, which exert downward pressure on margins and require sophisticated supply chain risk mitigation strategies and agile on-demand manufacturing capabilities to navigate successfully. The market's future will be defined by how effectively companies balance design innovation with resilient, transparent, and sustainable operations.

What will be the Size of the Furniture Market during the forecast period?

Get Key Insights on Market Forecast (PDF) Get Free Sample

How is the Furniture Market Segmented?

The furniture industry research report provides comprehensive data (region-wise segment analysis), with forecasts and estimates in "USD billion" for the period 2026-2030, as well as historical data from 2020-2024 for the following segments.

  • Product
    • Home
    • Office
    • Others
  • Distribution channel
    • Offline
    • Online
  • Application
    • Commercial
    • Residential
  • Geography
    • APAC
      • China
      • Japan
      • India
    • Europe
      • Germany
      • UK
      • France
    • North America
      • US
      • Canada
      • Mexico
    • South America
      • Brazil
      • Argentina
    • Middle East and Africa
      • Saudi Arabia
      • UAE
      • Turkey
    • Rest of World (ROW)

By Product Insights

The home segment is estimated to witness significant growth during the forecast period.

The home segment is the most substantial portion of the furniture market, driven by a deep-seated home-centric lifestyle shift and significant home renovation market growth.

The widespread adoption of hybrid work model adoption has redefined domestic spaces, fueling demand for products integrating ergonomic design principles. In response to increasing urban density and small-space living solutions, consumers are prioritizing modular furniture systems and clever space-saving mechanisms.

The market has seen a surge in personalization at scale, supported by 3D product modeling and innovations in upholstery fabric technology and composite wood materials.

An effective omnichannel retail strategy is now essential, as consumer journeys blend digital discovery with physical evaluation, with firms leveraging design for disassembly principles seeing a 15% increase in customer loyalty for their sustainable offerings.

Get Free Sample

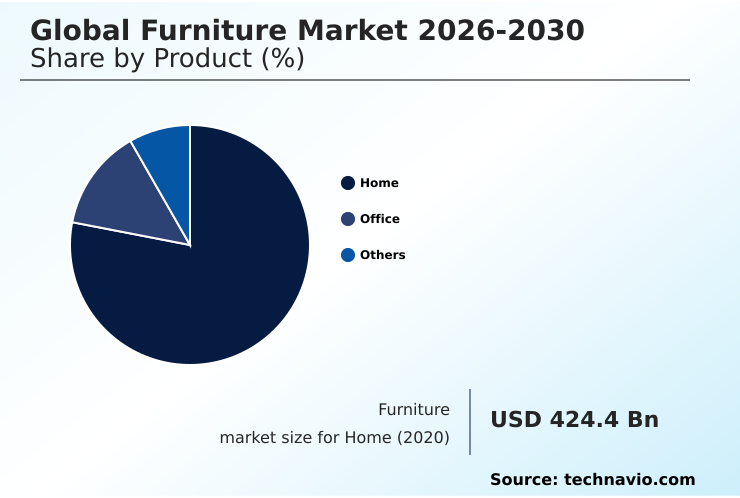
The Home segment was valued at USD 494.2 billion in 2024 and showed a gradual increase during the forecast period.

Get Free Sample

Regional Analysis

APAC is estimated to contribute 46.1% to the growth of the global market during the forecast period.Technavio’s analysts have elaborately explained the regional trends and drivers that shape the market during the forecast period.

See How Furniture Market Demand is Rising in APAC Get Free Sample

The geographic landscape is dominated by APAC, which accounts for 46% of the market's incremental growth, significantly outpacing North America's 19%. This growth is driven by high urban living density and a rapid accelerated replacement cycle.

In these regions, digital brand engagement is paramount, with manufacturers leveraging advanced inventory management systems and product lifecycle management to serve diverse consumer needs. Production hubs are adopting automated robotic assembly and advanced CNC routing technology to scale output.

Meanwhile, in mature markets like Europe, there is a focus on sustainable models, including furniture rental services and subscription-based models, which leverage superior woodworking joinery techniques, metal frame fabrication, and durable powder coating finishing to ensure longevity and support design for disassembly principles.

Market Dynamics

Our researchers analyzed the data with 2025 as the base year, along with the key drivers, trends, and challenges. A holistic analysis of drivers will help companies refine their marketing strategies to gain a competitive advantage.

  • The modern furniture market is increasingly defined by specific consumer needs and technological advancements. The demand for multifunctional furniture for small apartments reflects a global trend towards urban densification, where maximizing space is paramount. Consumers are also more conscious of the materials in their homes, driving interest in sustainable outdoor furniture materials and low-VOC furniture for healthy homes.
  • The widespread shift to remote work has made ergonomic home office chair benefits a critical purchasing factor. Personalization is at the forefront, with consumers seeking out modular sofa configuration options and researching custom wardrobe design and cost.
  • Technology is a key enabler, with augmented reality for furniture shopping helping to bridge the online-offline gap and smart bed sleep tracking technology introducing new wellness functionalities. The industry is also seeing a strategic battle between on-demand manufacturing vs mass production models, with the former supported by the rise of online furniture direct-to-consumer brands.
  • This shift highlights last-mile delivery challenges for furniture but offers greater customization. From a B2B perspective, understanding BIFMA standards for office seating is crucial for commercial sales, just as offering rental furniture services for businesses is becoming a viable alternative to ownership.
  • The debate over a comparison of wood vs composite materials continues, with a growing appreciation for the benefits of FSC certified wood furniture and the creative potential of using reclaimed wood in furniture making.
  • The entire ecosystem is wrestling with the impact of tariffs on furniture prices while simultaneously exploring the role of AI in furniture customization, striving to optimizing furniture supply chain logistics. Ultimately, the principles of the circular economy in furniture design are becoming a core strategic pillar for long-term viability.
  • Firms that master on-demand models have reported up to a 20% reduction in unsold inventory compared to traditional mass-production approaches.

What are the key market drivers leading to the rise in the adoption of Furniture Industry?

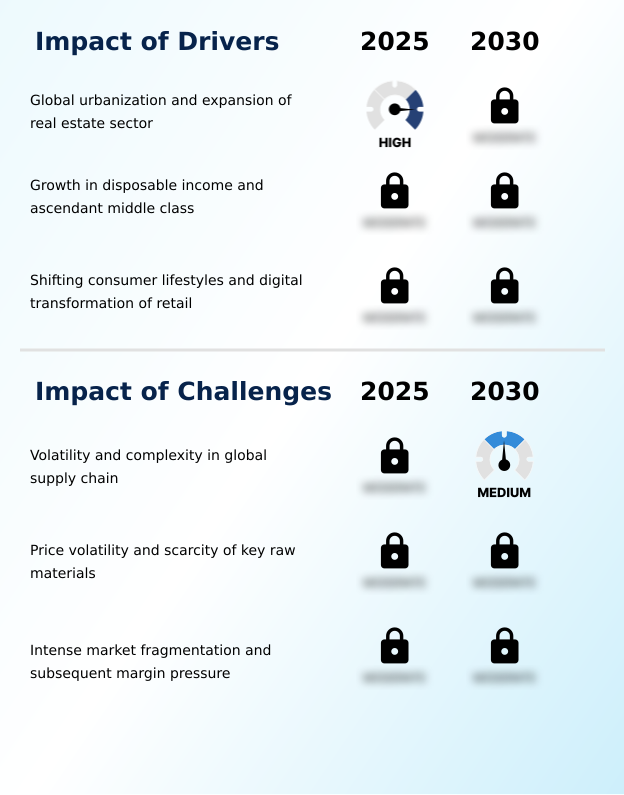
  • A primary catalyst for the market is the trend of global urbanization, which, coupled with the expansion of the real estate sector, creates foundational demand for furniture.

  • Evolving consumer spending patterns and strong interior design influence amplified by social commerce integration are key drivers. The significant e-commerce market penetration, which accounts for over 20% of sales, has normalized digital purchasing behaviors.
  • This shift is supported by technologies like augmented reality visualization, which has been shown to improve conversion rates by up to 40%. Customer co-creation tools are empowering consumers to design their own pieces, fueling on-demand manufacturing and custom furniture configuration.
  • This move toward just-in-time production and efficient direct-to-consumer fulfillment, optimized through flat-pack logistics, allows brands to reduce inventory costs by over 15% while delivering personalized products, merging digital convenience with experiential retail concepts and smart furniture integration.

What are the market trends shaping the Furniture Industry?

  • The ascendancy of sustainability and the adoption of circular economy principles represent a defining trend, fundamentally reshaping the industry's approach to the entire product lifecycle.

  • The ascendancy of circular economy models is reshaping the furniture market, driven by millennial purchasing behavior and gen-z aesthetic preferences that prioritize environmental stewardship. Aspirational consumer purchasing is now tied to ethical production certification and full material traceability.
  • This trend manifests in a demand for products featuring sustainable material sourcing, such as FSC certified timber and innovative reclaimed wood processing techniques. Manufacturers are gaining a competitive edge by adopting low-VOC finishes and non-toxic adhesives, with some achieving a 25% premium on certified eco-friendly lines.
  • Furthermore, an emphasis on end-of-life product management and the use of durable materials like phenolic resin surfaces is extending product lifecycles, reducing waste by over 30% in certain product categories.

What challenges does the Furniture Industry face during its growth?

  • A persistent challenge facing the market is the inherent volatility and complexity of the global supply chain, which exposes participants to significant disruption risks and cost fluctuations.

  • Despite the ongoing real estate sector expansion and a market-wide premiumization trend, the industry faces significant supply chain complexities. B2B procurement processes, particularly for hospitality contract furnishing and products meeting healthcare furniture standards, demand rigorous supply chain transparency and adherence to metrics like BIFMA testing standards for contract-grade durability.
  • However, global disruptions have increased lead times by as much as 50% for some components. Effective supply chain risk mitigation strategies are crucial. The final stage is also a hurdle, with last-mile delivery optimization being a primary focus to manage costs.
  • Firms are leveraging digital merchandising tools and mass customization platforms to improve demand forecasting, but a strong brand narrative development is essential to justify longer waits or higher prices.

Exclusive Technavio Analysis on Customer Landscape

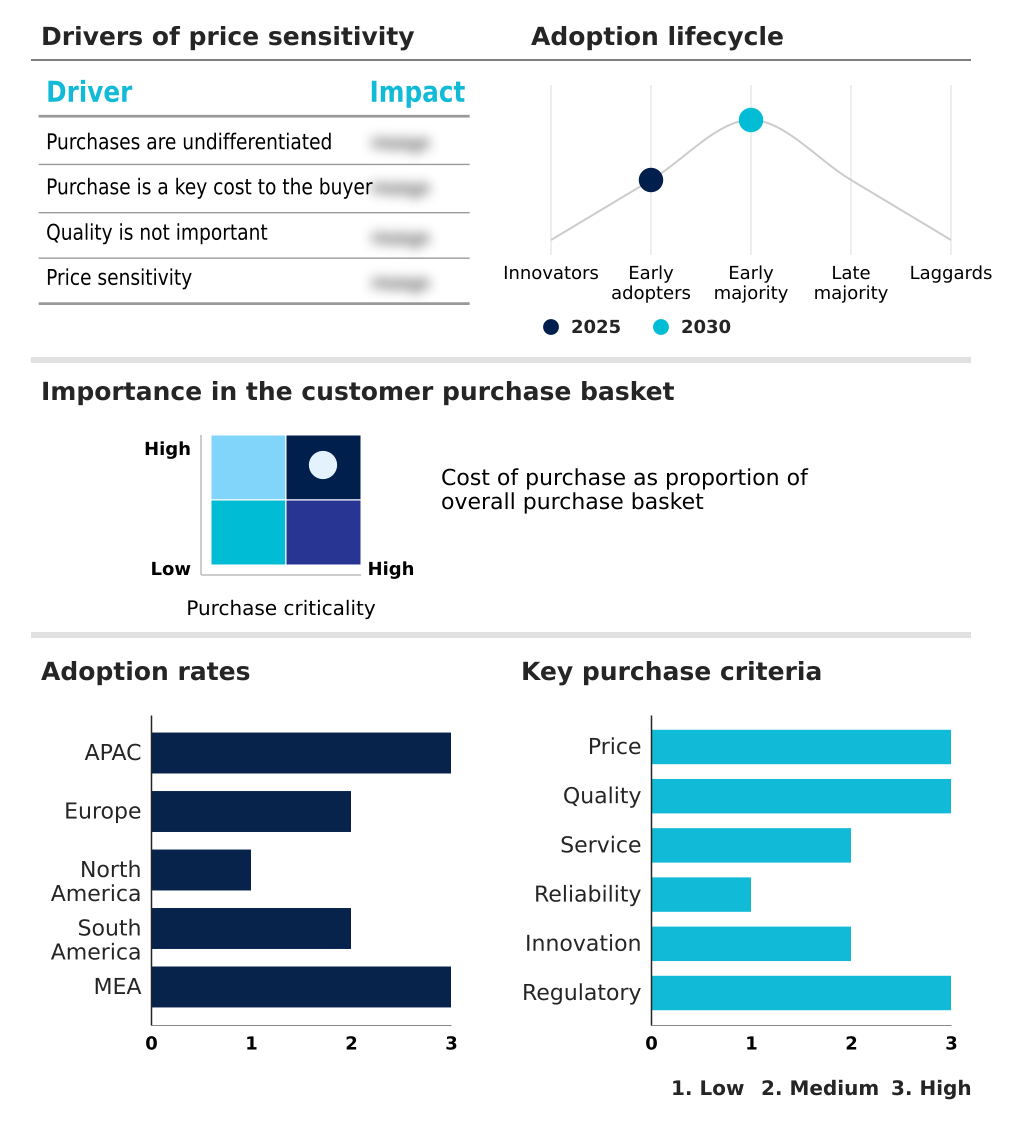
The furniture market forecasting report includes the adoption lifecycle of the market, covering from the innovator’s stage to the laggard’s stage. It focuses on adoption rates in different regions based on penetration. Furthermore, the furniture market report also includes key purchase criteria and drivers of price sensitivity to help companies evaluate and develop their market growth analysis strategies.

Customer Landscape of Furniture Industry

Competitive Landscape

Companies are implementing various strategies, such as strategic alliances, furniture market forecast, partnerships, mergers and acquisitions, geographical expansion, and product/service launches, to enhance their presence in the industry.

Ashley Furniture Industries - Offers a comprehensive portfolio of upholstered and wood furniture products, catering to both residential and commercial contract markets with a focus on contemporary design and quality craftsmanship.

The industry research and growth report includes detailed analyses of the competitive landscape of the market and information about key companies, including:

  • Ashley Furniture Industries
  • Bassett Furniture Industries
  • Bernhardt Furniture Co.
  • Flexsteel Industries Inc.
  • Godrej and Boyce Manufacturing
  • Haworth Inc.
  • HNI Corp.
  • Hooker Furnishings Corp.
  • Inter IKEA Holding BV
  • Kinnarps AB
  • KOKUYO Co. Ltd.
  • LaZBoy Inc.
  • MillerKnoll Inc.
  • Nowy Styl
  • Restoration Hardware Inc.
  • Scavolini S.p.a.
  • Sleep Number Corp.
  • Steelcase Inc.
  • Wayfair Inc.
  • Williams Sonoma Inc.

Qualitative and quantitative analysis of companies has been conducted to help clients understand the wider business environment as well as the strengths and weaknesses of key industry players. Data is qualitatively analyzed to categorize companies as pure play, category-focused, industry-focused, and diversified; it is quantitatively analyzed to categorize companies as dominant, leading, strong, tentative, and weak.

Recent Development and News in Furniture market

  • In October 2024, Steelcase Inc. announced it had achieved a Platinum rating from EcoVadis for its sustainability performance, placing it in the top 1% of companies assessed globally. This milestone was the result of a multi-year strategy focused on decarbonizing its operations, achieving over 95% material circularity in its top product lines, and ensuring full supply chain transparency.
  • In December 2024, Hooker Furnishings Corp. revealed a significant investment to expand its domestic upholstery manufacturing capacity in Virginia and North Carolina. The expansion includes advanced robotics and CNC machinery to enhance production efficiency and reduce lead times for its custom-crafted furniture lines, supporting a broader reshoring trend in the industry.
  • In February 2025, Wayfair Inc. launched a proprietary, AI-driven logistics platform named 'FinalMile AI' to optimize its large-parcel delivery network across North America. The system aims to reduce transit times by 20% and cut delivery-related damages by 30% through predictive routing and intelligent package handling protocols.
  • In May 2025, Williams-Sonoma Inc., through its West Elm brand, introduced a comprehensive furniture take-back and refurbishment program called 'Renew'. The initiative allows customers to trade in used West Elm furniture for store credit, with the items being resold, refurbished, or responsibly recycled, directly supporting the company's circular economy goals.

Dive into Technavio’s robust research methodology, blending expert interviews, extensive data synthesis, and validated models for unparalleled Furniture Market insights. See full methodology.

Market Scope
Page number 288
Base year 2025
Historic period 2020-2024
Forecast period 2026-2030
Growth momentum & CAGR Accelerate at a CAGR of 4.7%
Market growth 2026-2030 USD 168.5 billion
Market structure Fragmented
YoY growth 2025-2026(%) 4.3%
Key countries China, Japan, India, South Korea, Australia, Indonesia, Germany, UK, France, Italy, Spain, The Netherlands, US, Canada, Mexico, Brazil, Argentina, Chile, Saudi Arabia, UAE, Turkey, South Africa and Israel
Competitive landscape Leading Companies, Market Positioning of Companies, Competitive Strategies, and Industry Risks

Request Free Sample

Research Analyst Overview

  • The furniture market's competitive landscape is being reshaped by the convergence of technology and sustainability. Boardroom decisions are increasingly focused on implementing circular economy models and ensuring supply chain transparency, which have become critical for brand reputation.
  • Core to this is sustainable material sourcing using materials like FSC certified timber and reclaimed wood processing, complemented by the use of low-VOC finishes and non-toxic adhesives. On the production floor, on-demand manufacturing and just-in-time production are powered by CNC routing technology and automated robotic assembly.
  • Firms are leveraging mass customization platforms and 3D product modeling to enable custom furniture configuration at scale. This requires robust product lifecycle management and advanced inventory management systems for success. The shift to digital is supported by augmented reality visualization and other digital merchandising tools, which are essential for an effective omnichannel retail strategy.
  • A key challenge remains in direct-to-consumer fulfillment, where last-mile delivery optimization for products designed with flat-pack logistics is crucial. Products must meet high standards for contract-grade durability, often validated by BIFMA testing standards.
  • The integration of smart furniture integration and ergonomic design principles into everything from office chairs to modular furniture systems with space-saving mechanisms reflects a move towards higher-value offerings. This strategic pivot towards technology-driven, sustainable production has enabled leading firms to reduce material waste by 15%, directly impacting bottom-line profitability.

What are the Key Data Covered in this Furniture Market Research and Growth Report?

  • What is the expected growth of the Furniture Market between 2026 and 2030?

    • USD 168.5 billion, at a CAGR of 4.7%

  • What segmentation does the market report cover?

    • The report is segmented by Product (Home, Office, and Others), Distribution Channel (Offline, and Online), Application (Commercial, and Residential) and Geography (APAC, Europe, North America, South America, Middle East and Africa)

  • Which regions are analyzed in the report?

    • APAC, Europe, North America, South America and Middle East and Africa

  • What are the key growth drivers and market challenges?

    • Global urbanization and expansion of real estate sector, Volatility and complexity in global supply chain

  • Who are the major players in the Furniture Market?

    • Ashley Furniture Industries, Bassett Furniture Industries, Bernhardt Furniture Co., Flexsteel Industries Inc., Godrej and Boyce Manufacturing, Haworth Inc., HNI Corp., Hooker Furnishings Corp., Inter IKEA Holding BV, Kinnarps AB, KOKUYO Co. Ltd., LaZBoy Inc., MillerKnoll Inc., Nowy Styl, Restoration Hardware Inc., Scavolini S.p.a., Sleep Number Corp., Steelcase Inc., Wayfair Inc. and Williams Sonoma Inc.

Market Research Insights

  • The furniture market is shaped by dynamic shifts in consumer behavior and retail models. A pronounced home-centric lifestyle shift, accelerated by hybrid work model adoption, has structurally altered demand. This is reflected in the online retail channel's market share, which grew from approximately 15% to over 21% in just four years, demonstrating the power of e-commerce market penetration.
  • This premiumization trend is further driven by rising disposable incomes, enabling aspirational consumer purchasing. Experiential retail concepts are being used to bridge the gap between digital and physical, with stores featuring AR tools improving customer engagement by over 30%.
  • Successful brand narrative development now hinges on sustainability and personalization, catering to new consumer spending patterns and the powerful interior design influence seen across digital platforms.

We can help! Our analysts can customize this furniture market research report to meet your requirements.

Get in touch

1. Executive Summary

1.1 Market overview

Executive Summary - Chart on Market Overview
Executive Summary - Data Table on Market Overview
Executive Summary - Chart on Global Market Characteristics
Executive Summary - Chart on Market by Geography
Executive Summary - Chart on Market Segmentation by Product
Executive Summary - Chart on Market Segmentation by Distribution Channel
Executive Summary - Chart on Market Segmentation by Application
Executive Summary - Chart on Incremental Growth
Executive Summary - Data Table on Incremental Growth
Executive Summary - Chart on Company Market Positioning

2. Technavio Analysis

2.1 Analysis of price sensitivity, lifecycle, customer purchase basket, adoption rates, and purchase criteria

2.2 Criticality of inputs and Factors of differentiation

Chart on Overview on criticality of inputs and factors of differentiation

2.3 Factors of disruption

Chart on Overview on factors of disruption

2.4 Impact of drivers and challenges

Chart on Impact of drivers and challenges in 2025 and 2030

3. Market Landscape

3.1 Market ecosystem

Chart on Parent Market
Data Table on - Parent Market

3.2 Market characteristics

Chart on Market characteristics analysis

3.3 Value chain analysis

Chart on Value chain analysis

4. Market Sizing

4.1 Market definition

Data Table on Offerings of companies included in the market definition

4.2 Market segment analysis

Market segments

4.3 Market size 2025

4.4 Market outlook: Forecast for 2025-2030

Chart on Global - Market size and forecast 2025-2030 ($ billion)
Data Table on Global - Market size and forecast 2025-2030 ($ billion)
Chart on Global Market: Year-over-year growth 2025-2030 (%)
Data Table on Global Market: Year-over-year growth 2025-2030 (%)

5. Historic Market Size

5.1 Global Furniture Market 2020 - 2024

Historic Market Size - Data Table on Global Furniture Market 2020 - 2024 ($ billion)

5.2 Product segment analysis 2020 - 2024

Historic Market Size - Product Segment 2020 - 2024 ($ billion)

5.3 Distribution Channel segment analysis 2020 - 2024

Historic Market Size - Distribution Channel Segment 2020 - 2024 ($ billion)

5.4 Application segment analysis 2020 - 2024

Historic Market Size - Application Segment 2020 - 2024 ($ billion)

5.5 Geography segment analysis 2020 - 2024

Historic Market Size - Geography Segment 2020 - 2024 ($ billion)

5.6 Country segment analysis 2020 - 2024

Historic Market Size - Country Segment 2020 - 2024 ($ billion)

6. Qualitative Analysis

6.1 Impact of AI on global furniture market

6.2 Impact of geopolitical conflicts on global furniture market

7. Five Forces Analysis

7.1 Five forces summary

Five forces analysis - Comparison between 2025 and 2030

7.2 Bargaining power of buyers

Bargaining power of buyers - Impact of key factors 2025 and 2030

7.3 Bargaining power of suppliers

Bargaining power of suppliers - Impact of key factors in 2025 and 2030

7.4 Threat of new entrants

Threat of new entrants - Impact of key factors in 2025 and 2030

7.5 Threat of substitutes

Threat of substitutes - Impact of key factors in 2025 and 2030

7.6 Threat of rivalry

Threat of rivalry - Impact of key factors in 2025 and 2030

7.7 Market condition

Chart on Market condition - Five forces 2025 and 2030

8. Market Segmentation by Product

8.1 Market segments

Chart on Product - Market share 2025-2030 (%)
Data Table on Product - Market share 2025-2030 (%)

8.2 Comparison by Product

Chart on Comparison by Product
Data Table on Comparison by Product

8.3 Home - Market size and forecast 2025-2030

Chart on Home - Market size and forecast 2025-2030 ($ billion)
Data Table on Home - Market size and forecast 2025-2030 ($ billion)
Chart on Home - Year-over-year growth 2025-2030 (%)
Data Table on Home - Year-over-year growth 2025-2030 (%)

8.4 Office - Market size and forecast 2025-2030

Chart on Office - Market size and forecast 2025-2030 ($ billion)
Data Table on Office - Market size and forecast 2025-2030 ($ billion)
Chart on Office - Year-over-year growth 2025-2030 (%)
Data Table on Office - Year-over-year growth 2025-2030 (%)

8.5 Others - Market size and forecast 2025-2030

Chart on Others - Market size and forecast 2025-2030 ($ billion)
Data Table on Others - Market size and forecast 2025-2030 ($ billion)
Chart on Others - Year-over-year growth 2025-2030 (%)
Data Table on Others - Year-over-year growth 2025-2030 (%)

8.6 Market opportunity by Product

Market opportunity by Product ($ billion)
Data Table on Market opportunity by Product ($ billion)

9. Market Segmentation by Distribution Channel

9.1 Market segments

Chart on Distribution Channel - Market share 2025-2030 (%)
Data Table on Distribution Channel - Market share 2025-2030 (%)

9.2 Comparison by Distribution Channel

Chart on Comparison by Distribution Channel
Data Table on Comparison by Distribution Channel

9.3 Offline - Market size and forecast 2025-2030

Chart on Offline - Market size and forecast 2025-2030 ($ billion)
Data Table on Offline - Market size and forecast 2025-2030 ($ billion)
Chart on Offline - Year-over-year growth 2025-2030 (%)
Data Table on Offline - Year-over-year growth 2025-2030 (%)

9.4 Online - Market size and forecast 2025-2030

Chart on Online - Market size and forecast 2025-2030 ($ billion)
Data Table on Online - Market size and forecast 2025-2030 ($ billion)
Chart on Online - Year-over-year growth 2025-2030 (%)
Data Table on Online - Year-over-year growth 2025-2030 (%)

9.5 Market opportunity by Distribution Channel

Market opportunity by Distribution Channel ($ billion)
Data Table on Market opportunity by Distribution Channel ($ billion)

10. Market Segmentation by Application

10.1 Market segments

Chart on Application - Market share 2025-2030 (%)
Data Table on Application - Market share 2025-2030 (%)

10.2 Comparison by Application

Chart on Comparison by Application
Data Table on Comparison by Application

10.3 Commercial - Market size and forecast 2025-2030

Chart on Commercial - Market size and forecast 2025-2030 ($ billion)
Data Table on Commercial - Market size and forecast 2025-2030 ($ billion)
Chart on Commercial - Year-over-year growth 2025-2030 (%)
Data Table on Commercial - Year-over-year growth 2025-2030 (%)

10.4 Residential - Market size and forecast 2025-2030

Chart on Residential - Market size and forecast 2025-2030 ($ billion)
Data Table on Residential - Market size and forecast 2025-2030 ($ billion)
Chart on Residential - Year-over-year growth 2025-2030 (%)
Data Table on Residential - Year-over-year growth 2025-2030 (%)

10.5 Market opportunity by Application

Market opportunity by Application ($ billion)
Data Table on Market opportunity by Application ($ billion)

11. Customer Landscape

11.1 Customer landscape overview

Analysis of price sensitivity, lifecycle, customer purchase basket, adoption rates, and purchase criteria

12. Geographic Landscape

12.1 Geographic segmentation

Chart on Market share by geography 2025-2030 (%)
Data Table on Market share by geography 2025-2030 (%)

12.2 Geographic comparison

Chart on Geographic comparison
Data Table on Geographic comparison

12.3 APAC - Market size and forecast 2025-2030

Chart on APAC - Market size and forecast 2025-2030 ($ billion)
Data Table on APAC - Market size and forecast 2025-2030 ($ billion)
Chart on APAC - Year-over-year growth 2025-2030 (%)
Data Table on APAC - Year-over-year growth 2025-2030 (%)
Chart on Regional Comparison - APAC
Data Table on Regional Comparison - APAC

12.3.1 China - Market size and forecast 2025-2030

Chart on China - Market size and forecast 2025-2030 ($ billion)
Data Table on China - Market size and forecast 2025-2030 ($ billion)
Chart on China - Year-over-year growth 2025-2030 (%)
Data Table on China - Year-over-year growth 2025-2030 (%)

12.3.2 Japan - Market size and forecast 2025-2030

Chart on Japan - Market size and forecast 2025-2030 ($ billion)
Data Table on Japan - Market size and forecast 2025-2030 ($ billion)
Chart on Japan - Year-over-year growth 2025-2030 (%)
Data Table on Japan - Year-over-year growth 2025-2030 (%)

12.3.3 India - Market size and forecast 2025-2030

Chart on India - Market size and forecast 2025-2030 ($ billion)
Data Table on India - Market size and forecast 2025-2030 ($ billion)
Chart on India - Year-over-year growth 2025-2030 (%)
Data Table on India - Year-over-year growth 2025-2030 (%)

12.3.4 South Korea - Market size and forecast 2025-2030

Chart on South Korea - Market size and forecast 2025-2030 ($ billion)
Data Table on South Korea - Market size and forecast 2025-2030 ($ billion)
Chart on South Korea - Year-over-year growth 2025-2030 (%)
Data Table on South Korea - Year-over-year growth 2025-2030 (%)

12.3.5 Australia - Market size and forecast 2025-2030

Chart on Australia - Market size and forecast 2025-2030 ($ billion)
Data Table on Australia - Market size and forecast 2025-2030 ($ billion)
Chart on Australia - Year-over-year growth 2025-2030 (%)
Data Table on Australia - Year-over-year growth 2025-2030 (%)

12.3.6 Indonesia - Market size and forecast 2025-2030

Chart on Indonesia - Market size and forecast 2025-2030 ($ billion)
Data Table on Indonesia - Market size and forecast 2025-2030 ($ billion)
Chart on Indonesia - Year-over-year growth 2025-2030 (%)
Data Table on Indonesia - Year-over-year growth 2025-2030 (%)

12.4 Europe - Market size and forecast 2025-2030

Chart on Europe - Market size and forecast 2025-2030 ($ billion)
Data Table on Europe - Market size and forecast 2025-2030 ($ billion)
Chart on Europe - Year-over-year growth 2025-2030 (%)
Data Table on Europe - Year-over-year growth 2025-2030 (%)
Chart on Regional Comparison - Europe
Data Table on Regional Comparison - Europe

12.4.1 Germany - Market size and forecast 2025-2030

Chart on Germany - Market size and forecast 2025-2030 ($ billion)
Data Table on Germany - Market size and forecast 2025-2030 ($ billion)
Chart on Germany - Year-over-year growth 2025-2030 (%)
Data Table on Germany - Year-over-year growth 2025-2030 (%)

12.4.2 UK - Market size and forecast 2025-2030

Chart on UK - Market size and forecast 2025-2030 ($ billion)
Data Table on UK - Market size and forecast 2025-2030 ($ billion)
Chart on UK - Year-over-year growth 2025-2030 (%)
Data Table on UK - Year-over-year growth 2025-2030 (%)

12.4.3 France - Market size and forecast 2025-2030

Chart on France - Market size and forecast 2025-2030 ($ billion)
Data Table on France - Market size and forecast 2025-2030 ($ billion)
Chart on France - Year-over-year growth 2025-2030 (%)
Data Table on France - Year-over-year growth 2025-2030 (%)

12.4.4 Italy - Market size and forecast 2025-2030

Chart on Italy - Market size and forecast 2025-2030 ($ billion)
Data Table on Italy - Market size and forecast 2025-2030 ($ billion)
Chart on Italy - Year-over-year growth 2025-2030 (%)
Data Table on Italy - Year-over-year growth 2025-2030 (%)

12.4.5 Spain - Market size and forecast 2025-2030

Chart on Spain - Market size and forecast 2025-2030 ($ billion)
Data Table on Spain - Market size and forecast 2025-2030 ($ billion)
Chart on Spain - Year-over-year growth 2025-2030 (%)
Data Table on Spain - Year-over-year growth 2025-2030 (%)

12.4.6 The Netherlands - Market size and forecast 2025-2030

Chart on The Netherlands - Market size and forecast 2025-2030 ($ billion)
Data Table on The Netherlands - Market size and forecast 2025-2030 ($ billion)
Chart on The Netherlands - Year-over-year growth 2025-2030 (%)
Data Table on The Netherlands - Year-over-year growth 2025-2030 (%)

12.5 North America - Market size and forecast 2025-2030

Chart on North America - Market size and forecast 2025-2030 ($ billion)
Data Table on North America - Market size and forecast 2025-2030 ($ billion)
Chart on North America - Year-over-year growth 2025-2030 (%)
Data Table on North America - Year-over-year growth 2025-2030 (%)
Chart on Regional Comparison - North America
Data Table on Regional Comparison - North America

12.5.1 US - Market size and forecast 2025-2030

Chart on US - Market size and forecast 2025-2030 ($ billion)
Data Table on US - Market size and forecast 2025-2030 ($ billion)
Chart on US - Year-over-year growth 2025-2030 (%)
Data Table on US - Year-over-year growth 2025-2030 (%)

12.5.2 Canada - Market size and forecast 2025-2030

Chart on Canada - Market size and forecast 2025-2030 ($ billion)
Data Table on Canada - Market size and forecast 2025-2030 ($ billion)
Chart on Canada - Year-over-year growth 2025-2030 (%)
Data Table on Canada - Year-over-year growth 2025-2030 (%)

12.5.3 Mexico - Market size and forecast 2025-2030

Chart on Mexico - Market size and forecast 2025-2030 ($ billion)
Data Table on Mexico - Market size and forecast 2025-2030 ($ billion)
Chart on Mexico - Year-over-year growth 2025-2030 (%)
Data Table on Mexico - Year-over-year growth 2025-2030 (%)

12.6 South America - Market size and forecast 2025-2030

Chart on South America - Market size and forecast 2025-2030 ($ billion)
Data Table on South America - Market size and forecast 2025-2030 ($ billion)
Chart on South America - Year-over-year growth 2025-2030 (%)
Data Table on South America - Year-over-year growth 2025-2030 (%)
Chart on Regional Comparison - South America
Data Table on Regional Comparison - South America

12.6.1 Brazil - Market size and forecast 2025-2030

Chart on Brazil - Market size and forecast 2025-2030 ($ billion)
Data Table on Brazil - Market size and forecast 2025-2030 ($ billion)
Chart on Brazil - Year-over-year growth 2025-2030 (%)
Data Table on Brazil - Year-over-year growth 2025-2030 (%)

12.6.2 Argentina - Market size and forecast 2025-2030

Chart on Argentina - Market size and forecast 2025-2030 ($ billion)
Data Table on Argentina - Market size and forecast 2025-2030 ($ billion)
Chart on Argentina - Year-over-year growth 2025-2030 (%)
Data Table on Argentina - Year-over-year growth 2025-2030 (%)

12.6.3 Chile - Market size and forecast 2025-2030

Chart on Chile - Market size and forecast 2025-2030 ($ billion)
Data Table on Chile - Market size and forecast 2025-2030 ($ billion)
Chart on Chile - Year-over-year growth 2025-2030 (%)
Data Table on Chile - Year-over-year growth 2025-2030 (%)

12.7 Middle East and Africa - Market size and forecast 2025-2030

Chart on Middle East and Africa - Market size and forecast 2025-2030 ($ billion)
Data Table on Middle East and Africa - Market size and forecast 2025-2030 ($ billion)
Chart on Middle East and Africa - Year-over-year growth 2025-2030 (%)
Data Table on Middle East and Africa - Year-over-year growth 2025-2030 (%)
Chart on Regional Comparison - Middle East and Africa
Data Table on Regional Comparison - Middle East and Africa

12.7.1 Saudi Arabia - Market size and forecast 2025-2030

Chart on Saudi Arabia - Market size and forecast 2025-2030 ($ billion)
Data Table on Saudi Arabia - Market size and forecast 2025-2030 ($ billion)
Chart on Saudi Arabia - Year-over-year growth 2025-2030 (%)
Data Table on Saudi Arabia - Year-over-year growth 2025-2030 (%)

12.7.2 UAE - Market size and forecast 2025-2030

Chart on UAE - Market size and forecast 2025-2030 ($ billion)
Data Table on UAE - Market size and forecast 2025-2030 ($ billion)
Chart on UAE - Year-over-year growth 2025-2030 (%)
Data Table on UAE - Year-over-year growth 2025-2030 (%)

12.7.3 Turkey - Market size and forecast 2025-2030

Chart on Turkey - Market size and forecast 2025-2030 ($ billion)
Data Table on Turkey - Market size and forecast 2025-2030 ($ billion)
Chart on Turkey - Year-over-year growth 2025-2030 (%)
Data Table on Turkey - Year-over-year growth 2025-2030 (%)

12.7.4 South Africa - Market size and forecast 2025-2030

Chart on South Africa - Market size and forecast 2025-2030 ($ billion)
Data Table on South Africa - Market size and forecast 2025-2030 ($ billion)
Chart on South Africa - Year-over-year growth 2025-2030 (%)
Data Table on South Africa - Year-over-year growth 2025-2030 (%)

12.7.5 Israel - Market size and forecast 2025-2030

Chart on Israel - Market size and forecast 2025-2030 ($ billion)
Data Table on Israel - Market size and forecast 2025-2030 ($ billion)
Chart on Israel - Year-over-year growth 2025-2030 (%)
Data Table on Israel - Year-over-year growth 2025-2030 (%)

12.8 Market opportunity by geography

Market opportunity by geography ($ billion)
Data Tables on Market opportunity by geography ($ billion)

13. Drivers, Challenges, and Opportunity

13.1 Market drivers

Global urbanization and expansion of real estate sector
Growth in disposable income and ascendant middle class
Shifting consumer lifestyles and digital transformation of retail

13.2 Market challenges

Volatility and complexity in global supply chain
Price volatility and scarcity of key raw materials
Intense market fragmentation and subsequent margin pressure

13.3 Impact of drivers and challenges

Impact of drivers and challenges in 2025 and 2030

13.4 Market opportunities

Ascendancy of sustainability and circular economy principles
Integration of smart technology and enhanced functionality
Hyper-personalization and on-demand manufacturing

14. Competitive Landscape

14.1 Overview

14.2

Overview on criticality of inputs and factors of differentiation

14.3 Landscape disruption

Overview on factors of disruption

14.4 Industry risks

Impact of key risks on business

15. Competitive Analysis

15.1 Companies profiled

Companies covered

15.2 Company ranking index

15.3 Market positioning of companies

Matrix on companies position and classification

15.4 Ashley Furniture Industries

Ashley Furniture Industries - Overview
Ashley Furniture Industries - Product / Service
Ashley Furniture Industries - Key offerings
SWOT

15.5 Bassett Furniture Industries

Bassett Furniture Industries - Overview
Bassett Furniture Industries - Business segments
Bassett Furniture Industries - Key offerings
Bassett Furniture Industries - Segment focus
SWOT

15.6 Bernhardt Furniture Co.

Bernhardt Furniture Co. - Overview
Bernhardt Furniture Co. - Product / Service
Bernhardt Furniture Co. - Key offerings
SWOT

15.7 Flexsteel Industries Inc.

Flexsteel Industries Inc. - Overview
Flexsteel Industries Inc. - Product / Service
Flexsteel Industries Inc. - Key offerings
SWOT

15.8 Godrej and Boyce Manufacturing

Godrej and Boyce Manufacturing - Overview
Godrej and Boyce Manufacturing - Product / Service
Godrej and Boyce Manufacturing - Key offerings
SWOT

15.9 Haworth Inc.

Haworth Inc. - Overview
Haworth Inc. - Product / Service
Haworth Inc. - Key offerings
SWOT

15.10 HNI Corp.

HNI Corp. - Overview
HNI Corp. - Business segments
HNI Corp. - Key offerings
HNI Corp. - Segment focus
SWOT

15.11 Hooker Furnishings Corp.

Hooker Furnishings Corp. - Overview
Hooker Furnishings Corp. - Business segments
Hooker Furnishings Corp. - Key offerings
Hooker Furnishings Corp. - Segment focus
SWOT

15.12 Inter IKEA Holding BV

Inter IKEA Holding BV - Overview
Inter IKEA Holding BV - Product / Service
Inter IKEA Holding BV - Key offerings
SWOT

15.13 Kinnarps AB

Kinnarps AB - Overview
Kinnarps AB - Product / Service
Kinnarps AB - Key offerings
SWOT

15.14 KOKUYO Co. Ltd.

KOKUYO Co. Ltd. - Overview
KOKUYO Co. Ltd. - Business segments
KOKUYO Co. Ltd. - Key offerings
KOKUYO Co. Ltd. - Segment focus
SWOT

15.15 LaZBoy Inc.

LaZBoy Inc. - Overview
LaZBoy Inc. - Business segments
LaZBoy Inc. - Key offerings
LaZBoy Inc. - Segment focus
SWOT

15.16 Restoration Hardware Inc.

Restoration Hardware Inc. - Overview
Restoration Hardware Inc. - Product / Service
Restoration Hardware Inc. - Key offerings
SWOT

15.17 Wayfair Inc.

Wayfair Inc. - Overview
Wayfair Inc. - Business segments
Wayfair Inc. - Key offerings
Wayfair Inc. - Segment focus
SWOT

15.18 Williams Sonoma Inc.

Williams Sonoma Inc. - Overview
Williams Sonoma Inc. - Product / Service
Williams Sonoma Inc. - Key offerings
SWOT

16. Appendix

16.1 Scope of the report

Market definition
Objectives
Notes and caveats

16.2 Inclusions and exclusions checklist

Inclusions checklist
Exclusions checklist

16.3 Currency conversion rates for US$

16.4 Research methodology

16.5 Data procurement

Information sources

16.6 Data validation

16.7 Validation techniques employed for market sizing

16.8 Data synthesis

16.9 360 degree market analysis

16.10 List of abbreviations

Research Methodology

Technavio presents a detailed picture of the market by way of study, synthesis, and summation of data from multiple sources. The analysts have presented the various facets of the market with a particular focus on identifying the key industry influencers. The data thus presented is comprehensive, reliable, and the result of extensive research, both primary and secondary.

INFORMATION SOURCES

Primary sources

  • Manufacturers and suppliers
  • Channel partners
  • Industry experts
  • Strategic decision makers

Secondary sources

  • Industry journals and periodicals
  • Government data
  • Financial reports of key industry players
  • Historical data
  • Press releases

DATA ANALYSIS

Data Synthesis

  • Collation of data
  • Estimation of key figures
  • Analysis of derived insights

Data Validation

  • Triangulation with data models
  • Reference against proprietary databases
  • Corroboration with industry experts

REPORT WRITING

Qualitative

  • Market drivers
  • Market challenges
  • Market trends
  • Five forces analysis

Quantitative

  • Market size and forecast
  • Market segmentation
  • Geographical insights
  • Competitive landscape

Interested in this report?

Get your sample now to see our research methodology and insights!

Download Now

Frequently Asked Questions

Furniture market growth will increase by USD 168.5 billion during 2026-2030.

The Furniture market is expected to grow at a CAGR of 4.7% during 2026-2030.

Furniture market is segmented by Product (Home, Office, Others) Distribution channel (Offline, Online) Application (Commercial, Residential)

Ashley Furniture Industries, Bassett Furniture Industries, Bernhardt Furniture Co., Flexsteel Industries Inc., Godrej and Boyce Manufacturing, Haworth Inc., HNI Corp., Hooker Furnishings Corp., Inter IKEA Holding BV, Kinnarps AB, KOKUYO Co. Ltd., LaZBoy Inc., MillerKnoll Inc., Nowy Styl, Restoration Hardware Inc., Scavolini S.p.a., Sleep Number Corp., Steelcase Inc., Wayfair Inc., Williams Sonoma Inc. are a few of the key vendors in the Furniture market.

APAC will register the highest growth rate of 46.1% among the other regions. Therefore, the Furniture market in APAC is expected to garner significant business opportunities for the vendors during the forecast period.

China, Japan, India, South Korea, Australia, Indonesia, Germany, UK, France, Italy, Spain, The Netherlands, US, Canada, Mexico, Brazil, Argentina, Chile, Saudi Arabia, UAE, Turkey, South Africa, Israel

  • Global urbanization and expansion of real estate sector is the driving factor this market.

The Furniture market vendors should focus on grabbing business opportunities from the Product segment as it accounted for the largest market share in the base year.
RIA - Research AI Assistant
Ask RIA