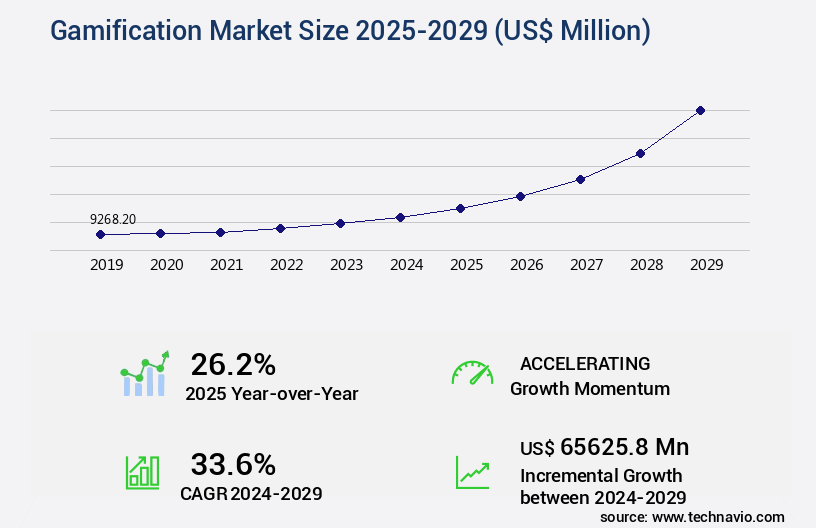
Gamification Market Size 2025-2029
The gamification market size is valued to increase by USD 65.63 billion, at a CAGR of 33.6% from 2024 to 2029. Increasing adoption of gamification in e-learning will drive the gamification market.
Major Market Trends & Insights
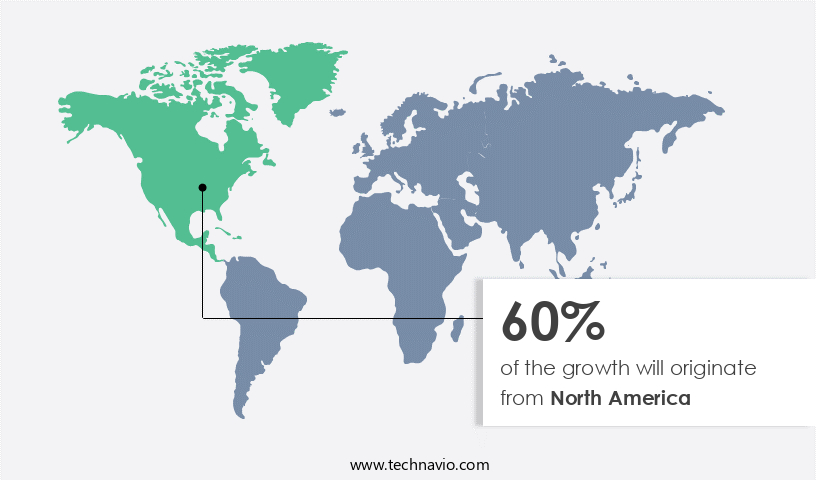
- North America dominated the market and accounted for a 60% growth during the forecast period.
- By End-user - Healthcare segment was valued at USD 2.29 billion in 2023
- By Application - Consumer-driven application segment accounted for the largest market revenue share in 2023
Market Size & Forecast
- Market Opportunities: USD 825.87 million
- Market Future Opportunities: USD 65625.80 million
- CAGR from 2024 to 2029 : 33.6%
Market Summary
- The market represents a dynamic and continually evolving landscape, driven by the increasing adoption of gamification in various industries. According to recent studies, the e-learning sector accounts for over 30% of the market share, leveraging game mechanics to enhance user engagement and learning effectiveness. However, the market faces challenges such as the lack of awareness and inconsistency in implementing gamification strategies. To address these hurdles, key players are forging strategic alliances, with market leaders like Microsoft, Google, and IBM collaborating to expand their offerings and strengthen their market presence.
- Despite these challenges, the market continues to unfold, offering significant opportunities for growth and innovation in core technologies, such as artificial intelligence and virtual reality, and applications, including healthcare, finance, and marketing.
What will be the Size of the Gamification Market during the forecast period?
Get Key Insights on Market Forecast (PDF) Request Free Sample
How is the Gamification Market Segmented ?
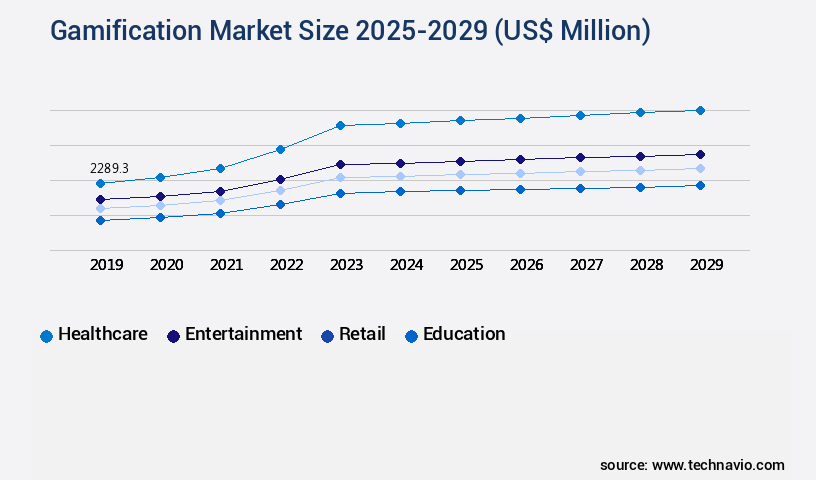
The gamification industry research report provides comprehensive data (region-wise segment analysis), with forecasts and estimates in "USD million" for the period 2025-2029, as well as historical data from 2019-2023 for the following segments.
- End-user
- Healthcare
- Entertainment
- Retail
- Education
- Others
- Application
- Consumer-driven application
- Enterprise-driven application
- Sector
- SMEs
- Large enterprises
- Geography
- North America
- US
- Canada
- Europe
- France
- Germany
- Italy
- UK
- APAC
- China
- India
- Japan
- South Korea
- Rest of World (ROW)
- North America
By End-user Insights
The healthcare segment is estimated to witness significant growth during the forecast period.
The market is experiencing significant growth in various sectors, particularly in digital healthcare. According to recent studies, the adoption of gamification techniques in healthcare has increased by 17%, with an estimated 20% of healthcare applications integrating these elements. This trend is driven by the shift towards value-based care, which prioritizes disease prevention over cure. Gamification in healthcare can effectively engage users in managing conditions such as diabetes and cardiovascular diseases. In the digital healthcare segment, gamification fosters a sense of community by enabling users to share their progress and achievements with others. It also optimizes engagement through user interface design, narrative storytelling, and incentive structures.
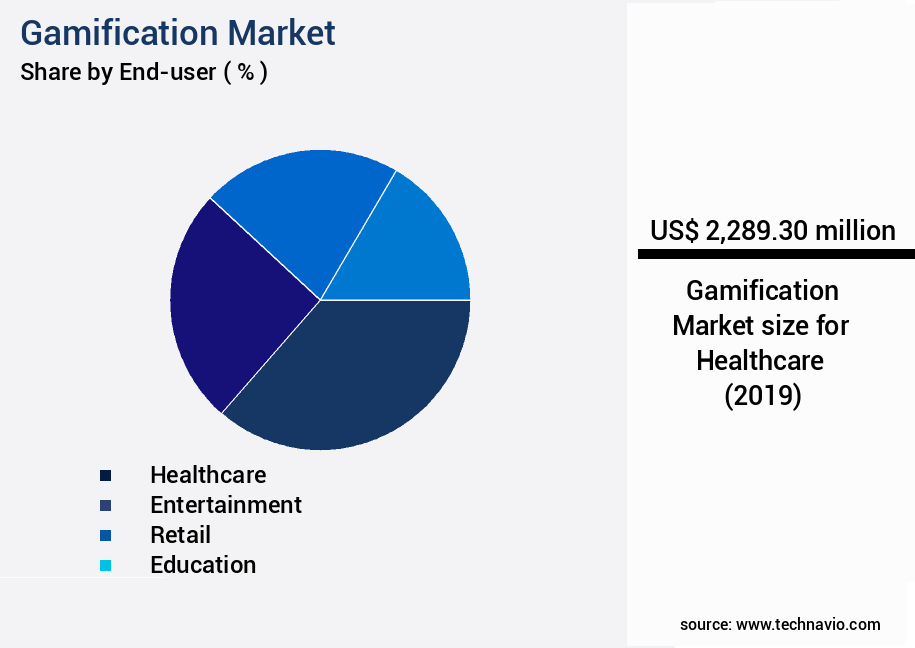
The Healthcare segment was valued at USD 2.29 billion in 2019 and showed a gradual increase during the forecast period.
Personalization strategies, player segmentation, and reward scheduling further enhance the user experience. Behavioral analytics, data visualization, and point system design contribute to continuous improvement and optimization. Moreover, gamification mechanics such as leaderboard implementation, feedback loops, in-app notifications, and progress tracking systems create a dynamic and interactive user experience. Behavior modeling and community building foster healthy competition and social features. A/B testing, achievement unlocks, and player retention strategies ensure long-term engagement. The market is projected to expand further, with an anticipated 25% increase in industry growth. This growth is attributed to the ongoing development of innovative gamification techniques and their successful implementation across various sectors.
The integration of gamification in education, finance, and marketing sectors is expected to significantly contribute to market expansion.
Regional Analysis
North America is estimated to contribute 60% to the growth of the global market during the forecast period. Technavio's analysts have elaborately explained the regional trends and drivers that shape the market during the forecast period.
See How Gamification Market Demand is Rising in North America Request Free Sample
In North America, the market holds a significant share due to advanced technological adoption. High internet and smartphone penetration, coupled with a well-established communication network infrastructure, fuel the regional market growth. The proliferation of mobile computing devices and enhanced internet connectivity have led to increased gamification usage in educational settings, particularly through e-learning and online platforms. Additionally, the integration of gamification solutions with social networking platforms expands their reach and effectiveness by enabling users to share experiences with their networks.
This interconnectedness enhances user engagement and fosters a competitive environment, ultimately driving the market forward.
Market Dynamics
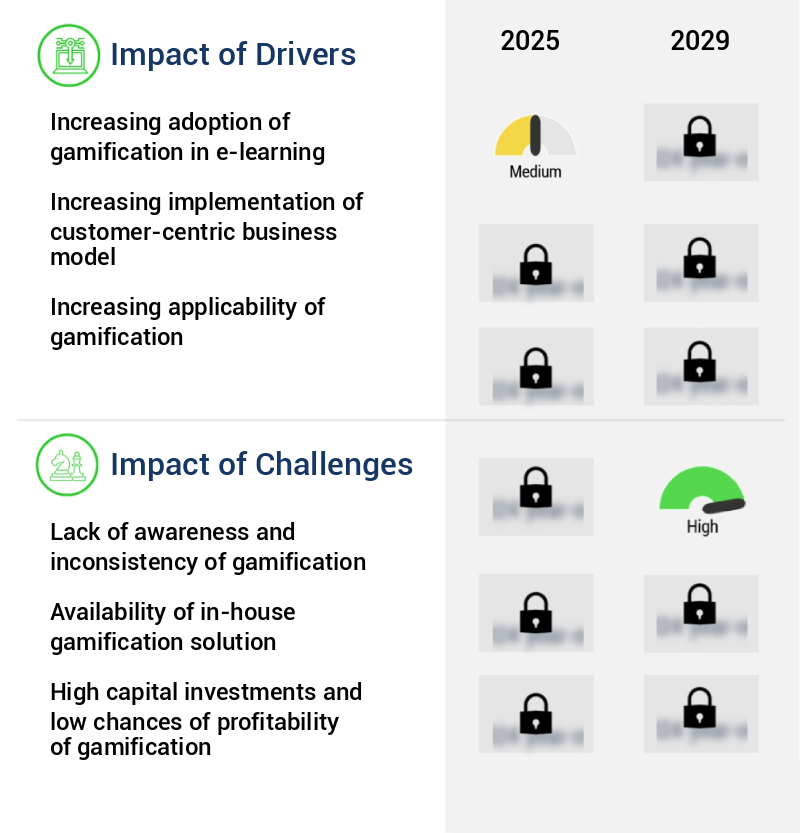
Our researchers analyzed the data with 2024 as the base year, along with the key drivers, trends, and challenges. A holistic analysis of drivers will help companies refine their marketing strategies to gain a competitive advantage.
The market is experiencing significant growth as businesses increasingly recognize the value of effective reward system design in enhancing player engagement and retention. Measuring player engagement metrics is crucial for optimizing in-app notification strategies and implementing leaderboard features that foster healthy competition among players. Designing compelling game challenges and improving retention strategies are essential to keep players engaged and motivated. Leveraging A/B testing for game optimization and using behavioral analytics for personalized experiences are key strategies to create dynamic content for player engagement. Building a strong player community and analyzing player progression curves help businesses understand player motivation and behavior, enabling them to implement strategies for improving completion rates.
Social features and effective feedback loop mechanisms in game design are essential for increasing engagement and achieving optimal game balance and difficulty. Creating a smooth player onboarding flow and implementing different reward tier systems further enhance the player experience. According to market information, more than 70% of gamification implementations focus on improving player engagement and retention, with a significant minority dedicating resources to optimizing completion rates. This shift towards engagement-driven gamification is a testament to the growing recognition of its business value. Using data visualization for performance tracking and creating a personalized user experience are essential for maintaining player interest and ensuring long-term engagement.
The market is expected to see continued growth as businesses increasingly recognize the potential of this innovative approach to engage customers and employees alike.
What are the key market drivers leading to the rise in the adoption of Gamification Industry?
- The significant rise in the implementation of gamification techniques in e-learning is the primary factor fueling market growth.
- E-learning, the digital means of accessing educational content over the Internet, is transforming traditional learning methods. This shift to online platforms significantly boosts employee productivity by enabling flexible access to training materials. E-learning platforms facilitate effective learner engagement through gamification techniques, which incorporate goal-oriented structures and reward systems. Organizations reap substantial cost savings through e-learning. By eliminating travel and accommodation expenses for instructors and the repetition costs for courses, companies can significantly reduce operational expenditures.
- The e-learning market's continuous evolution reflects its increasing adoption across various sectors, with gamification being a key trend. This data-driven narrative underscores the potential for e-learning to increase organizational efficiency and profitability.
What are the market trends shaping the Gamification Industry?
- In The market, the upward trend involves forming strategic alliances.
- The market witnesses ongoing strategic alliances among market participants to expand their reach and enhance their offerings. Mergers and acquisitions, partnerships, and collaborations are common strategies adopted by companies to strengthen their presence and broaden their product portfolios. These alliances lead to the creation of advanced gamification solutions, contributing to the market's growth. The increasing adoption of gamification techniques across various sectors, including healthcare, education, and marketing, fuels the market's expansion.
- Companies recognize the potential of gamification in enhancing user engagement and driving productivity, leading to a continuous influx of investments and innovations in the market.
What challenges does the Gamification Industry face during its growth?
- The lack of consistent awareness and implementation of gamification principles poses a significant challenge to the industry's growth trajectory.
- Gamification, a strategic approach to engage and motivate users through game mechanics, is increasingly adopted across various sectors. However, some Small and Medium Enterprises (SMEs) hesitate due to the perceived cost. Despite the potential benefits, such as increased employee engagement and productivity, the implementation of gamification requires careful planning and execution. The inconsistent results from third-party designed training programs are a concern for many enterprises. This inconsistency stems from the lack of awareness and understanding of effective gamification implementation. Consequently, the probability of failure in these initiatives is high. SMEs, with limited IT budgets, often prioritize other areas over gamification.
- However, the continuous evolution of gamification technologies and their applications in various industries underscore their potential value. For instance, in the healthcare sector, gamification is used to encourage patients to adhere to treatment plans. In education, it enhances student engagement and learning. In sales, it motivates sales teams to meet targets. Gamification's adaptability across sectors underscores its significance. By understanding its potential benefits and effective implementation strategies, SMEs can make informed decisions and harness its power to drive business growth.
Exclusive Technavio Analysis on Customer Landscape
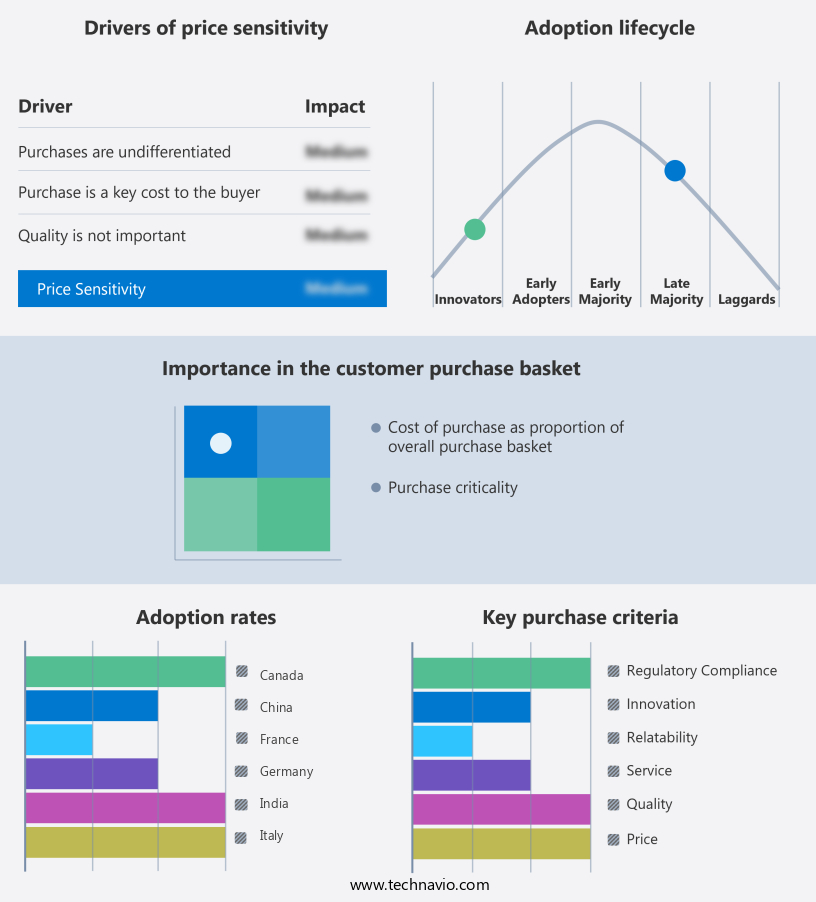
The gamification market forecasting report includes the adoption lifecycle of the market, covering from the innovator's stage to the laggard's stage. It focuses on adoption rates in different regions based on penetration. Furthermore, the gamification market report also includes key purchase criteria and drivers of price sensitivity to help companies evaluate and develop their market growth analysis strategies.
Customer Landscape of Gamification Industry
Competitive Landscape
Companies are implementing various strategies, such as strategic alliances, gamification market forecast, partnerships, mergers and acquisitions, geographical expansion, and product/service launches, to enhance their presence in the industry.
Allen Interactions Inc. - This company specializes in implementing gamification techniques, leveraging game elements and contexts to optimize learning outcomes.
The industry research and growth report includes detailed analyses of the competitive landscape of the market and information about key companies, including:
- Allen Interactions Inc.
- Ambition
- Aon plc
- Axonify Inc.
- BI WORLDWIDE
- Cognizant Technology Solutions Corp.
- Designing Digitally Inc.
- Gamification Ltd.
- Houghton Mifflin Harcourt Co.
- ImmersionOne Inc.
- Influitive Corp.
- Learning Technologies Group Plc
- LevelEleven Inc.
- Microsoft Corp.
- MPS Ltd.
- MRCC Group
- Paradigm Learning Inc.
- PUG Interactive Inc.
- Raydiant Inc.
- SAP SE
Qualitative and quantitative analysis of companies has been conducted to help clients understand the wider business environment as well as the strengths and weaknesses of key industry players. Data is qualitatively analyzed to categorize companies as pure play, category-focused, industry-focused, and diversified; it is quantitatively analyzed to categorize companies as dominant, leading, strong, tentative, and weak.
Recent Development and News in Gamification Market
- In January 2024, Microsoft announced the integration of gamification elements into their Dynamics 365 Customer Engagement platform, aiming to boost user engagement and productivity (Microsoft Press Release). In March 2024, Starbucks partnered with LevelUp Systems to introduce a gamified mobile rewards program, allowing customers to earn points and unlock rewards through various interactions (Starbucks Press Release).
- In April 2024, SAP SE acquired CallidusCloud, a leading gamification and sales performance management solutions provider, for approximately USD 3 billion, expanding their portfolio and enhancing their customer experience offerings (Reuters). In May 2025, IBM Watson announced the launch of its new Gamification as a Service, enabling businesses to create personalized gamified experiences for their customers, with the aim to drive customer loyalty and engagement (IBM Press Release).
- These developments highlight the growing importance of gamification in enhancing customer engagement, productivity, and loyalty across various industries, as evidenced by strategic partnerships, acquisitions, and new product launches.
Dive into Technavio's robust research methodology, blending expert interviews, extensive data synthesis, and validated models for unparalleled Gamification Market insights. See full methodology.
|
Market Scope |
|
|
Report Coverage |
Details |
|
Page number |
221 |
|
Base year |
2024 |
|
Historic period |
2019-2023 |
|
Forecast period |
2025-2029 |
|
Growth momentum & CAGR |
Accelerate at a CAGR of 33.6% |
|
Market growth 2025-2029 |
USD 65625.8 million |
|
Market structure |
Fragmented |
|
YoY growth 2024-2025(%) |
26.2 |
|
Key countries |
US, Canada, Germany, China, Japan, UK, France, India, Italy, and South Korea |
|
Competitive landscape |
Leading Companies, Market Positioning of Companies, Competitive Strategies, and Industry Risks |
Research Analyst Overview
- The market continues to evolve, with virtual currency systems playing a pivotal role in driving engagement. Leaderboard implementation, a key feature, fosters healthy competition among players. Feedback loops, in-app notifications, and UI design enhance user experience, while narrative design and incentive structures optimize engagement. Personalization strategies, player segmentation, and reward scheduling cater to individual preferences, boosting retention. Behavior modeling and data visualization provide valuable insights into player behavior, enabling effective player profiling. Reward mechanisms, point system design, and progression curves further incentivize participation. Behavioral analytics and community building foster a sense of belonging, contributing to a thriving ecosystem.
- A/B testing, achievement unlocks, and completion rates are essential metrics for measuring success. Game mechanics, level design, challenge creation, and dynamic content keep players engaged and coming back for more. Competition mechanics and social features add an extra layer of excitement, creating a vibrant and interactive environment. The market's continuous unfolding is marked by the integration of advanced technologies, such as AI and machine learning, into gamification strategies. These innovations further enhance user experience and engagement, setting the stage for future developments.
What are the Key Data Covered in this Gamification Market Research and Growth Report?
-
What is the expected growth of the Gamification Market between 2025 and 2029?
-
USD 65.63 billion, at a CAGR of 33.6%
-
-
What segmentation does the market report cover?
-
The report segmented by End-user (Healthcare, Entertainment, Retail, Education, and Others), Application (Consumer-driven application and Enterprise-driven application), Sector (SMEs and Large enterprises), and Geography (North America, Europe, APAC, South America, and Middle East and Africa)
-
-
Which regions are analyzed in the report?
-
North America, Europe, APAC, South America, and Middle East and Africa
-
-
What are the key growth drivers and market challenges?
-
Increasing adoption of gamification in e-learning, Lack of awareness and inconsistency of gamification
-
-
Who are the major players in the Gamification Market?
-
Key Companies Allen Interactions Inc., Ambition, Aon plc, Axonify Inc., BI WORLDWIDE, Cognizant Technology Solutions Corp., Designing Digitally Inc., Gamification Ltd., Houghton Mifflin Harcourt Co., ImmersionOne Inc., Influitive Corp., Learning Technologies Group Plc, LevelEleven Inc., Microsoft Corp., MPS Ltd., MRCC Group, Paradigm Learning Inc., PUG Interactive Inc., Raydiant Inc., and SAP SE
-
Market Research Insights
- The market continues to evolve, with an estimated 60% of Fortune 500 companies integrating gamification into their business strategies by 2022. This trend reflects the growing importance of user engagement and monetization in the digital age. According to industry data, the average engagement lifecycle of gamified applications is 31% longer than non-gamified counterparts, leading to increased win probability and conversion rates. Effective gamification strategies employ reward distribution, player behavior analysis, and difficulty scaling to optimize the engagement funnel. Onboarding flows, retention strategies, and user feedback analysis are crucial components of iterative development.
- Player motivation, content calendar, and player journey mapping are essential elements of data-driven design. KPI dashboards, churn prediction, and notification optimization contribute to game balance and user segmentation. Reward tiers and performance indicators facilitate effective feature prioritization and user experience improvement.
We can help! Our analysts can customize this gamification market research report to meet your requirements.
 RIA -
RIA - 
