
Geofencing Market Size 2026-2030
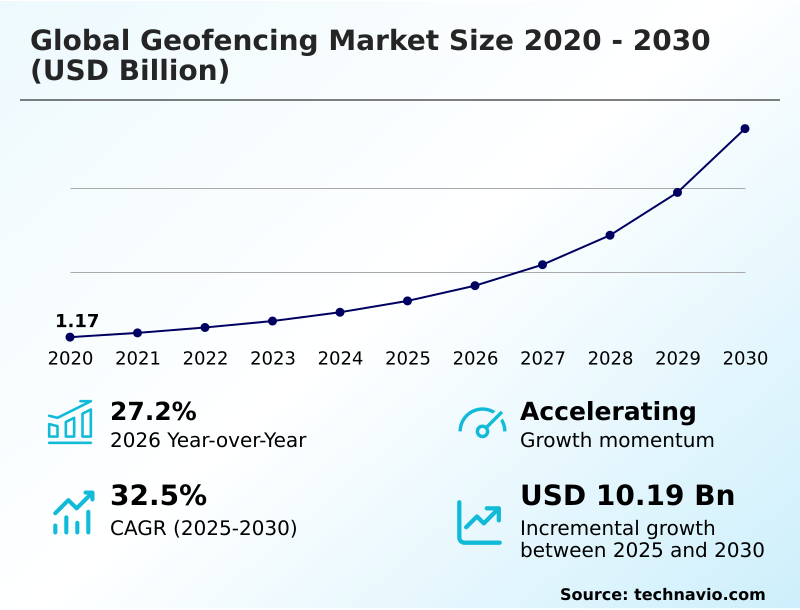
The geofencing market size is valued to increase by USD 10.19 billion, at a CAGR of 32.5% from 2025 to 2030. Increase in location-based marketing will drive the geofencing market.
Major Market Trends & Insights
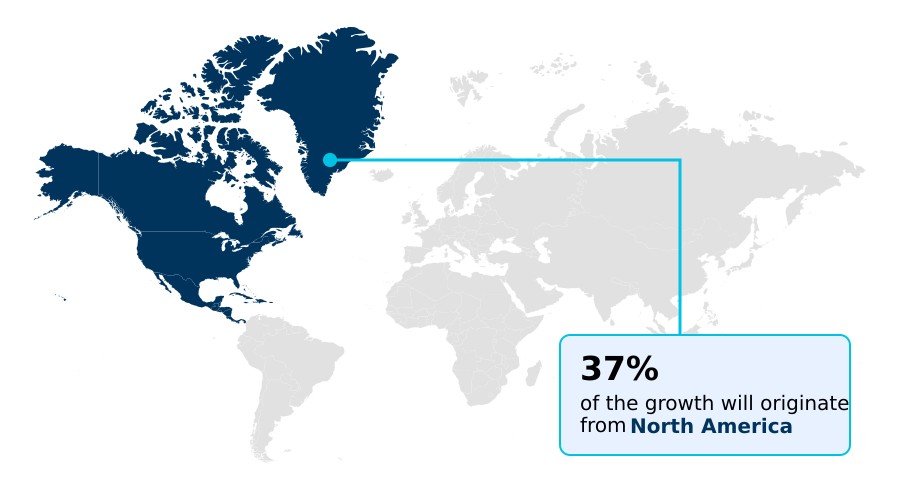
- North America dominated the market and accounted for a 37% growth during the forecast period.
- By Product - Fixed segment was valued at USD 2.03 billion in 2024
- By Component - Services segment accounted for the largest market revenue share in 2024
Market Size & Forecast
- Market Opportunities: USD 12.33 billion
- Market Future Opportunities: USD 10.19 billion
- CAGR from 2025 to 2030 : 32.5%
Market Summary
- The geofencing market is defined by its expanding role in transforming digital-to-physical interactions across numerous industries. At its core, the technology enables the creation of a virtual boundary around a real-world geographic area, triggering pre-programmed actions when a device enters or exits.
- This capability is pivotal for location-based marketing, where retailers can deliver targeted promotions to consumers' mobile devices, driving foot traffic and enhancing engagement. Beyond retail, its applications in logistics are critical for operational efficiency; for instance, a freight company can establish geofences around distribution centers to automate arrival and departure logs, significantly reducing manual errors and optimizing supply chain visibility.
- The market is also driven by the increasing demand for advanced asset tracking solutions and indoor navigation systems within large venues like airports and hospitals. However, the adoption of these sophisticated systems is tempered by challenges related to user data privacy and the substantial capital investment required for high-precision hardware and software integration.
- As the technology matures, the focus is shifting toward AI-driven analytics to unlock deeper insights from location data, balancing functionality with stringent regulatory compliance and security protocols to maintain consumer trust.
What will be the Size of the Geofencing Market during the forecast period?
Get Key Insights on Market Forecast (PDF) Get Free Sample
How is the Geofencing Market Segmented?
The geofencing industry research report provides comprehensive data (region-wise segment analysis), with forecasts and estimates in "USD million" for the period 2026-2030, as well as historical data from 2020-2024 for the following segments.
- Product
- Fixed
- Mobile
- Component
- Services
- Solutions
- Technology
- GPS-based geofencing
- RFID-based geofencing
- Wi-Fi-based geofencing
- Bluetooth low energy
- Cellular network-based geofencing
- Geography
- North America
- US
- Canada
- Mexico
- Europe
- Germany
- UK
- France
- APAC
- China
- Japan
- India
- Middle East and Africa
- Saudi Arabia
- UAE
- Turkey
- South America
- Brazil
- Argentina
- Rest of World (ROW)
- North America
By Product Insights
The fixed segment is estimated to witness significant growth during the forecast period.
The fixed segment is foundational to the geofencing market, revolving around static virtual boundary creation for specific physical locations like retail stores and corporate offices.
This application of location-based marketing is crucial for driving foot traffic, with some retailers reporting a 15% increase in store visits by using location-based notifications for contextual communication. These systems deliver hyper-personalized user experiences through a mobile engagement platform.
Utilizing location-aware features and effective location-based advertising, businesses can convert proximity into engagement, transforming their proximity marketing strategies. By creating a geofence for retail environments, companies enhance customer interaction and loyalty.
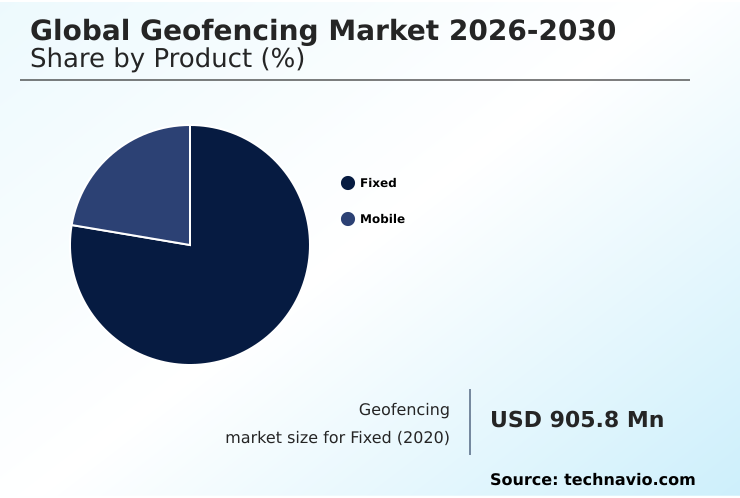
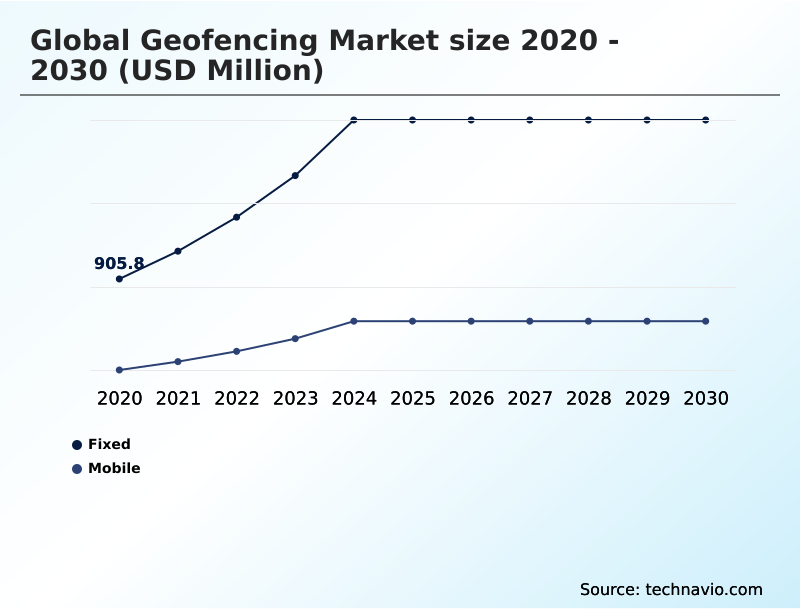
The Fixed segment was valued at USD 2.03 billion in 2024 and showed a gradual increase during the forecast period.
Regional Analysis
North America is estimated to contribute 37% to the growth of the global market during the forecast period.Technavio’s analysts have elaborately explained the regional trends and drivers that shape the market during the forecast period.
See How Geofencing Market Demand is Rising in North America Get Free Sample
The geographic landscape of the geofencing market is led by North America, which accounts for 37% of the market's incremental growth, driven by high adoption in retail and logistics.
The region’s mature infrastructure supports advanced applications like GPS-based geofencing for fleet management and proximity-based triggers for marketing, which are critical for customer engagement solutions.
Meanwhile, APAC is emerging as the fastest-growing region, with a growth rate of 32.9%, fueled by the rapid expansion of smart city projects and mobile commerce.
In this region, there is a strong focus on spatial data processing and the use of cellular network-based geofencing for public safety alerts.
Other technologies like RFID-based geofencing are crucial for industrial applications, and unique use cases like wander management systems for healthcare are gaining traction globally, showcasing the diverse applications shaping the market.
Market Dynamics
Our researchers analyzed the data with 2025 as the base year, along with the key drivers, trends, and challenges. A holistic analysis of drivers will help companies refine their marketing strategies to gain a competitive advantage.
- Strategic deployment within the geofencing market is increasingly focused on specialized, high-value use cases that generate a clear return on investment. For example, geoconquesting tactics for local marketing are becoming standard practice for brands aiming to capture market share from nearby competitors.
- In logistics, real-time asset tracking in supply chains is no longer a luxury but a necessity for maintaining operational integrity, with geofencing for fleet management security being a critical component.
- The technical nuances are also vital; enterprises are carefully evaluating bluetooth beacon accuracy for indoor marketing to deliver hyper-targeted offers, with some platforms achieving sub-meter precision, a significant improvement over older technologies. This precision extends to industrial settings, with RFID geofencing for warehouse inventory management and geofencing for construction site safety monitoring reducing errors and accidents.
- Furthermore, the ease of geofencing API integration for mobile apps is democratizing access to this technology, allowing for innovative applications such as wander management systems for patient safety and geofencing for public safety emergency alerts. As regulatory scrutiny grows, ensuring privacy compliance in location data collection is paramount.
- Businesses are using geofencing analytics for customer dwell time and analyzing customer pathing with geofencing data to optimize layouts and services, while others use it for creating dynamic geofences for mobile assets and workforce attendance automation.
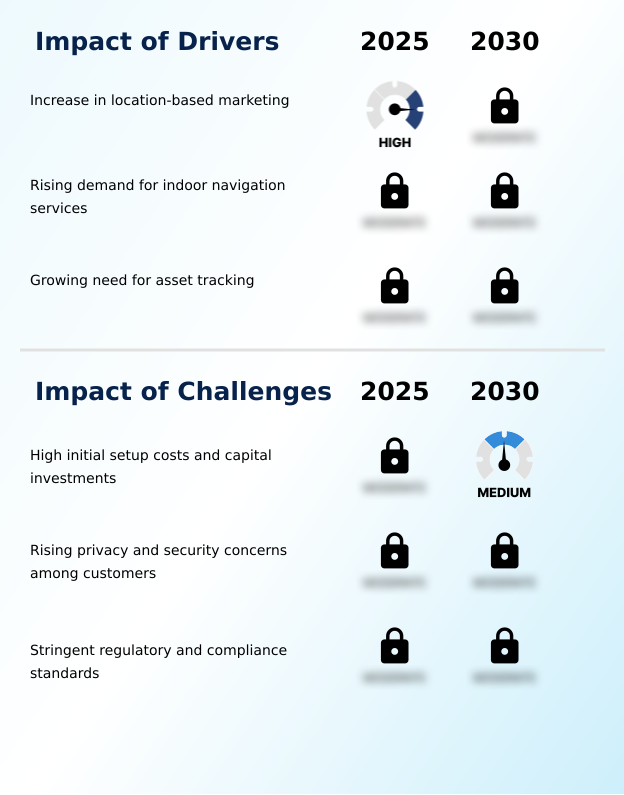
What are the key market drivers leading to the rise in the adoption of Geofencing Industry?
- The increase in location-based marketing is a key driver for the market's growth.
- Key drivers for the geofencing market are rooted in the pursuit of operational excellence and enhanced asset visibility.
- The demand for real-time location tracking is paramount in logistics, where fleet management geofencing and asset tracking solutions are critical operational efficiency tools.
- The integration of these systems has enabled some logistics firms to reduce asset loss by up to 30% through automated alerts.
- In large venues, indoor navigation systems are improving visitor experiences and operational workflows, with some airports seeing a 20% reduction in passenger transit times to gates.
- Similarly, the growth of connected vehicle services is expanding the use of geofencing for logistics, ensuring supply chain visibility. This reliance on mobile device tracking for monitoring personnel and assets underscores the technology's integral role in modern enterprise management.
What are the market trends shaping the Geofencing Industry?
- The market is characterized by the expanding applications of geofencing technology. Its use cases are diversifying beyond traditional sectors into healthcare, agriculture, and public safety.
- The geofencing market is increasingly shaped by the widespread availability of advanced geofencing APIs and SDKs, which has democratized access to location-based technology. This trend fuels the integration of proximity sensing technology into a diverse range of mobile applications, enabling sophisticated user behavior analytics and hyper-local targeting.
- Organizations are leveraging this to build powerful location intelligence platforms for smart city infrastructure, with some cities reporting an 18% improvement in public transit efficiency. The use of geospatial analytics transforms raw location data into actionable insights, improving real-time data processing capabilities.
- For instance, retail analytics platforms have demonstrated a 22% increase in customer dwell time analysis accuracy, directly impacting store layout and product placement strategies.
What challenges does the Geofencing Industry face during its growth?
- High initial setup costs and significant capital investments present a key challenge affecting industry growth.
- The primary challenges in the geofencing market revolve around navigating data privacy regulations and managing the complexities of implementation. Growing concerns over location data privacy have made privacy-by-design principles a necessity, not an option. Adhering to a stringent location tracking protocol is crucial to avoid significant regulatory fines, which have impacted companies failing to secure explicit user consent.
- On the hardware front, the deployment of bluetooth low energy beacons and wi-fi-based geofencing for precise indoor tracking requires significant capital and specialized expertise for site security monitoring and creating virtual perimeter security.
- Some enterprises have reported that the total cost of ownership for such systems is 40% higher than initial software-only estimates, presenting a notable barrier for workforce management applications and broader adoption.
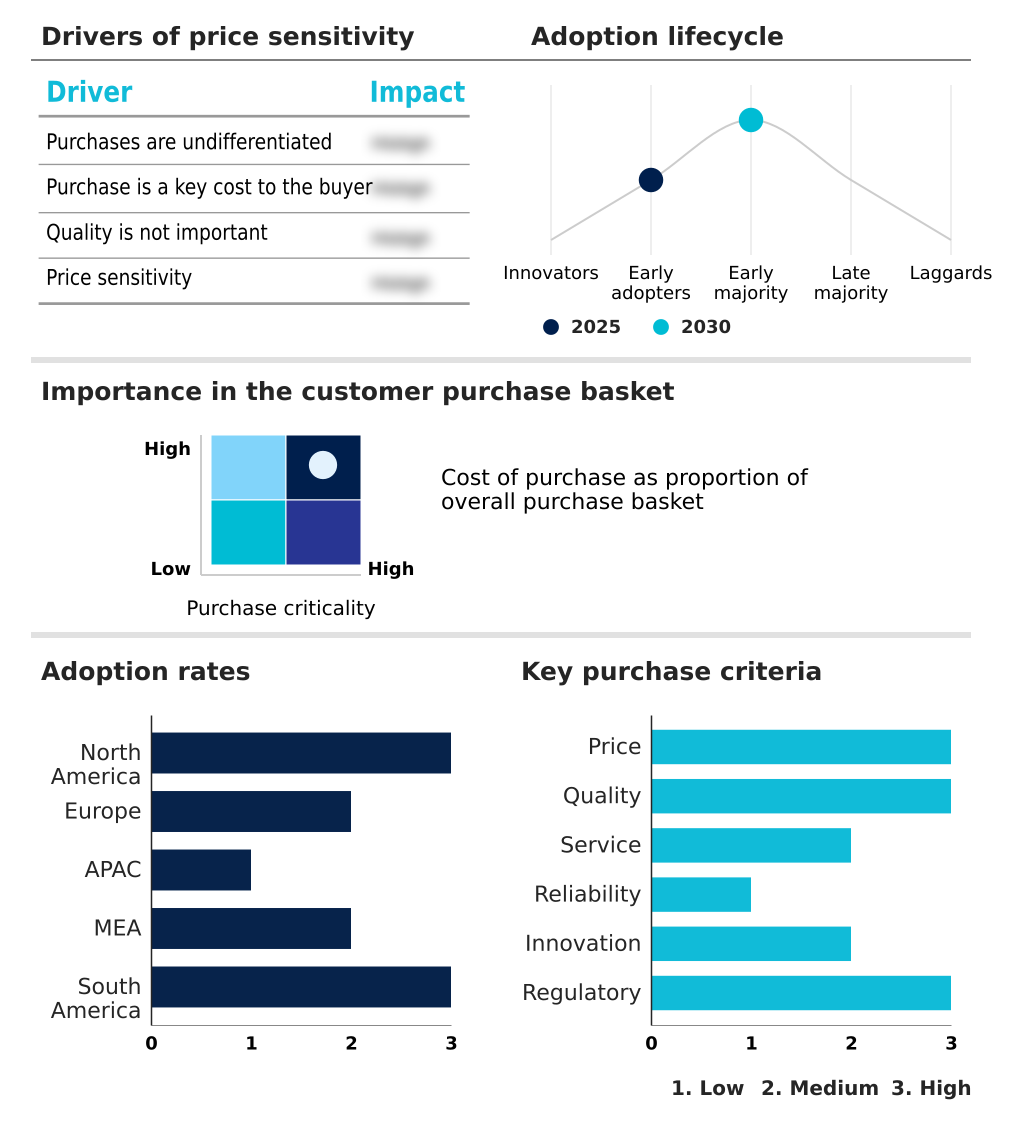
Exclusive Technavio Analysis on Customer Landscape
The geofencing market forecasting report includes the adoption lifecycle of the market, covering from the innovator’s stage to the laggard’s stage. It focuses on adoption rates in different regions based on penetration. Furthermore, the geofencing market report also includes key purchase criteria and drivers of price sensitivity to help companies evaluate and develop their market growth analysis strategies.
Customer Landscape of Geofencing Industry
Competitive Landscape
Companies are implementing various strategies, such as strategic alliances, geofencing market forecast, partnerships, mergers and acquisitions, geographical expansion, and product/service launches, to enhance their presence in the industry.
Apple Inc. - Offerings are centered on delivering precision location intelligence through scalable platforms, enabling contextual engagement, asset management, and advanced geospatial analytics for diverse enterprise applications.
The industry research and growth report includes detailed analyses of the competitive landscape of the market and information about key companies, including:
- Apple Inc.
- Bluedot Industries Pty Ltd.
- Embitel Technologies Pvt. Ltd.
- Esri Inc.
- GeoMoby Pty Ltd.
- Geotab Inc.
- Google LLC
- GroundTruth
- Infillion
- LocationSmart
- Mapcite
- Plot Projects
- Pulsate Mobile Ltd.
- Radar Labs Inc.
- Saksoft Ltd.
- Samsara Inc.
- Simpli.fi Holdings Inc.
- ThumbVista
- Verizon Communications Inc.
Qualitative and quantitative analysis of companies has been conducted to help clients understand the wider business environment as well as the strengths and weaknesses of key industry players. Data is qualitatively analyzed to categorize companies as pure play, category-focused, industry-focused, and diversified; it is quantitatively analyzed to categorize companies as dominant, leading, strong, tentative, and weak.
Recent Development and News in Geofencing market
- In September, 2024, CloudSphere Inc. released an advanced suite of geofencing APIs, enabling developers to integrate low-latency virtual perimeters into mobile applications for enhanced location-aware services.
- In January, 2025, OmniRetail Alliance announced that several of its members delayed smart-store rollouts due to a 20% rise in beacon hardware costs, highlighting capital investment challenges.
- In March, 2025, the European Data Protection Board fined AdTarget Corp. for inadequate disclosures on using geofencing triggers, reinforcing the need for explicit user consent in location tracking.
- In May, 2025, AeroNav Solutions completed a full deployment of its indoor geofencing system at a major Asian international airport, providing travelers with real-time, personalized flight and gate notifications.
Dive into Technavio’s robust research methodology, blending expert interviews, extensive data synthesis, and validated models for unparalleled Geofencing Market insights. See full methodology.
| Market Scope | |
|---|---|
| Page number | 296 |
| Base year | 2025 |
| Historic period | 2020-2024 |
| Forecast period | 2026-2030 |
| Growth momentum & CAGR | Accelerate at a CAGR of 32.5% |
| Market growth 2026-2030 | USD 10186.7 million |
| Market structure | Fragmented |
| YoY growth 2025-2026(%) | 27.2% |
| Key countries | US, Canada, Mexico, Germany, UK, France, Italy, Spain, The Netherlands, China, Japan, India, South Korea, Australia, Indonesia, Saudi Arabia, UAE, Turkey, South Africa, Israel, Brazil, Argentina and Chile |
| Competitive landscape | Leading Companies, Market Positioning of Companies, Competitive Strategies, and Industry Risks |
Research Analyst Overview
- The geofencing market is evolving from a niche marketing tool into a critical enterprise infrastructure component, driven by its capacity to provide actionable location intelligence. The technology’s core, built on creating a virtual boundary, is now enhanced with sophisticated location data analytics and geospatial analytics.
- This enables a wide array of applications, from asset tracking solutions and indoor navigation systems to highly targeted proximity marketing. The proliferation of geofencing APIs and SDKs has lowered entry barriers, fostering innovation across industries. Key technologies underpinning the market include GPS-based geofencing for outdoor accuracy, alongside Wi-Fi-based geofencing, Bluetooth Low Energy beacons, and RFID-based geofencing for precise indoor applications.
- As businesses integrate these tools, the emphasis is shifting toward privacy-by-design principles to navigate complex regulatory landscapes, making the location tracking protocol a boardroom-level concern. The integration of fleet management geofencing, for instance, has been shown to reduce manual documentation errors by over 90%.
- The market’s trajectory is toward creating a seamless mobile engagement platform that delivers contextual communication through automated alerts, solidifying its role in modern digital strategy.
What are the Key Data Covered in this Geofencing Market Research and Growth Report?
-
What is the expected growth of the Geofencing Market between 2026 and 2030?
-
USD 10.19 billion, at a CAGR of 32.5%
-
-
What segmentation does the market report cover?
-
The report is segmented by Product (Fixed, and Mobile), Component (Services, and Solutions), Technology (GPS-based geofencing, RFID-based geofencing, Wi-Fi-based geofencing, Bluetooth low energy, and Cellular network-based geofencing) and Geography (North America, Europe, APAC, Middle East and Africa, South America)
-
-
Which regions are analyzed in the report?
-
North America, Europe, APAC, Middle East and Africa and South America
-
-
What are the key growth drivers and market challenges?
-
Increase in location-based marketing, High initial setup costs and capital investments
-
-
Who are the major players in the Geofencing Market?
-
Apple Inc., Bluedot Industries Pty Ltd., Embitel Technologies Pvt. Ltd., Esri Inc., GeoMoby Pty Ltd., Geotab Inc., Google LLC, GroundTruth, Infillion, LocationSmart, Mapcite, Plot Projects, Pulsate Mobile Ltd., Radar Labs Inc., Saksoft Ltd., Samsara Inc., Simpli.fi Holdings Inc., ThumbVista and Verizon Communications Inc.
-
Market Research Insights
- The geofencing market is evolving through the strategic implementation of location-aware features, which are proving essential for enhancing operational efficiency tools and achieving measurable business outcomes. For instance, the adoption of geofencing for logistics has been shown to improve asset recovery rates by over 25%, while its use in retail settings has led to a 15% uplift in customer engagement.
- These results are driven by sophisticated user behavior analytics that enable highly effective location-based advertising and personalized user experiences. As organizations prioritize supply chain visibility and robust site security monitoring, the demand for integrated geofencing for retail and industrial applications continues to grow. This shift underscores the technology's value in delivering tangible returns on investment.
We can help! Our analysts can customize this geofencing market research report to meet your requirements.
 RIA -
RIA - 
