Grain Silos And Ancillary Equipment Market Size 2026-2030
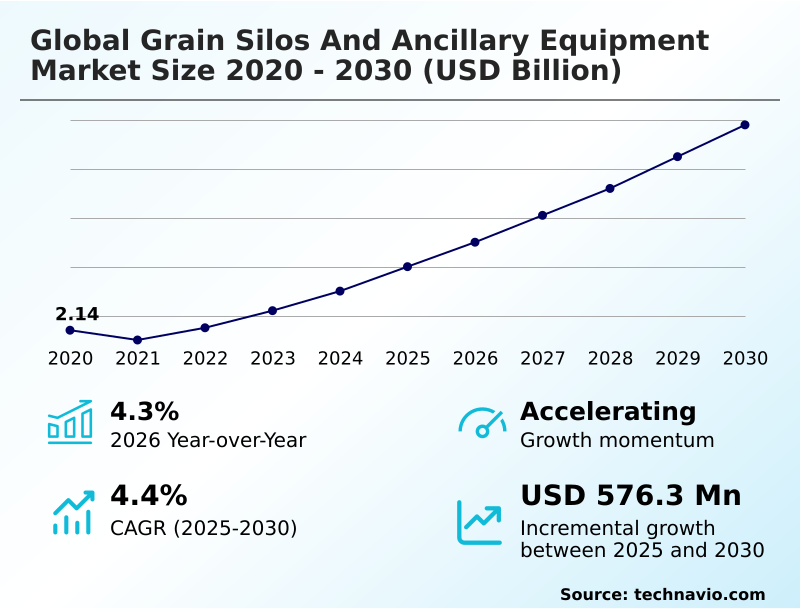
The grain silos and ancillary equipment market size is valued to increase by USD 576.3 million, at a CAGR of 4.4% from 2025 to 2030. Strategic expansion of sovereign food reserves and national storage infrastructure initiatives will drive the grain silos and ancillary equipment market.
Major Market Trends & Insights
- APAC dominated the market and accounted for a 41% growth during the forecast period.
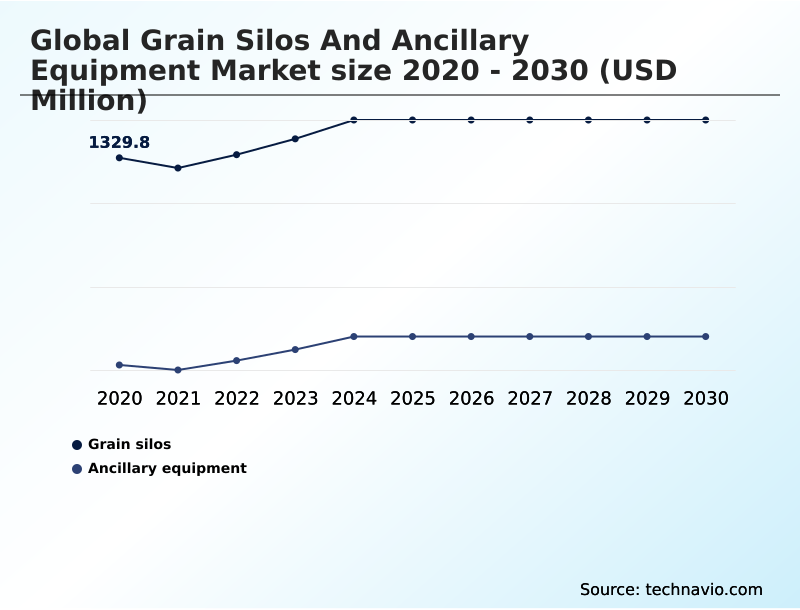
- By Type - Grain silos segment was valued at USD 1.43 billion in 2024
- By Application - Grain transportation segment accounted for the largest market revenue share in 2024
Market Size & Forecast
- Market Opportunities: USD 840.2 million
- Market Future Opportunities: USD 576.3 million
- CAGR from 2025 to 2030 : 4.4%
Market Summary
- The grain silos and ancillary equipment market is undergoing a significant technological transformation, driven by the imperatives of global food security and supply chain optimization. The core of this market involves not just the construction of galvanized steel silos and hopper-bottom silos but also the integration of sophisticated ancillary systems.
- These include automated grain handling, high-capacity grain dryers, and iot-enabled monitoring to ensure grain quality preservation. A key business scenario involves large agricultural cooperatives using predictive spoilage analytics and remote-managed storage solutions to minimize post-harvest losses.
- By analyzing real-time data from temperature monitoring cables and automated grain stirrers, operators can proactively manage aeration and prevent spoilage, thereby maximizing revenue and ensuring a stable supply to food processors. This shift from passive storage to active, data-driven asset management is defining the competitive landscape.
- The adoption of modular silo construction and energy-efficient drying systems further allows for scalable and sustainable operations, addressing both economic and environmental pressures.
What will be the Size of the Grain Silos And Ancillary Equipment Market during the forecast period?
Get Key Insights on Market Forecast (PDF) Get Free Sample
How is the Grain Silos And Ancillary Equipment Market Segmented?
The grain silos and ancillary equipment industry research report provides comprehensive data (region-wise segment analysis), with forecasts and estimates in "USD million" for the period 2026-2030, as well as historical data from 2020-2024 for the following segments.
- Type
- Grain silos
- Ancillary equipment
- Application
- Grain transportation
- Grain storage
- Capacity
- Medium
- Large
- Small
- Geography
- APAC
- China
- India
- Australia
- North America
- US
- Canada
- Mexico
- Europe
- Germany
- France
- UK
- South America
- Brazil
- Argentina
- Middle East and Africa
- South Africa
- Saudi Arabia
- UAE
- Rest of World (ROW)
- APAC
By Type Insights
The grain silos segment is estimated to witness significant growth during the forecast period.
The grain silos and ancillary equipment market is segmented by type into grain silos and ancillary equipment.
The grain silos segment, encompassing structures built with modular silo construction techniques, is evolving rapidly with the integration of smart silo technology to support global food security initiatives. This evolution transforms passive containers into active assets for post-harvest loss reduction.
The ancillary equipment segment is equally critical, including the mechanical systems for handling and conditioning. This includes bucket elevators, grain aeration systems, grain cleaning systems, and automated weighing systems, all essential for the operational integrity of decentralized grain storage networks.
The integration of advanced sensors into this equipment has been shown to optimize energy consumption by up to 25%, highlighting its importance.
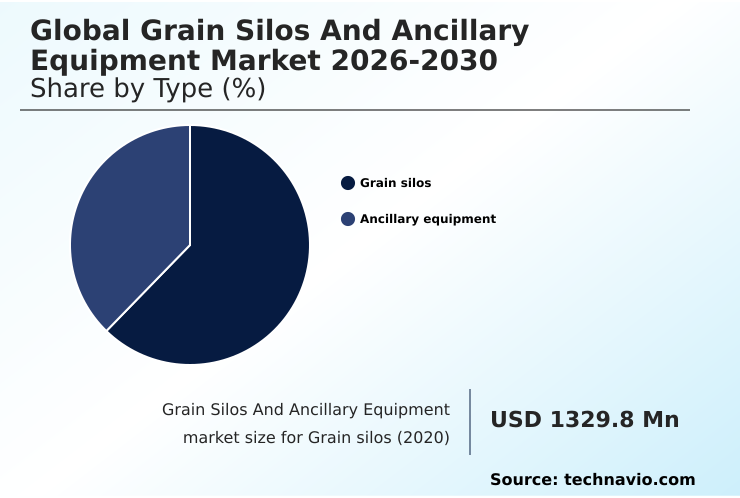
The Grain silos segment was valued at USD 1.43 billion in 2024 and showed a gradual increase during the forecast period.
Regional Analysis
APAC is estimated to contribute 41% to the growth of the global market during the forecast period.Technavio’s analysts have elaborately explained the regional trends and drivers that shape the market during the forecast period.

See How Grain Silos And Ancillary Equipment Market Demand is Rising in APAC Get Free Sample
The geographic landscape is led by APAC, which will account for approximately 41% of the market's incremental growth.
This expansion is driven by government-led strategic food reserves in countries like India and China, which are heavily investing in large-scale galvanized steel silos and flat-bottom silos.
North America remains a mature market focused on upgrading to remote-managed storage solutions and on-farm storage solutions to manage high-yield crops. The adoption of hopper-bottom silos and automated grain stirrers is rising globally to improve efficiency.
Europe emphasizes sustainable practices, integrating high-yield steels and ergonomic access systems to meet stringent safety and environmental standards. The global shift toward integrated food platform solutions ensures that regional infrastructure development aligns with modern supply chain demands.
Market Dynamics
Our researchers analyzed the data with 2025 as the base year, along with the key drivers, trends, and challenges. A holistic analysis of drivers will help companies refine their marketing strategies to gain a competitive advantage.
- Strategic decision-making in the grain silos and ancillary equipment market requires a deep understanding of long-tail factors. Evaluating the ROI of on-farm versus commercial storage is a critical exercise for producers, weighing logistical control against economies of scale.
- The impact of steel price volatility on silo construction continues to be a major variable, influencing the total cost of ownership and favoring flexible procurement strategies. For instance, the cost of modular vs concrete silos presents a trade-off between deployment speed and long-term durability, with modular systems often showing a faster path to operational readiness.
- Ancillary systems for high-moisture grain drying are becoming essential in humid climates, directly impacting grain quality and market value. Furthermore, compliance with combustible dust safety standards is non-negotiable, necessitating investment in specialized cleaning and ventilation systems. When comparing hopper-bottom and flat-bottom designs, operators must balance ease of unloading against maximizing storage density.
- The integration of AI in grain inventory management offers a significant competitive advantage, with some operators achieving inventory accuracy improvements that are over 20% higher than traditional methods. As climate-resilient storage for extreme weather events becomes a priority, the benefits of galvanized steel in grain storage are increasingly apparent due to its strength and corrosion resistance.
What are the key market drivers leading to the rise in the adoption of Grain Silos And Ancillary Equipment Industry?
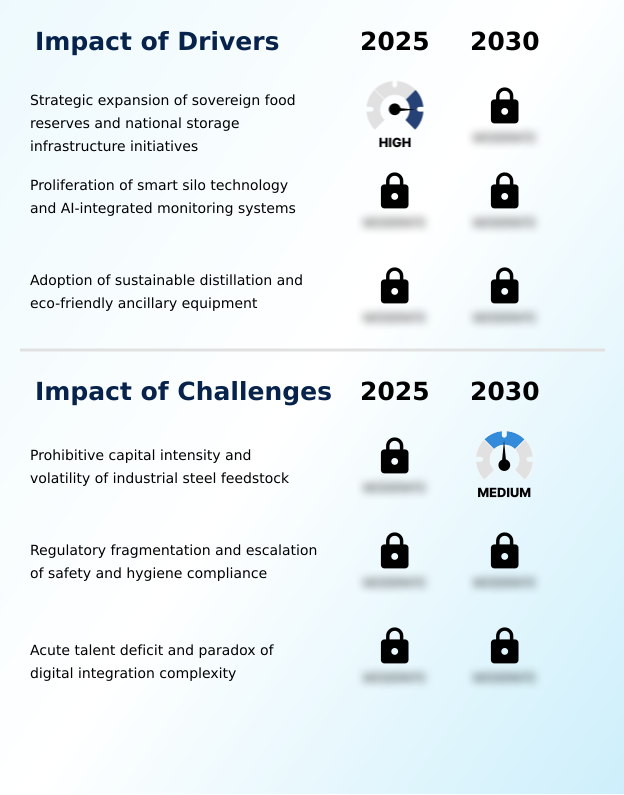
- Strategic expansions of sovereign food reserves and large-scale national storage infrastructure initiatives are key drivers for market growth.
- A major driver is the global focus on post-harvest loss reduction, with some regions historically losing up to 30% of their yield.
- Sovereign food reserve programs are accelerating investments in modern infrastructure, demanding high-throughput handling systems and automated grain handling to manage strategic stockpiles.
- Technologically, iot-enabled monitoring and predictive maintenance sensors are enabling a shift to proactive management, optimizing energy use by up to 25%.
- This push for efficiency is also seen in the adoption of energy-efficient ancillary systems, including energy-efficient drying systems and high-capacity grain dryers.
- The market is also benefiting from a pivot to sustainable construction materials, ensuring that new facilities are both operationally effective and environmentally responsible.
What are the market trends shaping the Grain Silos And Ancillary Equipment Industry?
- The proliferation of IoT-integrated monitoring and predictive spoilage analytics is emerging as a transformative trend. This shift enables proactive grain management through real-time data on quality parameters.
- A primary trend is the adoption of climate-resilient storage infrastructure, driven by the need to protect assets from extreme weather. The use of advanced alloy coatings and modular bolted silo designs is becoming standard, extending asset life up to twenty-five years without significant intervention.
- Concurrently, automated aeration controls and predictive spoilage analytics are transforming grain quality preservation, reducing post-harvest losses significantly. This data-driven approach, which contributes an estimated 1.2% boost to the annual growth rate, extends to automated load-out systems and digital pest monitoring, enhancing efficiency at every stage.
- The focus on circular economy principles and optimizing farm-level storage capacity with components like variable frequency drives underscores the industry-wide push for sustainable, intelligent operations.
What challenges does the Grain Silos And Ancillary Equipment Industry face during its growth?
- Prohibitive capital intensity, combined with the price volatility of industrial steel feedstock, poses a key challenge to market expansion.
- A significant challenge stems from the price volatility of industrial-grade galvanized steel, which can alter project costs by as much as 20% quarterly and complicates financial planning for large-scale infrastructure. While alternatives like hermetic grain bags exist, they lack the long-term grain quality preservation of steel structures.
- Another hurdle is regulatory complexity, particularly around combustible dust management, which mandates advanced systems like zero-bin-entry sweep augers and increases operational costs. The skilled labor deficit further complicates matters, with a shortage of technicians capable of installing and maintaining temperature monitoring cables and chain conveyors extending project timelines by an average of 15%.
- These issues impact everything from decentralized grain storage initiatives to the efficiency of major intermodal logistics hubs.
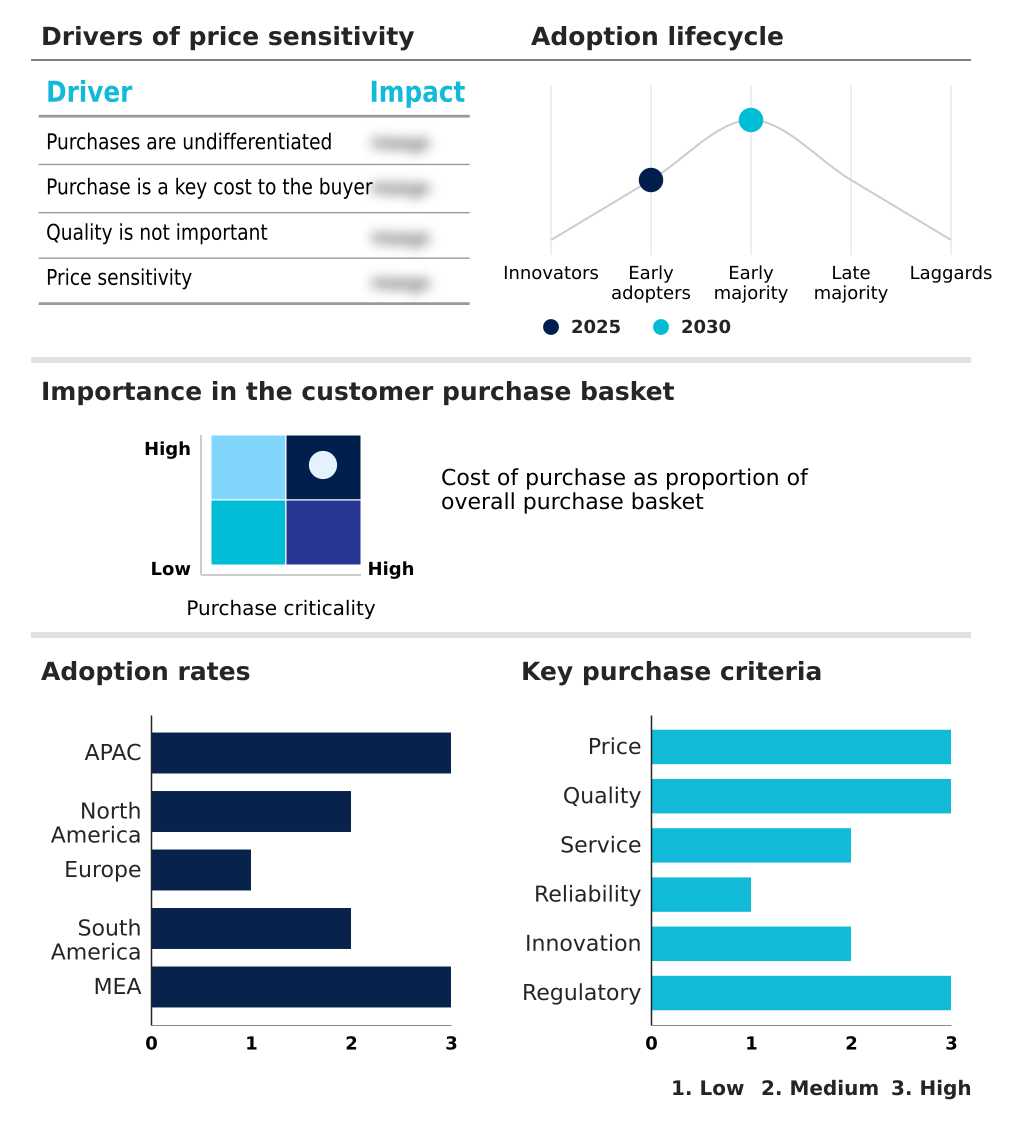
Exclusive Technavio Analysis on Customer Landscape
The grain silos and ancillary equipment market forecasting report includes the adoption lifecycle of the market, covering from the innovator’s stage to the laggard’s stage. It focuses on adoption rates in different regions based on penetration. Furthermore, the grain silos and ancillary equipment market report also includes key purchase criteria and drivers of price sensitivity to help companies evaluate and develop their market growth analysis strategies.
Customer Landscape of Grain Silos And Ancillary Equipment Industry
Competitive Landscape
Companies are implementing various strategies, such as strategic alliances, grain silos and ancillary equipment market forecast, partnerships, mergers and acquisitions, geographical expansion, and product/service launches, to enhance their presence in the industry.
ABMS Silos - Offerings encompass a comprehensive portfolio of grain silos and ancillary equipment, featuring custom-engineered storage, handling, and conditioning solutions for global agricultural and commercial applications.
The industry research and growth report includes detailed analyses of the competitive landscape of the market and information about key companies, including:
- ABMS Silos
- AGI
- BBCA Silo
- Brock Grain Systems
- Behlen Mfg Co.
- Chief Agri
- CST Industries Inc.
- Grain and Protein Technologies
- Grain Silo International Co
- Meridian Manufacturing Inc.
- Mysilo Grain Storage Systems
- Prado Storage Solutions SL
- Rostfrei Steels Pvt. Ltd.
- Silos Cordoba SL
- Simeza
- Sioux Steel Co.
- Sukup Manufacturing Co.
- Symaga SA
- Top Silo Constructions
- Tornum AB
Qualitative and quantitative analysis of companies has been conducted to help clients understand the wider business environment as well as the strengths and weaknesses of key industry players. Data is qualitatively analyzed to categorize companies as pure play, category-focused, industry-focused, and diversified; it is quantitatively analyzed to categorize companies as dominant, leading, strong, tentative, and weak.
Recent Development and News in Grain silos and ancillary equipment market
- In December 2025, the Government of India announced the completion of nearly one hundred new godowns and silos across eleven states as part of its World's Largest Grain Storage Plan pilot phase.
- In April 2025, American Industrial Partners finalized its acquisition of a leading grain and protein technologies division, a strategic move to advance high-tech storage and seed processing solutions.
- In July 2025, the Government of India initiated a major grain storage expansion program, committing significant investment to construct seventy million tons of new capacity through advanced steel silos and smart warehouses.
- In January 2026, AGI appointed a new Chief Executive Officer to accelerate the company's strategic shift toward integrated food platform solutions and improve operational execution across its global manufacturing network.
Dive into Technavio’s robust research methodology, blending expert interviews, extensive data synthesis, and validated models for unparalleled Grain Silos And Ancillary Equipment Market insights. See full methodology.
| Market Scope | |
|---|---|
| Page number | 283 |
| Base year | 2025 |
| Historic period | 2020-2024 |
| Forecast period | 2026-2030 |
| Growth momentum & CAGR | Accelerate at a CAGR of 4.4% |
| Market growth 2026-2030 | USD 576.3 million |
| Market structure | Fragmented |
| YoY growth 2025-2026(%) | 4.3% |
| Key countries | China, India, Australia, Japan, South Korea, Indonesia, US, Canada, Mexico, Germany, France, UK, Italy, Spain, The Netherlands, Brazil, Argentina, Chile, South Africa, Egypt, Saudi Arabia, UAE and Turkey |
| Competitive landscape | Leading Companies, Market Positioning of Companies, Competitive Strategies, and Industry Risks |
Research Analyst Overview
- The grain silos and ancillary equipment market is defined by a rapid technological convergence aimed at enhancing food security and operational efficiency. The industry is moving beyond simple storage to integrated systems featuring automated grain handling and iot-enabled monitoring.
- Key components like galvanized steel silos, hopper-bottom silos, and flat-bottom silos are now standard, but differentiation comes from the ancillary equipment, including bucket elevators, grain aeration systems, and high-capacity grain dryers. The integration of predictive spoilage analytics and remote-managed storage solutions allows for proactive quality control.
- A major boardroom consideration is the volatility of raw materials; for example, steel price fluctuations have been shown to alter large-scale project costs by as much as 20% within a single quarter. This drives interest in modular silo construction and advanced alloy coatings for long-term resilience.
- The adoption of automated load-out systems and digital pest monitoring is also rising to counter labor shortages and meet stringent hygiene standards, making data-driven management a prerequisite for competitiveness.
What are the Key Data Covered in this Grain Silos And Ancillary Equipment Market Research and Growth Report?
-
What is the expected growth of the Grain Silos And Ancillary Equipment Market between 2026 and 2030?
-
USD 576.3 million, at a CAGR of 4.4%
-
-
What segmentation does the market report cover?
-
The report is segmented by Type (Grain silos, and Ancillary equipment), Application (Grain transportation, and Grain storage), Capacity (Medium, Large, and Small) and Geography (APAC, North America, Europe, South America, Middle East and Africa)
-
-
Which regions are analyzed in the report?
-
APAC, North America, Europe, South America and Middle East and Africa
-
-
What are the key growth drivers and market challenges?
-
Strategic expansion of sovereign food reserves and national storage infrastructure initiatives, Prohibitive capital intensity and volatility of industrial steel feedstock
-
-
Who are the major players in the Grain Silos And Ancillary Equipment Market?
-
ABMS Silos, AGI, BBCA Silo, Brock Grain Systems, Behlen Mfg Co., Chief Agri, CST Industries Inc., Grain and Protein Technologies, Grain Silo International Co, Meridian Manufacturing Inc., Mysilo Grain Storage Systems, Prado Storage Solutions SL, Rostfrei Steels Pvt. Ltd., Silos Cordoba SL, Simeza, Sioux Steel Co., Sukup Manufacturing Co., Symaga SA, Top Silo Constructions and Tornum AB
-
Market Research Insights
- Market dynamics are shaped by a push for operational efficiency and resilience. The adoption of smart silo technology is enabling operators to reduce post-harvest losses significantly, while the integration of predictive maintenance sensors is cutting downtime in ancillary systems. For instance, facilities using advanced analytics have optimized energy consumption by up to 25%.
- However, the industry faces a critical skilled labor shortage, which has extended project commissioning timelines by an average of 15%, creating logistical bottlenecks. Investments are increasingly directed toward on-farm storage solutions and integrated food platform solutions that offer end-to-end digital grain management.
- This focus on technology-driven efficiency is crucial for navigating volatile commodity prices and stringent food safety regulations, ultimately defining a new standard for modern grain storage infrastructure.
We can help! Our analysts can customize this grain silos and ancillary equipment market research report to meet your requirements.
 RIA -
RIA - 
