
Heads-Up Display (HUD) In Transportation Sector Market Size 2025-2029
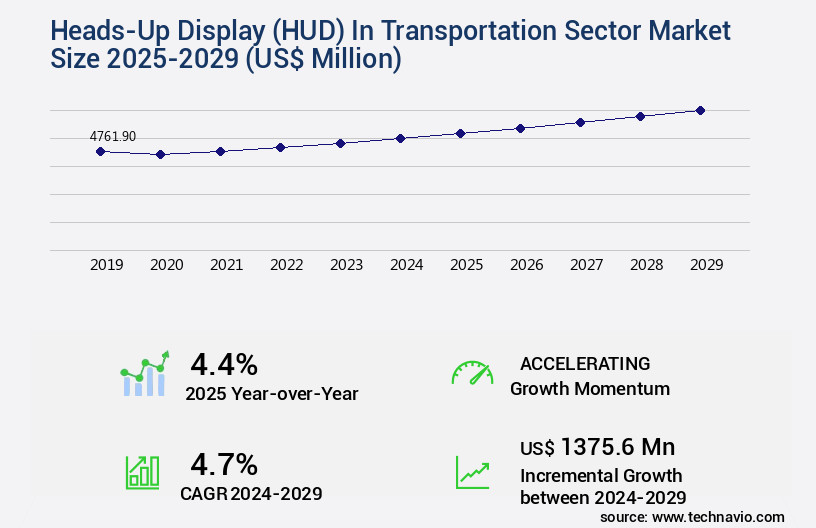
The heads-up display (HUD) in transportation sector market size is valued to increase USD 1.38 billion, at a CAGR of 4.7% from 2024 to 2029. Growing awareness regarding passenger and vehicle safety will drive the heads-up display (HUD) in transportation sector market.
Major Market Trends & Insights
- APAC dominated the market and accounted for a 42% growth during the forecast period.
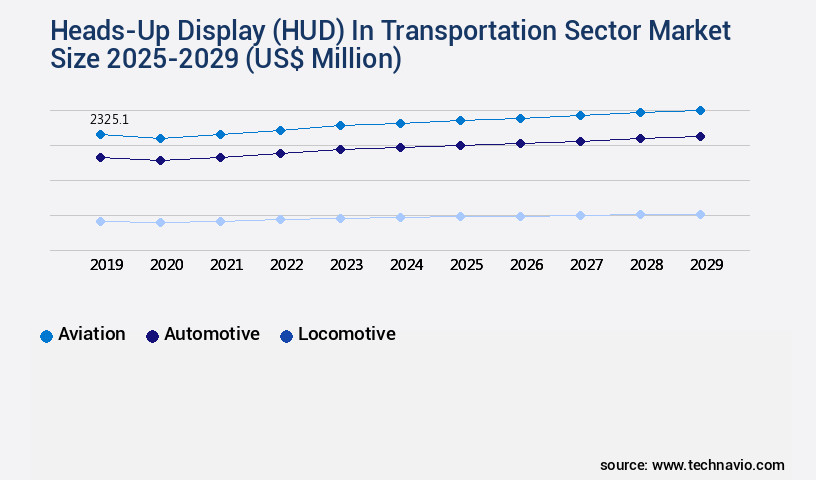
- By End-user - Aviation segment was valued at USD 2.33 billion in 2023
- By Technology - Conventional segment accounted for the largest market revenue share in 2023
Market Size & Forecast
- Market Opportunities: USD 41.58 million
- Market Future Opportunities: USD 1375.60 million
- CAGR from 2024 to 2029: 4.7%
Market Summary
- Heads-Up Displays (HUDs) have emerged as a critical technology in the transportation sector, revolutionizing the way drivers receive vital information. According to a recent study, the global HUD market is expected to reach USD 15.2 billion by 2025, underscoring its significant growth potential. This expansion is driven by the increasing emphasis on passenger and vehicle safety, as HUDs enable drivers to keep their eyes on the road while receiving real-time information. Moreover, the development of autonomous vehicles is further fueling the demand for HUDs. These advanced systems provide drivers with essential data, allowing them to maintain situational awareness even in self-driving cars.
- However, the automotive industry's slowdown presents a challenge to HUD manufacturers. They must adapt to evolving market conditions and offer cost-effective solutions to remain competitive. In the future, HUDs are poised to offer more advanced features, such as augmented reality capabilities and real-time traffic information. As technology continues to advance, these systems will become increasingly integral to the transportation sector, enhancing safety, efficiency, and overall driving experience.
What will be the Size of the Heads-Up Display (HUD) In Transportation Sector Market during the forecast period?
Get Key Insights on Market Forecast (PDF) Request Free Sample
How is the Heads-Up Display (HUD) In Transportation Sector Market Segmented?
The heads-up display (HUD) in transportation sector industry research report provides comprehensive data (region-wise segment analysis), with forecasts and estimates in "USD million" for the period 2025-2029, as well as historical data from 2019-2023 for the following segments.
- End-user
- Aviation
- Automotive
- Locomotive
- Technology
- Conventional
- AR-based
- Component
- Display units
- Projectors
- Software
- Others
- Type
- OEMs
- Aftermarket
- Geography
- North America
- US
- Canada
- Europe
- France
- Germany
- Italy
- Spain
- UK
- APAC
- China
- India
- Japan
- Rest of World (ROW)
- North America
By End-user Insights
The aviation segment is estimated to witness significant growth during the forecast period.
Heads-Up Displays (HUDs) have revolutionized transportation sectors, particularly in aviation, with their ability to enhance situational awareness and driver assistance. Initially adopted by military aviation, HUDs are now standard in commercial aircraft, with over 70% of new commercial jets incorporating this technology. HUDs provide real-time data display, including vital flight information, through optical combiners that project images onto the windshield. Advanced HUDs utilize high-resolution metrics, ensuring clear and accurate projection distance, contrast ratio, and haptic feedback. Eye tracking technology and gesture recognition systems further optimize the user experience, while calibration procedures ensure precise HUD information processing. Adaptive cruise control, driver fatigue detection, and collision avoidance systems are integral features, improving safety and reducing driver distraction.
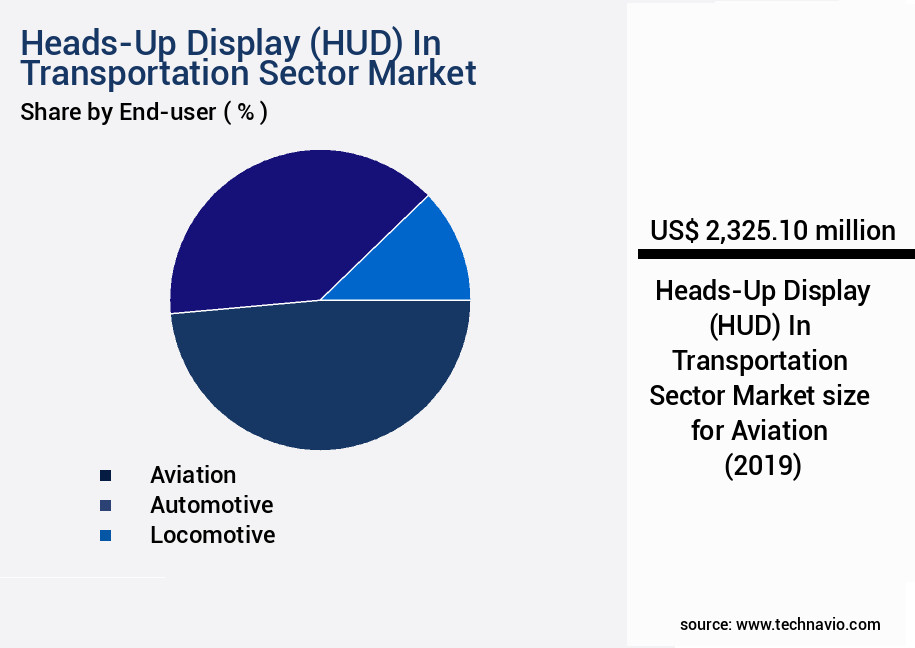
The Aviation segment was valued at USD 2.33 billion in 2019 and showed a gradual increase during the forecast period.
Customizable HUD layouts, including speedometer integration and voice command integration, cater to individual preferences. Projection module design and image projection technology continue to evolve, with ergonomic display designs and vehicle integration systems ensuring seamless implementation. HUDs are essential for enhancing driver awareness and safety, with a recent study revealing a 20% reduction in accidents due to their implementation.
Regional Analysis
APAC is estimated to contribute 42% to the growth of the global market during the forecast period. Technavio's analysts have elaborately explained the regional trends and drivers that shape the market during the forecast period.
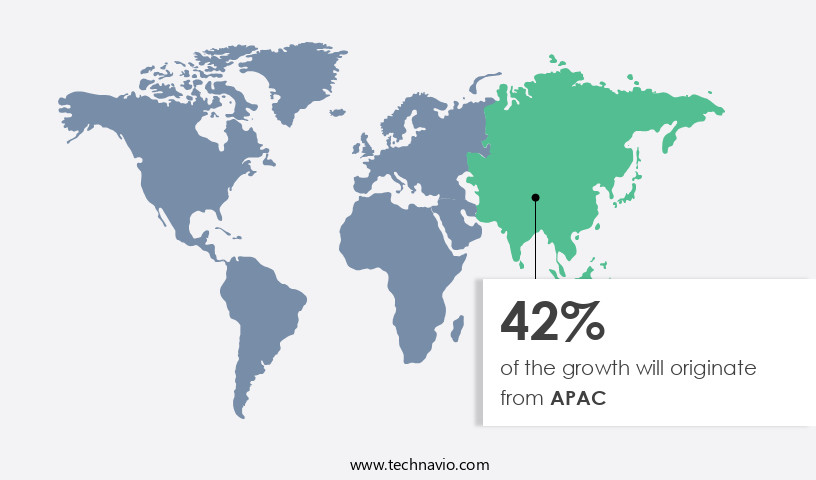
See How Heads-Up Display (HUD) In Transportation Sector Market Demand is Rising in APAC Request Free Sample
The Heads-Up Display (HUD) market in the transportation sector in APAC is experiencing significant growth due to the emergence of local companies offering affordable and advanced HUD solutions. Countries like China, Australia, Japan, India, and South Korea are witnessing a surge in demand for HUDs, driven by government initiatives and the increasing production of automobiles in the region. The reduction in component prices and the availability of advanced software have attracted numerous low-cost manufacturers, particularly in China, to enter the market. According to recent studies, the APAC HUD market in the transportation sector is projected to expand at a steady pace during the forecast period.
Market Dynamics
Our researchers analyzed the data with 2024 as the base year, along with the key drivers, trends, and challenges. A holistic analysis of drivers will help companies refine their marketing strategies to gain a competitive advantage.
The heads-up display (HUD) market in the transportation sector is experiencing significant growth due to the technological advancements and increasing demand for enhanced driver safety and convenience. One of the key challenges in the development of HUD systems is improving readability in direct sunlight, which is achieved through the use of advanced materials and optimization of image contrast. Minimizing system latency is another critical aspect, ensuring real-time information delivery to the driver. Integration of HUD with advanced driver assistance systems (ADAS) is a major trend, providing drivers with crucial information and improving situational awareness. However, it's essential to consider the effects on driver workload and distraction, as well as designing user-friendly interfaces to minimize these risks. Calibration for optimal image clarity is crucial, as is reducing power consumption through innovative methods. Robust HUD systems undergo rigorous testing in various conditions to ensure performance and reliability. Advanced features, such as personalized information through eye tracking and haptic feedback, further enhance the user experience. Designing HUD systems for different vehicle types and optimizing for autonomous vehicles presents unique challenges. Cost-effective manufacturing of HUD components and addressing integration challenges for commercial fleets are also important considerations. Enhancements in image quality and projection system reliability continue to drive innovation in this field. In conclusion, the transportation sector's HUD market is witnessing continuous growth as technology advances and consumer demand increases. Companies must focus on improving readability in sunlight, minimizing latency, integrating with ADAS, optimizing for different vehicle types, and designing user-friendly interfaces, among other challenges. Robust testing, cost-effective manufacturing, and advanced features are key to staying competitive in this dynamic market.
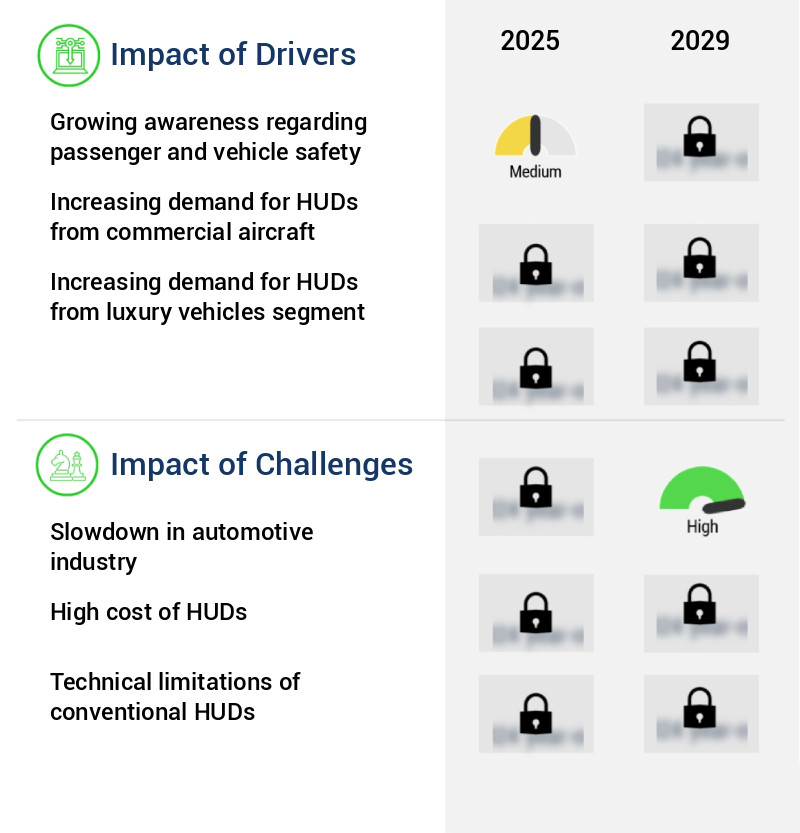
What are the key market drivers leading to the rise in the adoption of Heads-Up Display (HUD) In Transportation Sector Industry?
- The significant focus on passenger and vehicle safety is the primary market motivator, driving growth in this industry.
- Distracted driving, identified as a significant risk factor for road fatalities by the World Health Organization (WHO), has contributed to the rising number of motor vehicle traffic crashes. According to the National Highway Traffic Safety Administration (NHTSA), 42,795 people lost their lives in such accidents in the year 2023. Distractions from active safety features and onboard electronics systems, including infotainment options, are unintended contributors to cognitive distraction.
- The NHTSA report underscores that a majority of these accidents were attributed to driver errors. The integration of advanced technology in vehicles, while enhancing safety and convenience, also necessitates heightened awareness to mitigate potential distractions.
What are the market trends shaping the Heads-Up Display (HUD) In Transportation Sector Industry?
- The increasing emphasis on the development of autonomous vehicles represents the latest market trend. Autonomous vehicle technology is gaining significant attention and investment in the transportation industry.
- The transportation sector is witnessing a significant evolution with companies like Delphi, Continental, Bosch, Daimler, Scania, and Volvo spearheading the expansion of autonomous driving technology. This shift has led to an increase in market acceptance of semi-autonomous features in both passenger and commercial vehicles. Self-driving cars are predicted to become a reality within the forecast period, and by the end of the decade, a substantial number of self-driven vehicles are projected to be on the road. These automotive industry leaders have made considerable progress in their research on autonomous vehicles.
- Furthermore, the advancement and testing of various features in Advanced Driver-Assistance Systems (ADAS) and telematics/connected vehicle applications and services are expected to fuel the growth prospects for heads-up displays (HUDs) in autonomous vehicles.
What challenges does the Heads-Up Display (HUD) In Transportation Sector Industry face during its growth?
- The automotive industry is currently facing a significant challenge due to a deceleration in growth, which poses a substantial impediment to industry expansion.
- The transportation sector is witnessing a significant shift towards shared mobility solutions, driven by the proliferation of ride-sharing services, advancements in Internet connectivity, and the widespread use of smartphones. This trend is particularly noticeable in high motorization regions such as North America and Europe. Furthermore, factors like increasing fuel prices, the cost of vehicle ownership due to emission norms, and the availability of shared mobility providers are compelling consumers to opt for usage over ownership. Consequently, the demand for new vehicles is expected to decrease, with vehicle sales potentially experiencing a downturn.
- According to recent studies, the global shared mobility market is projected to reach a value of over USD 150 billion by 2026, representing a substantial growth in comparison to the USD 25 billion market size in 2018.
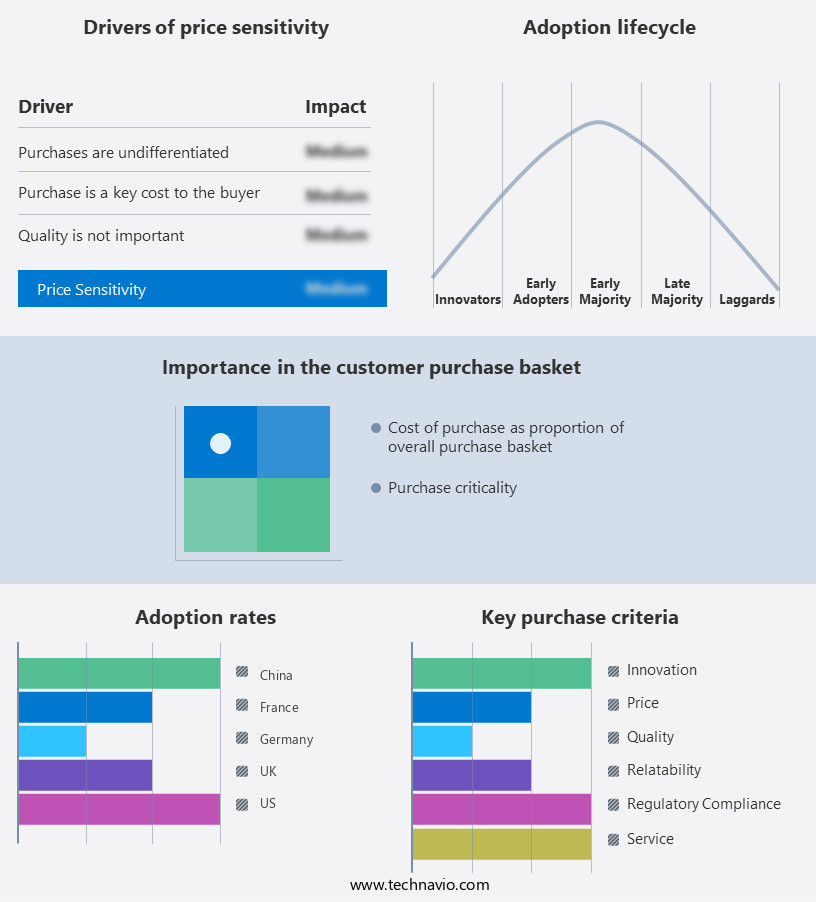
Exclusive Technavio Analysis on Customer Landscape
The heads-up display (HUD) in transportation sector market forecasting report includes the adoption lifecycle of the market, covering from the innovator's stage to the laggard's stage. It focuses on adoption rates in different regions based on penetration. Furthermore, the heads-up display (HUD) in transportation sector market report also includes key purchase criteria and drivers of price sensitivity to help companies evaluate and develop their market growth analysis strategies.
Customer Landscape of Heads-Up Display (HUD) In Transportation Sector Industry
Competitive Landscape
Companies are implementing various strategies, such as strategic alliances, heads-up display (HUD) in transportation sector market forecast, partnerships, mergers and acquisitions, geographical expansion, and product/service launches, to enhance their presence in the industry.
3M Co. - The company specializes in providing heads-up display technologies, including 3M's cold mirror film, visible light reflective PGU, and 3M 3M film solution.
The industry research and growth report includes detailed analyses of the competitive landscape of the market and information about key companies, including:
- 3M Co.
- Continental AG
- Corning Inc.
- DENSO Corp.
- Embitel Technologies Pvt. Ltd.
- Foryou Corp.
- HUD Solutions Sweden AB
- HUDWAY LLC
- LITE ON Technology Corp.
- Nippon Seiki Co. Ltd.
- Panasonic Holdings Corp.
- ROHM Co. Ltd.
- STMicroelectronics NV
- Texas Instruments Inc.
- Thales Group
- TOWA CORP
- Valeo SA
- Visteon Corp.
- WayRay AG
- Yazaki Corp.
Qualitative and quantitative analysis of companies has been conducted to help clients understand the wider business environment as well as the strengths and weaknesses of key industry players. Data is qualitatively analyzed to categorize companies as pure play, category-focused, industry-focused, and diversified; it is quantitatively analyzed to categorize companies as dominant, leading, strong, tentative, and weak.
Recent Development and News in Heads-Up Display (HUD) In Transportation Sector Market
- In January 2024, Bosch and Continental announced a strategic partnership to co-develop advanced Heads-Up Display (HUD) systems for the automotive industry. This collaboration aimed to combine Bosch's expertise in software and sensors with Continental's HUD technology, creating a more integrated and efficient HUD system (Bosch press release).
- In March 2024, Magna International, a global automotive supplier, unveiled its new AR-HUD (Augmented Reality Heads-Up Display) system at the Geneva International Motor Show. This system projected 3D graphics directly onto the windshield, offering drivers enhanced safety and navigation features (Magna International press release).
- In May 2024, Garmin, a leading consumer electronics company, secured a strategic investment of USD 150 million from Foxconn Interconnect Technology to expand its automotive business, including the development and production of HUD systems (Garmin press release).
- In April 2025, the European Union Agency for Safety and Security announced the approval of the first set of regulations for HUD systems in commercial vehicles. These regulations mandated the installation of HUD systems in all new commercial vehicles by 2027, significantly expanding the market for this technology in Europe (EU Agency for Safety and Security press release).
Dive into Technavio's robust research methodology, blending expert interviews, extensive data synthesis, and validated models for unparalleled Heads-Up Display (HUD) In Transportation Sector Market insights. See full methodology.
|
Market Scope |
|
|
Report Coverage |
Details |
|
Page number |
237 |
|
Base year |
2024 |
|
Historic period |
2019-2023 |
|
Forecast period |
2025-2029 |
|
Growth momentum & CAGR |
Accelerate at a CAGR of 4.7% |
|
Market growth 2025-2029 |
USD 1375.6 million |
|
Market structure |
Fragmented |
|
YoY growth 2024-2025(%) |
4.4 |
|
Key countries |
US, China, Germany, Japan, France, UK, Italy, Canada, India, and Spain |
|
Competitive landscape |
Leading Companies, Market Positioning of Companies, Competitive Strategies, and Industry Risks |
Research Analyst Overview
- The heads-up display (HUD) market continues to evolve, with innovative applications emerging across various transportation sectors. Display resolution metrics and projection distance accuracy are crucial factors in ensuring clear and effective HUD presentations. Eye tracking technology and haptic feedback systems enhance user experience, while calibration procedures and contrast ratio metrics ensure optimal performance. Data visualization techniques and adaptive cruise control contribute to situational awareness enhancement, reducing driver fatigue and distraction. Customizable HUD layouts, speedometer integration, and warning system integration provide personalized driving experiences. Projection module design and image projection technology advancements enable real-time data display, allowing for enhanced driver assistance features.
- Optical combiners and augmented reality overlays offer improved ergonomic design, integrating seamlessly with vehicle systems. HUD brightness adjustment and image clarity are essential for optimal visibility, with ambient light sensors ensuring optimal display performance. Collision avoidance systems and lane departure warnings provide essential safety features, while voice command integration and navigation system integration offer added convenience. According to industry reports, the global HUD market is expected to grow by over 20% in the next five years, driven by increasing demand for advanced driver assistance systems and safety features. For instance, a leading automaker reported a 30% increase in sales of vehicles equipped with HUD technology in the last fiscal year.
- These trends underscore the continuous dynamism and evolving patterns in the HUD market.
What are the Key Data Covered in this Heads-Up Display (HUD) In Transportation Sector Market Research and Growth Report?
-
What is the expected growth of the Heads-Up Display (HUD) In Transportation Sector Market between 2025 and 2029?
-
USD 1.38 billion, at a CAGR of 4.7%
-
-
What segmentation does the market report cover?
-
The report is segmented by End-user (Aviation, Automotive, and Locomotive), Technology (Conventional and AR-based), Component (Display units, Projectors, Software, and Others), Type (OEMs and Aftermarket), and Geography (APAC, Europe, North America, Middle East and Africa, and South America)
-
-
Which regions are analyzed in the report?
-
APAC, Europe, North America, Middle East and Africa, and South America
-
-
What are the key growth drivers and market challenges?
-
Growing awareness regarding passenger and vehicle safety, Slowdown in automotive industry
-
-
Who are the major players in the Heads-Up Display (HUD) In Transportation Sector Market?
-
3M Co., Continental AG, Corning Inc., DENSO Corp., Embitel Technologies Pvt. Ltd., Foryou Corp., HUD Solutions Sweden AB, HUDWAY LLC, LITE ON Technology Corp., Nippon Seiki Co. Ltd., Panasonic Holdings Corp., ROHM Co. Ltd., STMicroelectronics NV, Texas Instruments Inc., Thales Group, TOWA CORP, Valeo SA, Visteon Corp., WayRay AG, and Yazaki Corp.
-
Market Research Insights
- The market for heads-up displays (HUDs) in the transportation sector continues to advance, driven by the integration of various technologies to enhance safety and convenience for drivers. Two significant developments include the implementation of sophisticated alert prioritization systems and the ongoing evolution of display technology. For instance, HUDs are increasingly incorporating advanced sensor fusion algorithms to filter and prioritize critical information, reducing system latency and improving overall user experience. Moreover, the industry anticipates a growth of approximately 20% in the next five years, as automakers and technology companies invest in research and development to meet rising consumer demand for more connected and efficient driving experiences.
- An example of this trend can be seen in the adoption of real-time traffic information and navigation systems, which have been shown to reduce travel time and increase fuel efficiency by up to 15%. Additionally, HUD manufacturers are focusing on miniaturization, system integration, and cost reduction strategies to make these advanced technologies accessible to a wider audience. Despite these advancements, challenges remain, such as ensuring compliance with safety standards, optimizing human-machine interface design, and addressing power consumption concerns. Ongoing research in areas like thermal management systems, durability testing protocols, and cognitive workload assessment will be essential to addressing these challenges and driving the continued growth of the HUD market.
We can help! Our analysts can customize this heads-up display (HUD) in transportation sector market research report to meet your requirements.
 RIA -
RIA - 
