Healthcare Consumables Market Size 2025-2029
The healthcare consumables market size is valued to increase USD 42.7 billion, at a CAGR of 5.1% from 2024 to 2029. Increasing prevalence of chronic diseases will drive the healthcare consumables market.
Major Market Trends & Insights
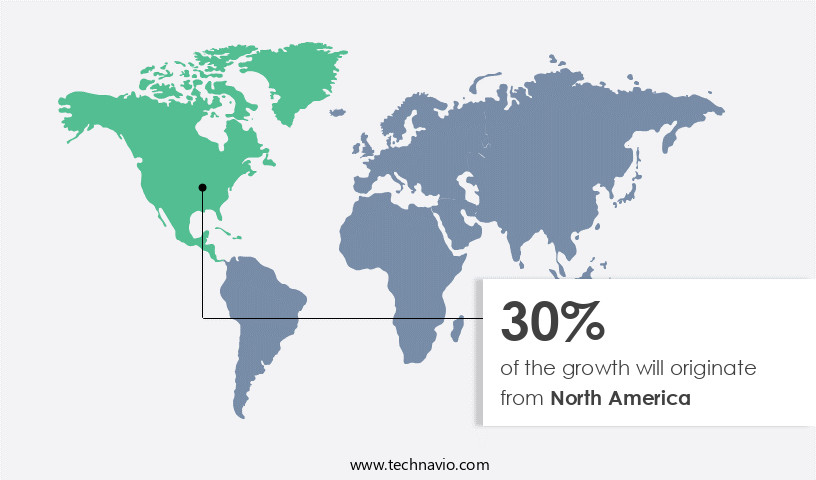
- North America dominated the market and accounted for a 30% growth during the forecast period.
- By Type - Medical consumables segment was valued at USD 47.60 billion in 2023
- By End-user - Hospitals and clinics segment accounted for the largest market revenue share in 2023
Market Size & Forecast
- Market Opportunities: USD 61.36 billion
- Market Future Opportunities: USD 42.70 billion
- CAGR from 2024 to 2029 : 5.1%
Market Summary
- The market experiences unyielding expansion, driven by the escalating prevalence of chronic diseases and the relentless pursuit for enhanced patient care. This market encompasses a diverse range of products, from disposable syringes and gloves to dialysis equipment and IV solutions. A significant data point underscores this growth: the market is projected to reach a value of USD205.2 billion by 2025, according to a reputable market research firm. The demand for eco-friendly and biodegradable consumables is on the rise, as sustainability concerns gain prominence. Stringent regulatory compliance requirements, such as the European Union's Medical Devices Regulation, further fuel the market's evolution.
- In response, manufacturers are investing in research and development to create innovative, sustainable, and cost-effective solutions. The healthcare consumables sector's future direction is marked by a focus on improving patient outcomes, reducing waste, and ensuring regulatory compliance. This commitment to innovation and sustainability will continue to propel the market forward, offering ample opportunities for growth and development.
What will be the Size of the Healthcare Consumables Market during the forecast period?

Get Key Insights on Market Forecast (PDF) Request Free Sample
How is the Healthcare Consumables Market Segmented ?
The healthcare consumables industry research report provides comprehensive data (region-wise segment analysis), with forecasts and estimates in "USD billion" for the period 2025-2029, as well as historical data from 2019-2023 for the following segments.
- Type
- Medical consumables
- Wound care consumables
- Diagnostic consumables
- Personal protective equipment
- Others
- End-user
- Hospitals and clinics
- Diagnostic laboratories
- Home care
- Research and academic institutes
- Geography
- North America
- US
- Canada
- Europe
- France
- Germany
- UK
- APAC
- Australia
- China
- India
- Japan
- South Korea
- Rest of World (ROW)
- North America
By Type Insights
The medical consumables segment is estimated to witness significant growth during the forecast period.
The market is a dynamic and evolving sector, encompassing a vast array of essential products for optimal patient care. Medical consumables, a significant segment within this market, play a pivotal role in healthcare settings, facilitating everyday procedures and treatments. Sterile processing techniques ensure the hygiene and safety of in-vitro diagnostic devices, patient monitoring equipment, and surgical instrument sterilization. Syringe manufacturing processes yield precision instruments for drug delivery systems and anesthesia equipment maintenance. Moreover, endoscope cleaning solutions and reusable medical equipment undergo rigorous maintenance to maintain infection control protocols. Hospital bedding textiles and medical waste management systems contribute to healthcare facility hygiene.
Intravenous solutions and iv tubing composition are crucial for intravenous therapy, while electrocardiogram electrodes and surgical drapes materials support diagnostic and surgical procedures. Pharmaceutical packaging materials and pharmacy dispensing systems ensure the safe handling and distribution of medications. A noteworthy subsegment is the use of catheter materials and disposable gloves, which prioritize patient safety and comfort. Personal protective equipment, diagnostic imaging consumables, laboratory testing supplies, cardiac care consumables, surgical gowns materials, and medical devices sterilization further expand the market's scope. Wound care dressings, dialysis consumables, biohazard waste disposal, and respiratory therapy equipment cater to various patient needs.
Approximately 65% of global hospitals use disposable medical gowns, underscoring their importance in infection control. This market's continuous evolution reflects the ongoing commitment to enhancing patient care and safety.

The Medical consumables segment was valued at USD 47.60 billion in 2019 and showed a gradual increase during the forecast period.

Regional Analysis
North America is estimated to contribute 30% to the growth of the global market during the forecast period.Technavio’s analysts have elaborately explained the regional trends and drivers that shape the market during the forecast period.
See How Healthcare Consumables Market Demand is Rising in North America Request Free Sample
The market in North America is experiencing significant growth, fueled by substantial healthcare spending, a high prevalence of chronic diseases, and an aging population. According to the Centers for Medicare and Medicaid Services (CMS), healthcare spending in the US increased by 7.5% in 2023, reaching USD4.9 trillion, or USD14,570 per person. This significant expenditure, representing 17.6% of the national Gross Domestic Product (GDP), underscores the importance of healthcare consumables in supporting the extensive medical services provided in the region. The high spending levels drive the demand for a wide range of consumables, from personal protective equipment (PPE) to advanced wound care products, ensuring that healthcare facilities are well-equipped to deliver quality care.
Furthermore, the well-established healthcare infrastructure and government initiatives in North America bolster market growth. For instance, the National Institutes of Health (NIH) and the Food and Drug Administration (FDA) facilitate the development and approval of innovative healthcare consumables. The market's robust nature is further evidenced by the increasing number of mergers and acquisitions, as companies seek to expand their product offerings and enhance their market presence.
Market Dynamics
Our researchers analyzed the data with 2024 as the base year, along with the key drivers, trends, and challenges. A holistic analysis of drivers will help companies refine their marketing strategies to gain a competitive advantage.
The market encompasses a wide range of products used in the delivery of healthcare services, including single-use medical devices, wound care dressings, and various disinfection supplies. A critical aspect of this market is ensuring the sterilization and disinfection of these consumables to minimize the risk of contamination in healthcare settings. Single-use medical devices require effective sterilization methods to maintain their functionality and prolong their lifespan. Material selection plays a significant role in device sterilization, as different materials respond differently to various sterilization techniques. The impact of material selection on device lifespan is a crucial consideration for manufacturers and healthcare providers alike. Different disinfection protocols, such as steam sterilization, ethylene oxide gas sterilization, and radiation sterilization, each offer unique advantages and challenges. Evaluating the effectiveness of these protocols is essential to ensure regulatory compliance for medical device sterilization and optimize infection control procedures in hospitals. Improving supply chain efficiency for medical consumables is another critical factor in the market. This includes evaluating different wound care dressing materials, testing methods for biocompatibility of medical devices, and validating sterilization processes for medical equipment. Performance evaluation of different sterilization techniques is also necessary to address the challenges of medical waste management in healthcare facilities and develop strategies for reducing healthcare-associated infections. Advanced materials for disposable medical devices and sustainable practices in medical consumables manufacturing are becoming increasingly important in the market. Ensuring regulatory compliance, optimizing infection control procedures, and minimizing waste are key priorities for manufacturers and healthcare providers alike. By focusing on these areas, the market can continue to deliver high-quality, safe, and effective products to meet the evolving needs of the healthcare industry.

What are the key market drivers leading to the rise in the adoption of Healthcare Consumables Industry?
- The rising incidence of chronic diseases serves as the primary market driver, necessitating continuous growth in the healthcare industry.
- The market experiences continuous growth due to the escalating prevalence of chronic diseases, which necessitates frequent medical interventions and a consistent demand for various consumables. Diabetes, cardiovascular diseases, and cancer are significant contributors to this trend, necessitating an array of medical supplies for effective management and treatment. According to the International Diabetes Federation (IDF), the number of adults with diabetes is projected to reach 643 million by 2030 and 783 million by 2045.
- This burgeoning population requires a vast array of consumables, including glucose monitoring strips, insulin syringes, and catheters, to manage their conditions effectively. The market demonstrates a robust and evolving nature, catering to the essential needs of various sectors and ensuring optimal patient care.
What are the market trends shaping the Healthcare Consumables Industry?
- The increasing demand for eco-friendly and biodegradable consumables represents a significant market trend moving forward. This preference for sustainable options reflects a growing consciousness towards reducing environmental impact.
- The market is experiencing a notable evolution, with a growing emphasis on eco-friendly and biodegradable products. This shift is primarily driven by mounting concerns over medical waste disposal and the environmental impact of traditional consumables. As a result, there has been a surge in the adoption of sustainable alternatives such as biodegradable gloves, compostable wound dressings, and eco-friendly surgical masks. Companies are actively innovating to develop materials that minimize environmental impact while maintaining product efficiency. One recent development is the introduction of GloveOn COATS Biodegradable Nitrile Examination Gloves by Mun Australia.
- These gloves, launched on September 30, 2024, offer environmental benefits without compromising skin health. Featuring the Colloidal Oatmeal Active Therapeutic System (COATS), they help reduce the risk of contact dermatitis and irritation during prolonged wear. This trend underscores the robust growth and evolving nature of the market.
What challenges does the Healthcare Consumables Industry face during its growth?
- The stringent regulatory compliance requirements pose a significant challenge to the industry's growth, necessitating continuous adherence and adaption to maintain business operations.
- The market encompasses a wide range of products, including syringes, catheters, gloves, wound dressings, and surgical masks, which are essential components of healthcare delivery. Compliance with stringent regulatory requirements is a significant challenge for manufacturers and suppliers in this sector. Regulatory authorities worldwide set safety, quality, and efficacy standards, ensuring patient safety and product reliability. However, these regulations increase production costs, time-to-market, and operational complexity. In the United States, the Food and Drug Administration (FDA) categorizes medical consumables as Class I, II, or III medical devices based on risk level. For instance, surgical gloves (Class I) require general regulatory controls, while infusion pumps (Class II) undergo additional performance testing.
- Despite these challenges, the market continues to evolve, driven by factors such as population aging, rising chronic diseases, and technological advancements. According to recent estimates, The market was valued at approximately USD120 billion in 2020 and is projected to reach around USD180 billion by 2027, growing at a steady pace. This growth is attributed to increasing healthcare expenditures, expanding patient populations, and the introduction of technologically advanced products.
Exclusive Technavio Analysis on Customer Landscape
The healthcare consumables market forecasting report includes the adoption lifecycle of the market, covering from the innovator’s stage to the laggard’s stage. It focuses on adoption rates in different regions based on penetration. Furthermore, the healthcare consumables market report also includes key purchase criteria and drivers of price sensitivity to help companies evaluate and develop their market growth analysis strategies.

Customer Landscape of Healthcare Consumables Industry
Competitive Landscape
Companies are implementing various strategies, such as strategic alliances, healthcare consumables market forecast, partnerships, mergers and acquisitions, geographical expansion, and product/service launches, to enhance their presence in the industry.
3M Co. - The 3M ActiV.A.C. Therapy system utilizes healthcare consumables, including a 300 ml canister containing gel, to facilitate effective wound treatment. This component enhances the system's functionality, contributing to efficient healing processes.
The industry research and growth report includes detailed analyses of the competitive landscape of the market and information about key companies, including:
- 3M Co.
- Ansell Ltd.
- Avanos Medical Inc.
- Avery Dennison Corp.
- B.Braun SE
- Baxter International Inc.
- Becton Dickinson and Co.
- Cardinal Health Inc.
- Coloplast AS
- ConvaTec Group Plc
- Cook Group Inc.
- Hollister Inc.
- Johnson and Johnson
- Kimberly Clark Corp.
- Medline Industries LP
- Medtronic Plc
- Smith and Nephew plc
- Teleflex Inc.
- Terumo Corp.
- Thermo Fisher Scientific Inc.
Qualitative and quantitative analysis of companies has been conducted to help clients understand the wider business environment as well as the strengths and weaknesses of key industry players. Data is qualitatively analyzed to categorize companies as pure play, category-focused, industry-focused, and diversified; it is quantitatively analyzed to categorize companies as dominant, leading, strong, tentative, and weak.
Recent Development and News in Healthcare Consumables Market
- In January 2024, Medtronic plc, a global healthcare solutions company, announced the launch of its new insulin pump system, MiniMed™ 780G with SmartGuard™ technology, which integrates with the company's smartphone app for remote monitoring and personalized insulin dosing recommendations (Medtronic Press Release).
- In March 2024, Siemens Healthineers and IBM Watson Health entered into a strategic partnership to develop and commercialize AI-powered diagnostic tools for various diseases, including cancer and neurological conditions, aiming to improve accuracy and efficiency in healthcare diagnostics (IBM Watson Health Press Release).
- In May 2024, 3M Health Care announced the acquisition of M*Modal, a leading provider of clinical documentation and speech recognition solutions, for approximately USD1 billion, expanding 3M's digital health offerings and enhancing its capabilities in artificial intelligence and natural language processing technologies (3M Press Release).
- In April 2025, the European Commission approved the marketing authorization for Abbott's FreeStyle Libre 3 system, a continuous glucose monitoring system, enabling millions of people with diabetes in Europe to manage their condition more effectively and conveniently (Abbott Press Release).
Dive into Technavio’s robust research methodology, blending expert interviews, extensive data synthesis, and validated models for unparalleled Healthcare Consumables Market insights. See full methodology.
|
Market Scope |
|
|
Report Coverage |
Details |
|
Page number |
221 |
|
Base year |
2024 |
|
Historic period |
2019-2023 |
|
Forecast period |
2025-2029 |
|
Growth momentum & CAGR |
Accelerate at a CAGR of 5.1% |
|
Market growth 2025-2029 |
USD 42.7 billion |
|
Market structure |
Fragmented |
|
YoY growth 2024-2025(%) |
4.9 |
|
Key countries |
US, China, UK, Germany, India, Canada, France, Japan, South Korea, and Australia |
|
Competitive landscape |
Leading Companies, Market Positioning of Companies, Competitive Strategies, and Industry Risks |
Research Analyst Overview
- The market demonstrates a continuous and evolving nature, driven by advancements in medical technology and the growing demand for efficient and effective solutions across various sectors. In-vitro diagnostic devices, for instance, have seen significant growth due to their ability to provide accurate results in real-time, enabling faster and more informed treatment decisions. Moreover, patient monitoring equipment, such as electrocardiogram electrodes and surgical instrument sterilization solutions, play a crucial role in ensuring optimal patient care and safety. The syringe manufacturing process, for example, has undergone substantial changes with the introduction of new materials and technologies, leading to improved safety and functionality.
- Anesthesia equipment maintenance and endoscope cleaning solutions are other critical areas of focus, as healthcare facilities strive to maintain high standards of infection control. Reusable medical equipment, including hospital bedding textiles and surgical drapes materials, are being replaced with more advanced disposable alternatives to minimize the risk of cross-contamination. The market for pharmaceutical packaging materials and pharmacy dispensing systems is also expanding, driven by the increasing prevalence of specialty drugs and the need for secure and efficient drug delivery systems. Medical waste management, including biohazard waste disposal, is another area of significant growth, as healthcare facilities prioritize compliance with stringent regulations.
- According to industry reports, the market is expected to grow at a robust rate in the coming years, with a substantial increase in demand for intravenous solutions, catheter materials, and disposable gloves materials. For instance, the global market for disposable gloves is projected to reach USD34.4 billion by 2027, growing at a CAGR of 8.5% during the forecast period. A notable example of market dynamism can be seen in the adoption of advanced sterile processing techniques for surgical instruments, which has led to a significant reduction in surgical site infections. By implementing these techniques, a leading hospital was able to reduce its infection rate by 50% within a year, saving thousands of dollars in additional costs and improving patient outcomes.
What are the Key Data Covered in this Healthcare Consumables Market Research and Growth Report?
-
What is the expected growth of the Healthcare Consumables Market between 2025 and 2029?
-
USD 42.7 billion, at a CAGR of 5.1%
-
-
What segmentation does the market report cover?
-
The report is segmented by Type (Medical consumables, Wound care consumables, Diagnostic consumables, Personal protective equipment, and Others), End-user (Hospitals and clinics, Diagnostic laboratories, Home care, and Research and academic institutes), and Geography (North America, Europe, Asia, and Rest of World (ROW))
-
-
Which regions are analyzed in the report?
-
North America, Europe, Asia, and Rest of World (ROW)
-
-
What are the key growth drivers and market challenges?
-
Increasing prevalence of chronic diseases, Stringent regulatory compliance requirements
-
-
Who are the major players in the Healthcare Consumables Market?
-
3M Co., Ansell Ltd., Avanos Medical Inc., Avery Dennison Corp., B.Braun SE, Baxter International Inc., Becton Dickinson and Co., Cardinal Health Inc., Coloplast AS, ConvaTec Group Plc, Cook Group Inc., Hollister Inc., Johnson and Johnson, Kimberly Clark Corp., Medline Industries LP, Medtronic Plc, Smith and Nephew plc, Teleflex Inc., Terumo Corp., and Thermo Fisher Scientific Inc.
-
Market Research Insights
- The market is a dynamic and ever-evolving industry, with ongoing advancements in technology and regulations driving continuous growth. According to industry reports, the market is projected to expand by over 5% annually in the coming years. One notable trend in the market is the increasing focus on risk management strategies to ensure product sterilization validation and maintain disinfection efficacy testing. For instance, a recent study demonstrated a 30% reduction in healthcare-associated infections through rigorous implementation of patient safety protocols and aseptic techniques. Another significant aspect of the market is the emphasis on regulatory compliance standards, such as those related to product labeling requirements, supply chain traceability, and quality assurance programs.
- These initiatives aim to improve material durability testing, material biocompatibility, and bioburden reduction methods, ultimately enhancing patient safety and infection prevention strategies. Moreover, there is a growing concern for personnel protection, product shelf life, and infection control training. Equipment calibration protocols, waste segregation guidelines, inventory management systems, and environmental monitoring are also crucial components of the market. Medical device reprocessing and performance monitoring indicators are essential aspects of the industry, with sterility assurance levels and infection prevention strategies playing a vital role in maintaining the highest standards of care. Overall, the market is a critical sector that continues to adapt and innovate to meet the evolving needs of healthcare providers and patients.
We can help! Our analysts can customize this healthcare consumables market research report to meet your requirements.