Hearing Devices Market Size 2024-2028
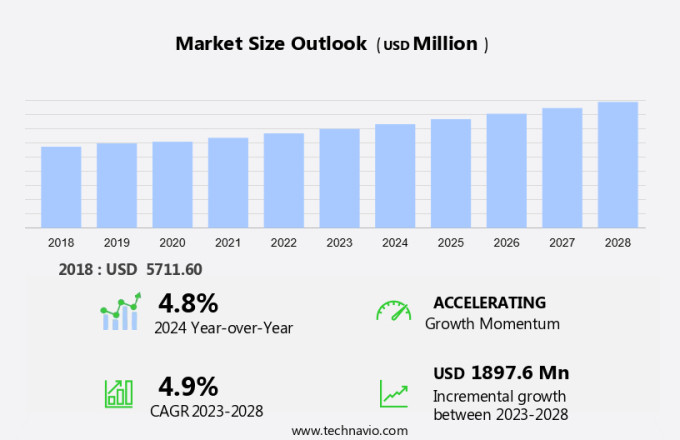
The hearing devices market size is forecast to increase by USD 1.9 billion, at a CAGR of 4.9% between 2023 and 2028.
- The market is experiencing significant growth, driven primarily by the increasing geriatric population. As the global population ages, the prevalence of hearing loss is on the rise, creating a substantial demand for hearing devices. Another key trend shaping the market is the integration of Artificial Intelligence (AI) technology and the integration of advanced technologies, such as sound processing algorithms, into hearing aids. Advanced AI capabilities are enhancing the functionality of hearing devices, offering users improved sound quality and personalized listening experiences. However, the market also faces challenges, with regulatory hurdles posing a significant obstacle.
- Stringent regulations and approval processes can delay product launches and increase development costs. Companies must navigate these challenges to effectively capitalize on market opportunities and maintain a competitive edge. To succeed, they must focus on innovation, regulatory compliance, and meeting the evolving needs of an aging population.
What will be the Size of the Hearing Devices Market during the forecast period?
Explore in-depth regional segment analysis with market size data - historical 2018-2022 and forecasts 2024-2028 - in the full report.
Request Free Sample
The market continues to evolve, with innovations in technology driving advancements in various sectors. Directional microphones and digital signal processing enhance sound localization and speech-in-noise perception, while gain adjustment parameters allow for customized amplification. Behind-the-ear hearing aids offer increased power and patient comfort features, such as feedback cancellation systems. Auditory brainstem implants and cochlear implants cater to severe hearing loss, with canal hearing aids providing a discreet alternative. Microphone technology advancements enable improved noise reduction algorithms and tinnitus management features. Speech processor design focuses on enhancing auditory processing disorder and speech recognition capabilities. Incorporating advanced features like wireless connectivity options, telecoil functionality, and rechargeable battery technology, hearing aids continue to adapt to the evolving needs of users.
Ongoing research in bone conduction hearing, electroacoustic stimulation, and open-fit hearing aids further expands the market's reach. Audiological evaluation methods, including frequency response curve assessments, ensure accurate hearing loss diagnosis and effective treatment solutions.
How is this Hearing Devices Industry segmented?
The hearing devices industry research report provides comprehensive data (region-wise segment analysis), with forecasts and estimates in "USD million" for the period 2024-2028, as well as historical data from 2018-2022 for the following segments.
- Product Type
- Hearing aids
- Assistive listening devices (ALDs)
- Technology
- Digital
- Wireless
- Rechargeable
- Over-the-counter (OTC)
- Analog
- Geography
- North America
- US
- Canada
- Europe
- France
- Germany
- Italy
- Spain
- UK
- APAC
- China
- India
- Japan
- Rest of World (ROW)
- North America
By Product Type Insights
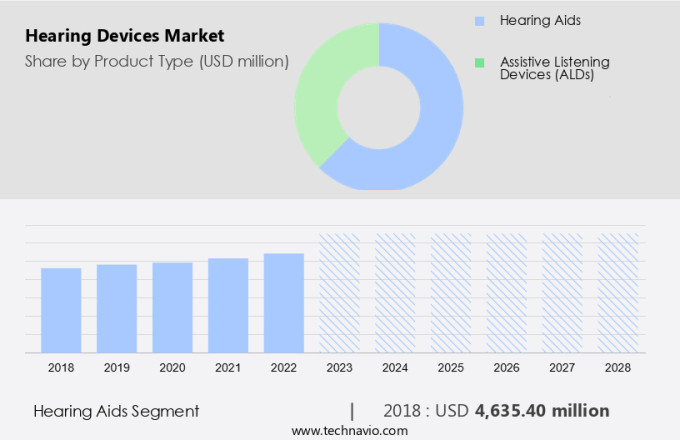
The hearing aids segment is estimated to witness significant growth during the forecast period.
Hearing aids represent a substantial segment of the market, catering to individuals with hearing impairments. These devices, available as in-the-ear or behind-the-ear models, employ advanced technologies to enhance sound amplification and speech comprehension. In-the-ear hearing aids come with tinnitus management features, noise reduction algorithms, and directional microphones, ensuring optimal hearing experience. Middle ear implants and cochlear implants offer more invasive solutions for severe hearing loss. Speech processor design plays a crucial role in enhancing speech perception, especially in noisy environments. Patient comfort features, such as feedback cancellation systems and rechargeable battery technology, ensure user convenience. Digital signal processing, microphone technology, and audiological evaluation methods contribute to the devices' effectiveness.
Bone conduction hearing and hearing aid amplification are alternative solutions for certain types of hearing loss. Advanced technologies like acoustic feedback reduction, wireless connectivity options, and electroacoustic stimulation further enhance user experience. Telecoil functionality and open-fit hearing aids cater to specific user needs. Frequency response curves are essential in understanding the hearing aid's ability to amplify different frequencies. Auditory processing disorder and sound localization improvement are addressed through various design innovations. Completely-in-canal hearing aids and canal hearing aids offer discreet options for users. Microphone technology and digital signal processing are at the heart of these devices, ensuring clear sound amplification and effective noise reduction.
Speech-in-noise perception and gain adjustment parameters are critical factors in improving overall performance. Market trends include the integration of advanced features like directional microphones, wireless connectivity, and telecoil functionality to cater to diverse user needs.
The Hearing aids segment was valued at USD 4.64 billion in 2018 and showed a gradual increase during the forecast period.
Regional Analysis
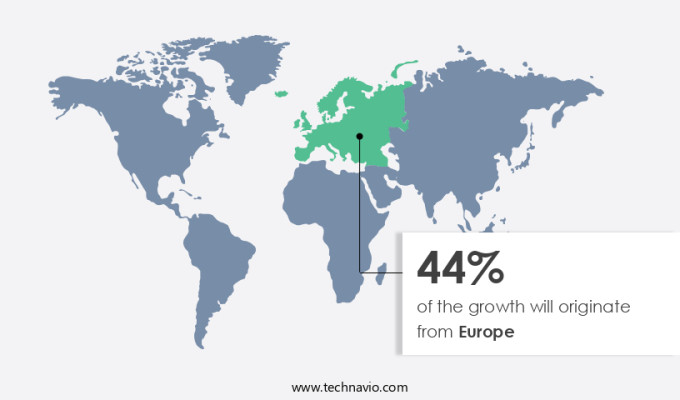
Europe is estimated to contribute 44% to the growth of the global market during the forecast period. Technavio's analysts have elaborately explained the regional trends and drivers that shape the market during the forecast period.
The European market is experiencing significant growth due to a high prevalence of hearing loss and a strong focus on healthcare innovation. In September 2024, Phonak introduced its Phonak Infinio hearing devices portfolio in the UK, showcasing a commitment to providing advanced hearing solutions. With 1 in 6 adults in the UK experiencing hearing impairment, the need for effective hearing solutions, particularly for the aging population of 8 million individuals aged 60 and above, is increasingly apparent. In-the-ear hearing aids, equipped with tinnitus management features and noise reduction algorithms, cater to those with specific hearing needs.
Middle ear implants and cochlear implant technology offer more invasive solutions for severe hearing loss. Speech processor design and patient comfort features prioritize user experience, while feedback cancellation systems and directional microphones enhance speech perception in noisy environments. Hearing loss assessment and audiological evaluation methods ensure accurate diagnosis, and digital signal processing and microphone technology improve sound quality. Bone conduction hearing and hearing aid amplification cater to various hearing loss types, while completely-in-canal hearing aids and open-fit hearing aids offer discreet options. Auditory processing disorder and acoustic feedback reduction technologies address additional hearing challenges. Wireless connectivity options, electroacoustic stimulation, and telecoil functionality offer convenience and enhanced functionality.
Rechargeable battery technology ensures long-lasting use and reduces the need for frequent battery replacements. The market is driven by advancements in digital signal processing, microphone technology, and user-friendly features, making hearing devices more accessible and effective for individuals with hearing impairments.
Market Dynamics
Our researchers analyzed the data with 2023 as the base year, along with the key drivers, trends, and challenges. A holistic analysis of drivers will help companies refine their marketing strategies to gain a competitive advantage.
What are the key market drivers leading to the rise in the adoption of Hearing Devices Industry?
- The geriatric population's continuous growth serves as the primary market driver.
- The market experiences steady growth due to the increasing population of older adults. According to World Bank data, the number of individuals aged 65 and above in the US and India has risen by approximately 6% and 5.5%, respectively, between 2021 and 2023. This demographic shift highlights the growing demand for hearing solutions, as age-related hearing loss is prevalent among older adults. In response, manufacturers focus on advanced technologies to cater to this market. In-the-ear hearing aids, for instance, offer tinnitus management features, noise reduction algorithms, and patient comfort features.
- Speech processor design and feedback cancellation systems further enhance speech-in-noise perception. Middle ear implants represent another promising area of innovation, offering harmonious sound experiences. Overall, the market continues to evolve, driven by technological advancements and the increasing need to address age-related hearing loss.
What are the market trends shaping the Hearing Devices Industry?
- The integration of artificial intelligence (AI) is a significant market trend that is mandated for businesses seeking to remain competitive and efficient. By implementing AI technologies, organizations can automate routine tasks, enhance decision-making processes, and improve overall productivity.
- The market is experiencing notable advancements, with artificial intelligence (AI) integration becoming a significant trend. In August 2024, Sonova Holding AG introduced two groundbreaking hearing aids under its Phonak brand: Audéo Infinio and Audéo Sphere Infinio. These devices, built on advanced AI-based technology platforms, represent industry innovations. The Audeo Sphere Infinio, in particular, utilizes Sonova's proprietary dual-chip technology, dedicating one chip to real-time AI sound processing. This technology allows the device to adapt dynamically to various auditory environments, ensuring users experience superior sound quality.
- Furthermore, directional microphones and gain adjustment parameters are integral components of these hearing aids, enhancing the overall listening experience. Canal hearing aids and behind-the-ear models continue to benefit from digital signal processing and microphone technology advancements, catering to diverse hearing loss assessment needs. The integration of AI in hearing devices is revolutionizing the industry, offering users personalized and immersive sound experiences.
What challenges does the Hearing Devices Industry face during its growth?
- The growth of the industry is significantly impeded by regulatory hurdles, which present a formidable challenge that must be addressed by industry professionals.
- The market is subject to rigorous regulatory oversight, with the Food and Drug Administration (FDA) setting stringent guidelines in the US. As of 2023, FDA regulations mandate detailed labeling requirements for hearing aids, ensuring consumers and dispensers have crucial information for safe and effective use. These devices, as electronic products, must adhere to the FDC Act and FDA regulations. Labeling is paramount, as it discloses potential health risks and aids in proper hearing aid application. The FDA's OTC hearing aid regulations, outlined in 21 CFR 800, further emphasize the importance of accurate labeling.
- By providing clear, concise, and essential information, these regulations promote improved sound localization, enhance audiological evaluation methods, and reduce acoustic feedback. Additionally, advancements in technology, such as bone conduction hearing, cochlear implant technology, and completely-in-canal hearing aids, cater to various auditory needs, including those with auditory processing disorders.
Exclusive Customer Landscape
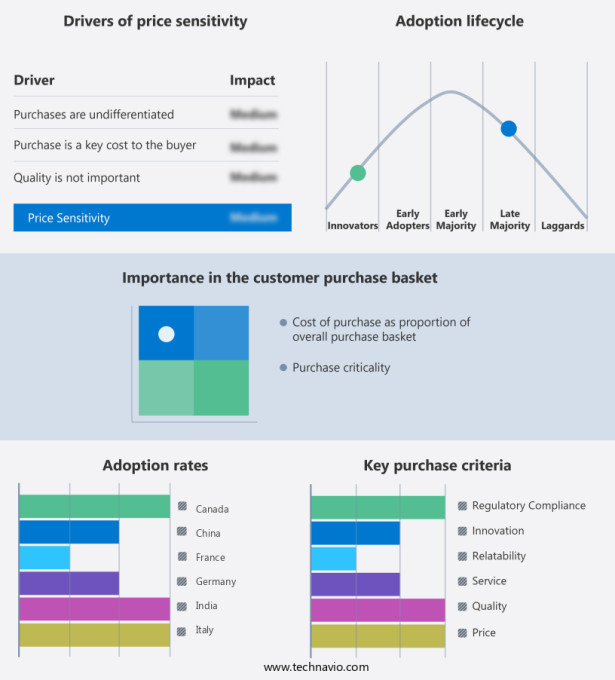
The hearing devices market forecasting report includes the adoption lifecycle of the market, covering from the innovator's stage to the laggard's stage. It focuses on adoption rates in different regions based on penetration. Furthermore, the hearing devices market report also includes key purchase criteria and drivers of price sensitivity to help companies evaluate and develop their market growth analysis strategies.
Customer Landscape
Key Companies & Market Insights
Companies are implementing various strategies, such as strategic alliances, hearing devices market forecast, partnerships, mergers and acquisitions, geographical expansion, and product/service launches, to enhance their presence in the industry.
Amplifon SpA - This company specializes in advanced hearing solutions, featuring Behind-the-Ear (BTE), Receiver-in-the-Ear (RITE), and In-the-Ear (ITE) styles.
The industry research and growth report includes detailed analyses of the competitive landscape of the market and information about key companies, including:
- Amplifon SpA
- Audicus Inc.
- Beltone
- Cochlear Ltd.
- Demant AS
- Eargo Inc
- GN Hearing AS
- HearingLife
- Knowles Corp.
- MED EL Medical Electronics.
- Onkyo Corp.
- Oticon
- Otofonix Hearing Solutions
- Phonak ltd.
- Sivantos Pte. Ltd
- Sonova AG
- Starkey Laboratories Inc.
- WS Audiology AS
Qualitative and quantitative analysis of companies has been conducted to help clients understand the wider business environment as well as the strengths and weaknesses of key industry players. Data is qualitatively analyzed to categorize companies as pure play, category-focused, industry-focused, and diversified; it is quantitatively analyzed to categorize companies as dominant, leading, strong, tentative, and weak.
Recent Development and News in Hearing Devices Market
- In January 2024, Sonova Holding AG, a leading provider of hearing solutions, announced the launch of its new Phonak Marvel hearing aids featuring Bluetooth connectivity and artificial intelligence capabilities, according to a company press release. This innovation allows users to stream phone calls, music, and other media directly to their hearing aids.
- In March 2024, Starkey Hearing Technologies, another major player in the market, entered into a strategic partnership with Google to integrate Google Assistant into their hearing aids, as reported by Reuters. This collaboration enables users to access various Google services and control their hearing aids using voice commands.
- In May 2024, Cochlear Limited, a global leader in implantable hearing solutions, secured approval from the U.S. Food and Drug Administration (FDA) for its new Nucleus 7 Sound Processor, which features advanced wireless connectivity and improved battery life, according to a company press release.
- In April 2025, GN Store Nord A/S, a Danish hearing aid manufacturer, announced a significant investment of USD 200 million in its ReSound division to expand its production capacity and accelerate research and development efforts, as reported by Bloomberg. This investment aims to strengthen GN Store Nord's position in the competitive market.
Research Analyst Overview
- The market encompasses a range of technologies, from sound amplifiers to surgical implants, catering to diverse patient candidacy criteria. Advanced hearing aids integrate data logging capabilities, enabling real-time analysis of user behavior and device performance. Sound amplifier circuits and assistive listening devices amplify sound, while wind noise reduction and environmental noise filtering ensure optimal listening experiences. Smartphone app integration and automatic gain control enhance user convenience. Surgical implantation techniques, such as cochlear implants, employ multi-channel processing, speech enhancement techniques, and implant electrode design for effective sound transmission. Audiogram interpretation and rehabilitation strategies are crucial components of the market, ensuring proper device fitting and patient satisfaction.
- Biocompatibility testing, signal compression methods, and remote control operation are essential considerations for manufacturers, ensuring the devices are safe, efficient, and user-friendly. Bluetooth connectivity and binaural hearing systems offer advanced features for improved hearing performance, catering to the evolving needs of the US business audience.
Dive into Technavio's robust research methodology, blending expert interviews, extensive data synthesis, and validated models for unparalleled Hearing Devices Market insights. See full methodology.
|
Market Scope |
|
|
Report Coverage |
Details |
|
Page number |
201 |
|
Base year |
2023 |
|
Historic period |
2018-2022 |
|
Forecast period |
2024-2028 |
|
Growth momentum & CAGR |
Accelerate at a CAGR of 4.9% |
|
Market growth 2024-2028 |
USD 1897.6 million |
|
Market structure |
Fragmented |
|
YoY growth 2023-2024(%) |
4.8 |
|
Key countries |
US, Germany, France, UK, China, Italy, Spain, Japan, Canada, and India |
|
Competitive landscape |
Leading Companies, Market Positioning of Companies, Competitive Strategies, and Industry Risks |
What are the Key Data Covered in this Hearing Devices Market Research and Growth Report?
- CAGR of the Hearing Devices industry during the forecast period
- Detailed information on factors that will drive the growth and forecasting between 2024 and 2028
- Precise estimation of the size of the market and its contribution of the industry in focus to the parent market
- Accurate predictions about upcoming growth and trends and changes in consumer behaviour
- Growth of the market across Europe, North America, Asia, and Rest of World (ROW)
- Thorough analysis of the market's competitive landscape and detailed information about companies
- Comprehensive analysis of factors that will challenge the hearing devices market growth of industry companies
We can help! Our analysts can customize this hearing devices market research report to meet your requirements.


