
Idiopathic Pulmonary Fibrosis Market Size 2025-2029
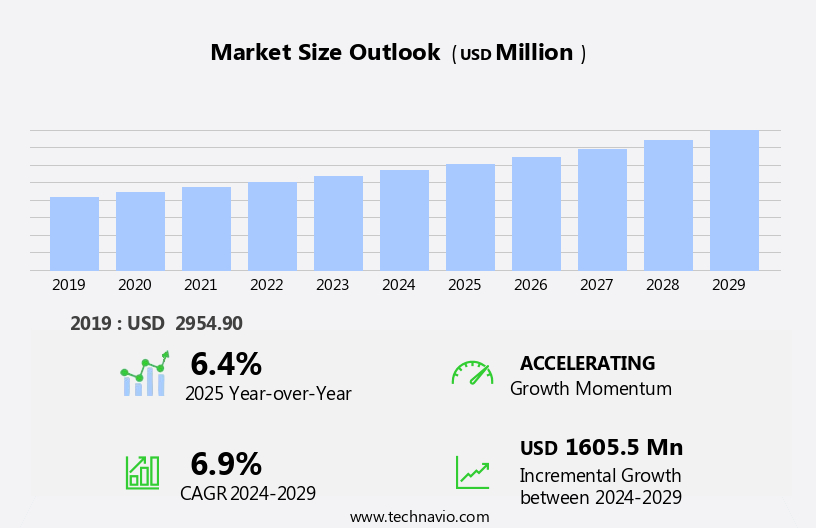
The idiopathic pulmonary fibrosis market size is forecast to increase by USD 1.61 billion, at a CAGR of 6.9% between 2024 and 2029.
- Increasing prevalence of respiratory diseases is the key driver of the idiopathic pulmonary fibrosis market. AstraZeneca Plc is a key player, offering idiopathic pulmonary fibrosis drugs such as saracatinib. This medication targets specific pathways involved in the progression of the disease, helping to slow its advancement. As the incidence of respiratory disorders rises, AstraZeneca's innovative treatments contribute to the growing demand for effective therapies in managing idiopathic pulmonary fibrosis. The respiratory drugs segment is expected to dominate the market, as these medications play a crucial role in managing symptoms and improving patient outcomes. Additionally, the medical diagnostics and patient monitoring segments are gaining traction, as early and accurate diagnosis of IPF is essential for effective treatment.
What will be the Size of the Idiopathic Pulmonary Fibrosis Market During the Forecast Period?
- The market encompasses diagnostic technologies, treatment options, and therapeutic approaches aimed at addressing this chronic lung disease characterized by impaired lung function and respiratory difficulties. The market's growth is driven by the increasing prevalence of IPF, which affects approximately 50,000 Americans, and the need for effective treatments to improve patient outcomes and enhance quality of life. Antifibrotic agents, such as pirfenidone and nintedanib, represent the primary therapeutic class, while immunosuppressants and targeted therapies are also under investigation. Diagnostic services, hospital pharmacies, retail pharmacies, and online providers play essential roles In the application of medical care for IPF patients. Multidisciplinary care teams in hospitals and clinics provide comprehensive treatment plans, ensuring the best possible care for those affected by this debilitating condition.
How is this Idiopathic Pulmonary Fibrosis Industry segmented and which is the largest segment?
The IPF industry research report provides comprehensive data (region-wise segment analysis), with forecasts and estimates in "USD billion" for the period 2025-2029, as well as historical data from 2019-2023 for the following segments.
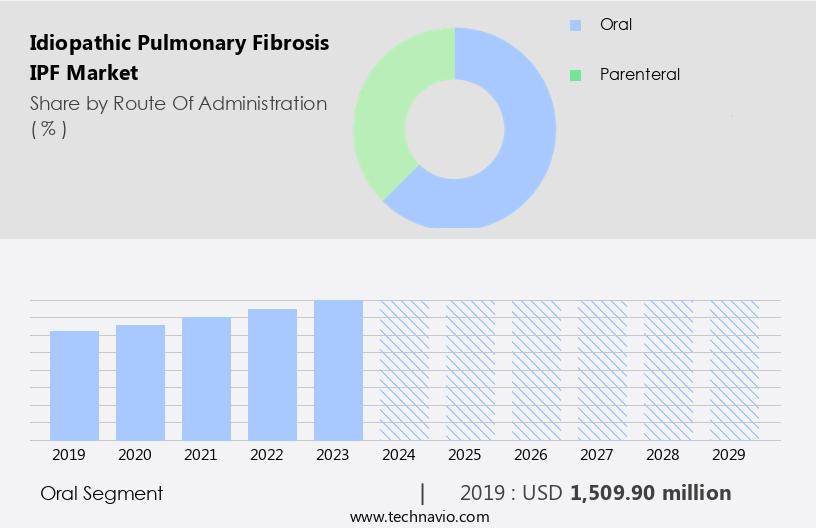
- Route Of Administration
- Oral
- Parenteral
- Drug Class
- Systemic corticosteroids
- Immunosuppressants
- Tyrosine kinase inhibitors
- Anti-fibrotic agents
- Distribution Channel
- Hospital pharmacies
- Retail pharmacies
- Online pharmacies
- Geography
- North America
- Canada
- Mexico
- US
- Europe
- Germany
- UK
- France
- Italy
- Asia
- China
- Japan
- Rest of World (ROW)
- North America
By Route Of Administration Insights
The oral segment is estimated to witness significant growth during the forecast period. The oral route of administration of drugs for most indications, including IPF, is one of the easiest, most convenient, and non-invasive methods of delivering medication to the body. Since it can be administered at home and is the most patient-friendly, this route is preferred by the majority of patients. Various dosage forms for oral medications are available, including tablets, capsules, and liquid solutions that can be ingested. The benefit of taking medications orally is that one can easily self-administer them and change the dosage if necessary. Additionally, compared to other routes of administration, oral medications have a longer half-life, which means that their effects may last longer.
Oral drug delivery also does away with the need for intravenous injections or inhalable drugs, which can be uncomfortable and challenging for some patients. The benefit of taking medications orally is that one can easily self-administer them and change the dosage if necessary. Additionally, compared to other routes of administration, oral medications have a longer half-life, which means that their effects may last longer. Oral drug delivery also does away with the need for intravenous injections or inhalable drugs, which can be uncomfortable and challenging for some patients.
Get a glance at the share of various segments. Request Free Sample
The oral segment was valued at USD 1.51 billion in 2019 and showed a gradual increase during the forecast period.
Regional Analysis
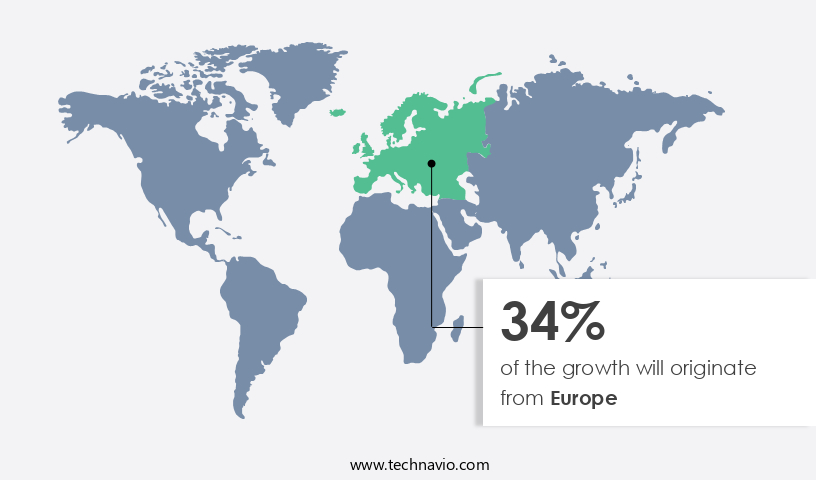
Europe is estimated to contribute 34% to the growth of the global market during the forecast period. Technavio's analysts have elaborately explained the regional trends and drivers that shape the market during the forecast period.
For more insights on the market share of various regions, Request Free Sample
Another region offering significant growth opportunities to companies is North America. The market in North America is projected to expand due to the increasing prevalence of chronic lung disorders, particularly IPF, among the geriatric population. Impaired lung function and respiratory difficulties associated with IPF necessitate diagnostic technologies and therapeutic approaches, driving market growth. Antifibrotic agents, such as pirfenidone and nintedanib, and immunosuppressants are common treatment options. Targeted therapies are emerging as promising trends in IPF treatment.
in addition, multidisciplinary care teams, including hospitals and clinics, pharmacies (hospital and retail), and online providers, provide medical care and diagnostic services for IPF patients. Reimbursement policies, economic development, and healthcare spending also influence market dynamics. Patient outcomes and quality of life are key considerations in IPF treatment, making personalized treatment options and telemedicine solutions increasingly important. The growing need for effective IPF management in outpatient settings underscores the importance of continued medical research and drug development for this chronic disorder.
Market Dynamics
Our researchers analyzed the data with 2024 as the base year, along with the key drivers, trends, and challenges. A holistic analysis of drivers will help companies refine their marketing strategies to gain a competitive advantage.
What are the key market drivers leading to the rise In the adoption of Idiopathic Pulmonary Fibrosis (IPF) Industry?
Increasing prevalence of respiratory diseases is the key driver of the market.
- Idiopathic Pulmonary Fibrosis (IPF) is a chronic and progressive lung disorder that impairs lung function, resulting in respiratory difficulties and decreased quality of life. The global prevalence of IPF has been increasing, posing a significant challenge for healthcare providers and medical research. This debilitating disease affects thousands of people worldwide, with a higher incidence among the geriatric population. The primary cause of IPF is the scarring of lung tissue, which impedes the efficient transport of oxygen to the bloodstream. Diagnostic technologies play a crucial role in identifying IPF, and various diagnostic procedures, such as high-resolution computed tomography (HRCT) scans and lung function tests, are used to diagnose the condition.
- Once diagnosed, treatment options include antifibrotic agents like Pirfenidone and Nintedanib, immunosuppressants, and targeted therapies. The application of multidisciplinary care teams in outpatient settings is a promising trend in IPF treatment. These teams consist of healthcare professionals, including pulmonologists, nurses, and pharmacists, who work together to manage patient care. Reimbursement policies and economic development also impact patient footfall in hospitals and clinics, retail pharmacies, and online providers. Medical care and diagnostic services are essential components of IPF management. Patients require ongoing treatment and monitoring to manage their symptoms and improve their quality of life. The development of personalized treatment options and telemedicine solutions is a significant advancement in IPF care.
What are the market trends shaping the Idiopathic Pulmonary Fibrosis (IPF) Industry?
An increase in drug pipeline for IPF is the upcoming market trend.
- Idiopathic Pulmonary Fibrosis (IPF) is a chronic and debilitating lung disease characterized by impaired lung function and respiratory difficulties. The disease causes scarring of the lung tissue, leading to reduced lung capacity and breathing difficulties. The pipeline for IPF treatments is expanding due to the growing patient population and the need for effective therapeutic approaches. Antifibrotic agents, such as Pirfenidone (Esbriet), are currently used to slow down the progression of IPF. Immunosuppressants and targeted therapies are also under investigation. Diagnostic technologies play a crucial role In the accurate identification and diagnosis of IPF, and multidisciplinary care teams are essential for optimal patient outcomes and quality of life.
- The application of medical care, diagnostic services, and treatment in outpatient settings, hospitals, and clinics is vital for managing IPF. Reimbursement policies and economic development also impact patient footfall and healthcare spending. The geriatric population is disproportionately affected by IPF, making medical research and drug development a priority. Telemedicine solutions and diagnostic procedures are promising trends in IPF care, offering convenience and accessibility for patients. Overall, the IPF market is dynamic, with numerous diagnostic, treatment, and therapeutic approaches under development to improve patient outcomes and address the challenges of this chronic condition.
What challenges does the Idiopathic Pulmonary Fibrosis (IPF) Industry face during its growth?
The high cost of conducting clinical trials on IPF therapeutics is a key challenge affecting the industry growth.
- Idiopathic Pulmonary Fibrosis (IPF) is a chronic lung disease characterized by impaired lung function and respiratory difficulties. Diagnostic technologies play a crucial role in identifying IPF, and early diagnosis is essential for effective treatment. Treatment options for IPF include antifibrotic agents like Pirfenidone and Nintedanib, immunosuppressants, and targeted therapies. Multidisciplinary care teams in hospitals and clinics, outpatient settings, and pharmacies provide the application of medical care and diagnostic services. Patient footfall in hospital and retail pharmacies and online providers is increasing due to the need for ongoing treatment and management of IPF. Reimbursement policies and economic development influence healthcare spending on IPF treatment.
- The geriatric population is disproportionately affected by IPF, making medical research and drug development a promising trend. Financial barriers to accessing specialized medical care and diagnostic procedures can impact patient outcomes and quality of life. Telemedicine solutions and outpatient facilities offer potential solutions to address these challenges. Treatment for IPF is complex and costly due to the need for large patient populations and long-term follow-up periods in clinical trials. Ensuring the accuracy and relevance of research requires a focus on recruiting eligible IPF patients, making recruitment a significant challenge.
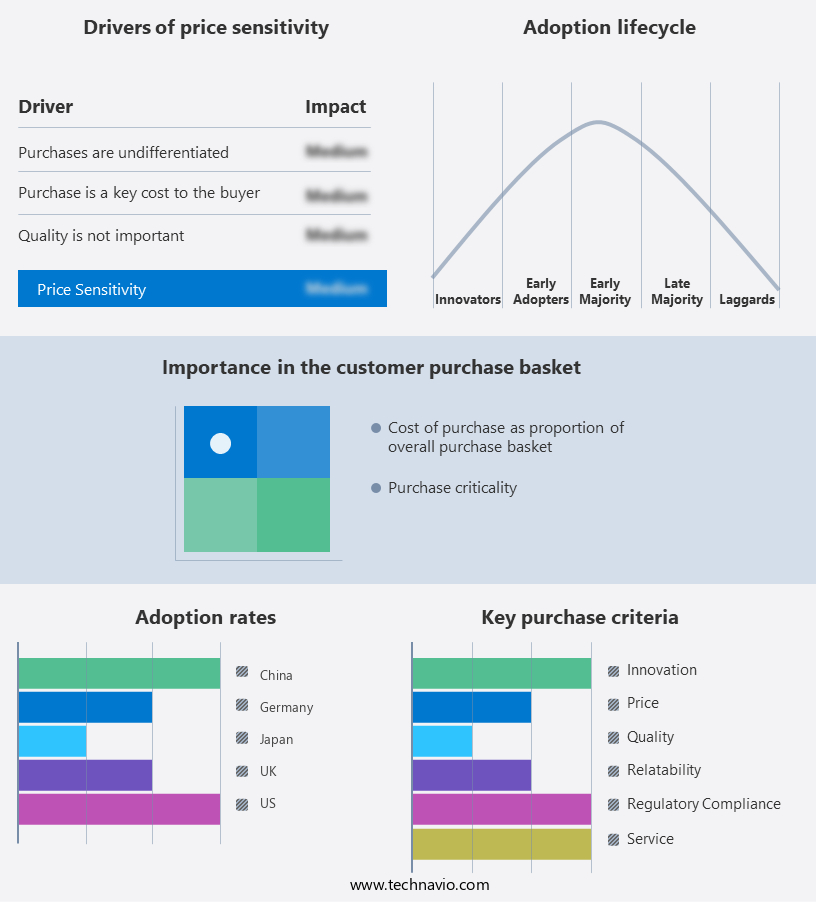
Exclusive Customer Landscape
The idiopathic pulmonary fibrosis (IPF) market forecasting report includes the adoption lifecycle of the market, covering from the innovator's stage to the laggard's stage. It focuses on adoption rates in different regions based on penetration. Furthermore, the idiopathic pulmonary fibrosis (IPF) market report also includes key purchase criteria and drivers of price sensitivity to help companies evaluate and develop their market growth analysis strategies.
Customer Landscape
Key Companies & Market Insights
Companies are implementing various strategies, such as strategic alliances, idiopathic pulmonary fibrosis (IPF) market forecast, partnerships, mergers and acquisitions, geographical expansion, and product/service launches, to enhance their presence In the industry.
AstraZeneca Plc - The company offers idiopathic pulmonary fibrosis drugs such as saracatinib.
The industry research and growth report includes detailed analyses of the competitive landscape of the market and information about key companies, including:
- Alembic Pharmaceuticals Ltd.
- Boehringer Ingelheim International GmbH
- Bristol Myers Squibb Co.
- Celix Pharma Ltd.
- Cipla Inc.
- Daewoong Pharmaceutical Co. Ltd.
- F. Hoffmann La Roche Ltd.
- FibroGen Inc.
- Galapagos NV
- Galecto Inc.
- GNI Group Ltd.
- Horizon Therapeutics Plc
- Intas Pharmaceuticals Ltd.
- Jubilant Pharmova Ltd.
- MediciNova Inc.
- Merck and Co. Inc.
- Mission Therapeutics
- Novartis AG
- SHIONOGI Co. Ltd.
- United Therapeutics Corp.
Qualitative and quantitative analysis of companies has been conducted to help clients understand the wider business environment as well as the strengths and weaknesses of key industry players. Data is qualitatively analyzed to categorize companies as pure play, category-focused, industry-focused, and diversified; it is quantitatively analyzed to categorize companies as dominant, leading, strong, tentative, and weak.
Research Analyst Overview
Idiopathic Pulmonary Fibrosis (IPF) is a chronic lung disorder that causes progressive fibrosis, or scarring, of the lungs, making it difficult for patients to breathe. Diagnosing IPF involves various technologies such as chest X-rays, CT scans, and pulmonary function tests, which help assess lung damage and determine treatment options. Treatment focuses on symptom management and slowing disease progression, with antifibrotic agents like pirfenidone and nintedanib being commonly used. Patients typically receive care from a multidisciplinary team of specialists, and treatment can be accessed in hospitals, clinics, and through telemedicine.
In addition, the economic burden of IPF is significant due to high diagnostic and treatment costs, with reimbursement policies playing a key role in patient access to care. The aging population is particularly affected, increasing outpatient visits, and telemedicine has emerged as a way to alleviate some of these pressures. Ongoing medical research is paving the way for personalized treatment approaches tailored to individual patient needs, optimizing outcomes. IPF requires a comprehensive approach to diagnosis, treatment, and care delivery.
|
Market Scope |
|
|
Report Coverage |
Details |
|
Page number |
218 |
|
Base year |
2024 |
|
Historic period |
2019-2023 |
|
Forecast period |
2025-2029 |
|
Growth momentum & CAGR |
Accelerate at a CAGR of 6.9% |
|
Market growth 2025-2029 |
USD 1.61 billion |
|
Market structure |
Fragmented |
|
YoY growth 2024-2025(%) |
6.4 |
|
Key countries |
US, Canada, China, Japan, Germany, UK, Mexico, France, Brazil, and Italy |
|
Competitive landscape |
Leading Companies, Market Positioning of Companies, Competitive Strategies, and Industry Risks |
What are the Key Data Covered in this Idiopathic Pulmonary Fibrosis (IPF) Market Research and Growth Report?
- CAGR of the Idiopathic Pulmonary Fibrosis (IPF) industry during the forecast period
- Detailed information on factors that will drive the market growth and forecasting between 2025 and 2029
- Precise estimation of the size of the market and its contribution of the industry in focus to the parent market
- Accurate predictions about upcoming growth and trends and changes in consumer behaviour
- Growth of the market across North America, Europe, Asia, and Rest of World (ROW)
- Thorough analysis of the market's competitive landscape and detailed information about companies
- Comprehensive analysis of factors that will challenge the idiopathic pulmonary fibrosis (ipf) market growth of industry companies
We can help! Our analysts can customize this idiopathic pulmonary fibrosis (ipf) market research report to meet your requirements.
 RIA -
RIA - 
