
Europe Industrial Control Systems Market Size 2024-2028
The Europe industrial control systems market size is forecast to increase by USD 4.1 million, at a CAGR of 2.8% between 2023 and 2028.
- The market is driven by the increasing need for simplification of complex manufacturing activities. Automation solution providers are capitalizing on this trend by integrating value chains, offering comprehensive solutions that streamline processes and enhance operational efficiency. However, the high initial investment required for implementing these advanced systems poses a significant challenge for market growth. Companies must carefully weigh the long-term benefits against the upfront costs to determine the optimal strategy for adopting industrial control systems.
- Effective cost management and strategic partnerships with solution providers can help mitigate this challenge and enable European businesses to capitalize on the market's potential for innovation and improved productivity.
What will be the size of the Europe Industrial Control Systems Market during the forecast period?

Explore in-depth regional segment analysis with market size data - historical 2018-2022 and forecasts 2024-2028 - in the full report.
Request Free Sample
- The European industrial control systems market is experiencing significant growth, driven by the integration of advanced technologies such as process automation, manufacturing intelligence, and industrial IoT. Real-time data processing and Modbus protocol are key components of process control systems, enabling smart manufacturing and industrial cybersecurity. Digital transformation is a major trend, with AI-powered control systems and industrial cloud solutions gaining popularity. Industrial data management, including historical data and industrial big data, is crucial for system validation and advanced process control.
- Open source software and automated guided vehicles are also shaping the market, while advanced control algorithms and OPC UA ensure system interoperability. Industrial cybersecurity remains a top priority, with remote access and data logging essential for industrial vision systems. Overall, the European industrial control systems market is dynamic and innovative, offering numerous opportunities for businesses seeking to optimize their operations.
How is this market segmented?
The market research report provides comprehensive data (region-wise segment analysis), with forecasts and estimates in "USD million" for the period 2024-2028, as well as historical data from 2018-2022 for the following segments.
- End-user
- Process industries
- Discrete industries
- Geography
- Europe
- France
- Germany
- UK
- Europe
By End-user Insights
The process industries segment is estimated to witness significant growth during the forecast period.
The European industrial control systems market is characterized by the significant adoption of automation solutions in process industries, particularly in oil and gas, power, and food and beverage sectors. Supervisory Control and Data Acquisition (SCADA) systems, programmable logic controllers (PLCs), distributed control systems (DCS), and drives are increasingly utilized in these industries for process optimization, data acquisition, and fault tolerance. In the oil and gas sector, industrial control systems are employed in the midstream sector to monitor spillages and leaks during transportation. The rising number of deep-water oil and gas fields necessitates remote monitoring, driving the demand for automation software.
Industrial automation also plays a crucial role in power systems, ensuring data integrity and process control. Food and beverage industries leverage automation for production planning, energy management, and condition monitoring. Machine vision, predictive analytics, and artificial intelligence are also gaining traction in various industries for process optimization and asset management. Industrial communication networks, such as Industrial Ethernet, enable seamless data exchange between devices and systems, enhancing overall efficiency. Safety standards and industrial security are integral considerations in the implementation of industrial control systems. Emerging trends include the integration of edge computing, digital twin technology, and cloud computing for improved system performance and cost savings.
Industrial robotics and motion control systems are also increasingly being adopted for automating repetitive tasks and improving manufacturing processes. Overall, the European industrial control systems market is witnessing steady growth, driven by the increasing demand for automation, optimization, and connectivity across various industries.
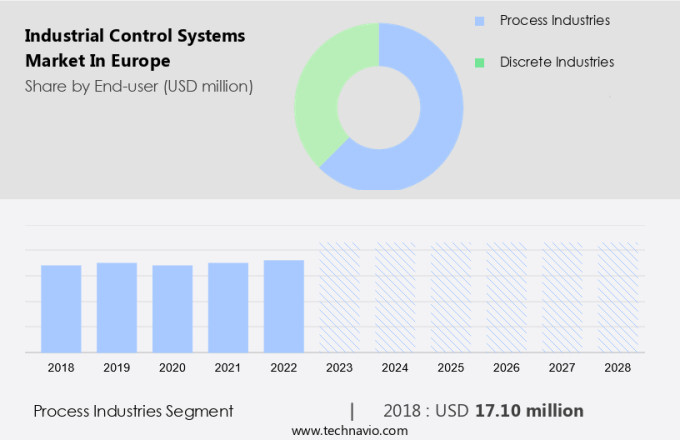
The Process industries segment was valued at USD 17.10 million in 2018 and showed a gradual increase during the forecast period.
Market Dynamics
Our researchers analyzed the data with 2023 as the base year, along with the key drivers, trends, and challenges. A holistic analysis of drivers will help companies refine their marketing strategies to gain a competitive advantage.
What are the Europe Industrial Control Systems Market drivers leading to the rise in adoption of the Industry?
- The necessity of simplifying intricate manufacturing processes serves as the primary market catalyst.
- The market: A Complex Landscape for Asset-Heavy Industries The industrial landscape in Europe has evolved significantly, with production processes becoming increasingly intricate due to the customized nature of various products and the cyclical demand patterns. This complexity is further compounded by the interconnectedness of production equipment, inventory, and support systems in various plants. Asset-intensive industries, such as oil and gas, food and beverage, and water treatment, require advanced tools and mechanisms to manage the intricacies of their production models. Supervisory control systems play a crucial role in ensuring data integrity and process control in these industries. Industrial automation, power systems, data acquisition, and digital twin technologies are essential components of these systems.
- Moreover, industrial robotics and water treatment processes are integral to maintaining production efficiency and ensuring product quality. In the context of water treatment, process control is paramount to ensure the safety and reliability of water supplies. Chemical processing industries, in particular, require stringent process control to ensure product consistency and comply with regulatory requirements. In conclusion, the European Industrial Control Systems Market is a dynamic and complex landscape. It is essential for businesses to invest in robust solutions that can help them manage the intricacies of their production processes while ensuring data integrity and process control. By leveraging advanced technologies such as industrial automation, digital twin, and industrial robotics, businesses can optimize their operations, enhance productivity, and improve overall efficiency.
What are the Europe Industrial Control Systems Market trends shaping the Industry?
- Automation solution providers are increasingly integrating value chains as the latest market trend. This integration enhances efficiency and productivity by streamlining business processes.
- In Europe's industrial control systems market, the automation software segment experienced significant growth over the automation hardware segment in 2023. This trend is driven by the decreasing reliance on hardware and the increasing adoption of software applications, such as building automation, industrial networks, control systems engineering, and automation solutions. Machine vision, process optimization, SCADA systems, artificial intelligence, data analytics, fault tolerance, and asset management are key areas of focus in this market. System integrators play a crucial role in the industrial control systems market, acting as intermediaries between original equipment manufacturers (OEMs) and end-users in both the discrete and process industries.
- By acquiring or collaborating with system integrators, OEMs of automation software and control systems can expand their market reach. This strategic move enables companies to increase their market shares and gain a competitive edge. The integration of software applications and system integrators' extensive geographical reach creates a harmonious and immersive industrial ecosystem. In conclusion, recent research indicates that the European industrial control systems market will continue to prioritize software solutions and strategic partnerships to optimize operations and enhance overall efficiency.
How does Europe Industrial Control Systems Market faces challenges face during its growth?
- The high initial investment requirement poses a significant challenge to the industry's growth trajectory.
- The European industrial control systems market faces a substantial challenge due to the high initial investment required for implementing advanced technologies such as Supervisory Control and Data Acquisition (SCADA), Distributed Control Systems (DCS), and Programmable Logic Controllers (PLC). These solutions demand significant capital outlays for hardware, software, and training. For small and medium-sized enterprises (SMEs), these costs can be a barrier to entry, leading to hesitance in adopting automation solutions. Moreover, continuous maintenance and upgrades of these systems necessitate ongoing investment, further increasing the financial burden. New market entrants must conduct comprehensive analyses of potential returns on investment before making such substantial commitments.
- Advanced industrial software, including safety standards, edge computing, industrial security, industrial sensors, condition monitoring, smart cities, motion control, production planning, and wireless communication, are driving the growth of the market. These technologies offer numerous benefits, including increased efficiency, improved safety, and enhanced productivity. In conclusion, while the European industrial control systems market presents significant opportunities, the high initial investment and ongoing costs remain a challenge, particularly for SMEs. Despite these hurdles, the deployment of advanced technologies, such as those mentioned above, is essential for organizations to remain competitive and maintain a strong market presence.
Exclusive Europe Industrial Control Systems Market Customer Landscape
The market forecasting report includes the adoption lifecycle of the market, covering from the innovator's stage to the laggard's stage. It focuses on adoption rates in different regions based on penetration. Furthermore, the report also includes key purchase criteria and drivers of price sensitivity to help companies evaluate and develop their market growth analysis strategies.

Customer Landscape
Key Companies & Market Insights
Companies are implementing various strategies, such as strategic alliances, market forecast partnerships, mergers and acquisitions, geographical expansion, and product/service launches, to enhance their presence in the market.
The market research and growth report includes detailed analyses of the competitive landscape of the market and information about key companies, including:
- ABB
- Belden Inc.
- Cisco Systems Inc.
- Emerson Electric Co.
- FANUC Corp.
- Fortinet Inc.
- General Electric Co.
- Honeywell International Inc.
- International Business Machines Corp.
- Juniper Networks Inc.
- Kasa Companies Inc.
- Lockheed Martin Corp.
- Mitsubishi Electric Corp.
- OMRON Corp.
- Robert Bosch GmbH
- Rockwell Automation Inc.
- SAP SE
- Schneider Electric SE
- Siemens AG
- Yokogawa Electric Corp.
Qualitative and quantitative analysis of companies has been conducted to help clients understand the wider business environment as well as the strengths and weaknesses of key market players. Data is qualitatively analyzed to categorize companies as pure play, category-focused, industry-focused, and diversified; it is quantitatively analyzed to categorize companies as dominant, leading, strong, tentative, and weak.
Recent Development and News in Industrial Control Systems Market In Europe
- In February 2023, Schneider Electric, a leading energy management and automation company, announced the acquisition of Aventics, a German industrial automation supplier, to expand its portfolio in pneumatic automation and electrification solutions (Schneider Electric Press Release, 2023). This strategic move is expected to strengthen Schneider Electric's position in the European industrial control systems market.
- In May 2024, Siemens and Microsoft entered into a strategic partnership to integrate Microsoft Azure IoT and Siemens' industrial automation and digitalization technologies, aiming to offer advanced industrial IoT solutions to European industries (Microsoft News Center, 2024). This collaboration is expected to drive digital transformation in manufacturing and process industries.
- In October 2024, Honeywell announced the launch of its Forge Advanced Industrial AI, a new AI-powered solution designed to optimize industrial processes and improve energy efficiency in European industries (Honeywell Press Release, 2024). This technological advancement is expected to significantly contribute to the growth of the European industrial control systems market.
Research Analyst Overview
The European industrial control systems market continues to evolve, driven by the ever-evolving needs of various sectors. Building automation solutions are increasingly integrated into industrial structures, optimizing energy consumption and enhancing comfort. Industrial networks facilitate seamless communication between control systems engineering projects, enabling real-time process optimization. Automation solutions, including machine vision and artificial intelligence, drive efficiency and quality in manufacturing processes. SCADA systems ensure supervisory control over critical infrastructure, while data analytics and predictive analytics provide valuable insights for process improvement. Fault tolerance and asset management solutions ensure industrial reliability and minimize downtime. Industrial software, adhering to safety standards, is a crucial component in industrial settings, with edge computing and cloud computing playing essential roles.
Industrial communication networks, including Industrial Ethernet, enable remote monitoring and system integration. Automation standards, such as IEC 61131-3, ensure interoperability and compatibility. The food & beverage sector benefits from wireless communication and industrial security, while industrial sensors and condition monitoring are vital in the oil & gas industry. Smart cities and motion control are gaining traction in urban environments, with production planning and energy management essential in industrial operations. Power systems require data acquisition and digital twin technology for optimal performance. Water treatment and chemical processing rely on advanced industrial automation and process control. Industrial robotics enhance manufacturing capabilities, contributing to the continuous dynamism of the European industrial control systems market.
Dive into Technavio's robust research methodology, blending expert interviews, extensive data synthesis, and validated models for unparalleled Industrial Control Systems Market in Europe insights. See full methodology.
|
Market Scope |
|
|
Report Coverage |
Details |
|
Page number |
144 |
|
Base year |
2023 |
|
Historic period |
2018-2022 |
|
Forecast period |
2024-2028 |
|
Growth momentum & CAGR |
Accelerate at a CAGR of 2.8% |
|
Market growth 2024-2028 |
USD 4.1 million |
|
Market structure |
Fragmented |
|
YoY growth 2023-2024(%) |
2.5 |
|
Competitive landscape |
Leading Companies, Market Positioning of Companies, Competitive Strategies, and Industry Risks |
What are the Key Data Covered in this Market Research Report?
- CAGR of the market during the forecast period
- Detailed information on factors that will drive the market growth and forecasting between 2024 and 2028
- Precise estimation of the size of the market and its contribution of the market in focus to the parent market
- Accurate predictions about upcoming market growth and trends and changes in consumer behaviour
- Growth of the market across Europe
- Thorough analysis of the market's competitive landscape and detailed information about companies
- Comprehensive analysis of factors that will challenge the growth of market companies
We can help! Our analysts can customize this market research report to meet your requirements Get in touch