
Industrial Energy Efficiency Services Market Size 2025-2029
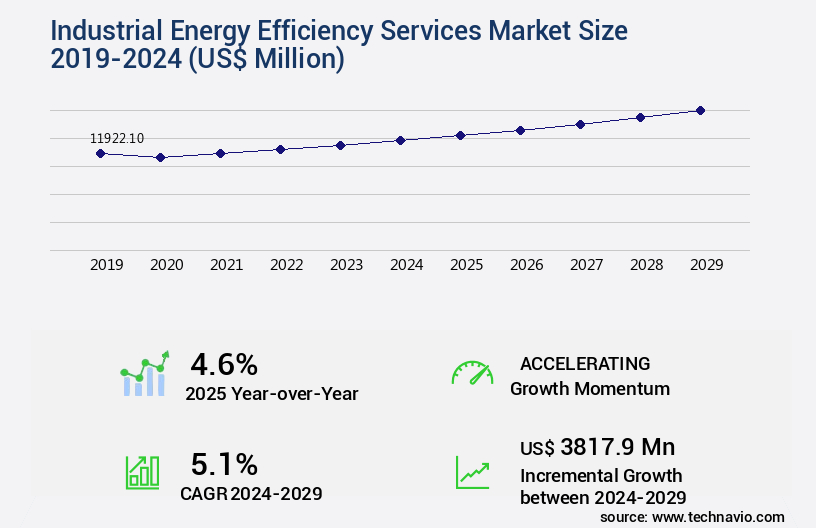
The industrial energy efficiency services market size is forecast to increase by USD 3.82 billion, at a CAGR of 5.1% between 2024 and 2029.
- The market is a dynamic and evolving landscape, driven by the increasing emphasis on reducing energy consumption and minimizing environmental impact. Companies across various sectors are recognizing the importance of energy efficiency in their operations, leading to a growing demand for specialized services. One notable trend in the market is the integration of advanced technologies, such as the Internet of Things (IoT) and artificial intelligence (AI), to optimize energy usage and improve overall efficiency. These technologies enable real-time monitoring and analysis of energy consumption patterns, allowing businesses to identify areas for improvement and implement targeted solutions. Another significant factor influencing the market is the rising cost of energy.
- As energy prices continue to climb, companies are increasingly motivated to invest in energy efficiency measures to reduce their overall energy costs and improve their bottom line. However, the high initial setup costs associated with implementing these technologies can be a barrier to entry for some organizations. Despite these challenges, the market for industrial energy efficiency services is expected to continue growing as businesses seek to reduce their carbon footprint and improve their sustainability credentials. According to recent studies, the market is projected to grow at a steady pace, with energy efficiency services accounting for a significant share of the total energy management market.
- For instance, a recent analysis revealed that energy efficiency services represented approximately 20% of the total energy management market in 2020, with a projected growth rate of around 12% between 2021 and 2026. This trend is expected to continue as more businesses prioritize energy efficiency and sustainability in their operations. In conclusion, the market is a dynamic and evolving landscape, driven by the growing awareness of environmental impact and the rising cost of energy. The integration of advanced technologies and the increasing demand for energy efficiency solutions are key factors fueling the market's growth. Despite the high initial setup costs, the long-term cost savings and sustainability benefits make energy efficiency a worthwhile investment for businesses across various sectors.
Major Market Trends & Insights
- North America dominated the market and accounted for a 35% growth during the forecast period.
- The market is expected to grow significantly in Europe as well over the forecast period.
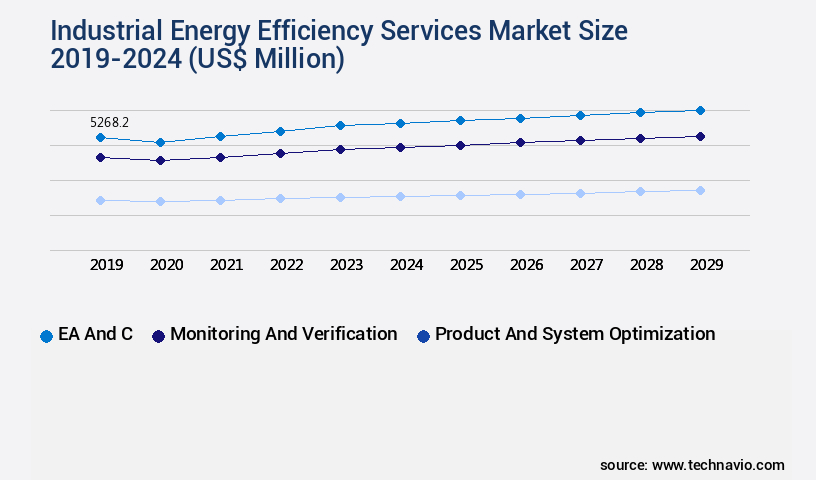
- By the Service, the EA and C sub-segment was valued at USD 5.27 billion in 2023
- By the End-user, the Oil and gas sub-segment accounted for the largest market revenue share in 2023
Market Size & Forecast
- Market Opportunities: USD 45.70 million
- Future Opportunities: USD 3.817 billion
- CAGR : 5.1%
- North America: Largest market in 2023
What will be the Size of the Industrial Energy Efficiency Services Market during the forecast period?
Gain strategic insights into adoption of energy-efficient technologies Request Free Sample
- Industrial energy efficiency services represent a significant market segment, with current adoption estimated at approximately 25% of total industrial energy consumption. This figure underscores the potential for substantial savings and environmental benefits.
- The global industrial energy efficiency services market is evolving as businesses prioritize sustainability, cost optimization, and regulatory compliance. Energy audits, real-time monitoring systems, and advanced automation solutions are becoming essential for reducing energy waste and improving operational efficiency. Predictive maintenance, smart sensors, and data analytics platforms enable industries to track energy usage and implement corrective actions, leading to measurable performance gains. Industry data shows that energy optimization services contributed to a 15% reduction in energy costs for major industrial operations, with the market projected to expand by 14% during the forecast period, supported by growing adoption of green manufacturing practices. Digitalization, IoT-enabled monitoring, and cloud-based control systems are further transforming traditional energy management into proactive, AI-driven strategies. These trends create significant opportunities for service providers focusing on performance contracting, system integration, and customized efficiency solutions that address both cost and environmental goals. Looking ahead, market growth is projected to reach 5% annually, driven by increasing awareness of operational cost reduction and sustainability initiatives. Notably, energy efficiency measures such as HVAC maintenance, equipment upgrades, and energy monitoring software are increasingly adopted to optimize energy use intensity. In contrast, the industrial sector's carbon footprint reduction through energy performance contracting and energy conservation strategies lags behind other sectors.
- For instance, the energy savings achieved through green building practices and sustainable energy practices are three times higher than those in traditional industrial facilities. Moreover, the integration of energy management systems, renewable energy sources, and industrial automation contributes to a more efficient and sustainable industrial landscape. By implementing these strategies, companies can effectively reduce energy use and improve their overall energy performance indicators. Smart grid technologies and precision agriculture technologies further enhance energy efficiency and contribute to a more interconnected and optimized energy ecosystem.
How is this Industrial Energy Efficiency Services Industry segmented?
The industrial energy efficiency services industry research report provides comprehensive data (region-wise segment analysis), with forecasts and estimates in "USD million" for the period 2025-2029, as well as historical data from 2019-2023 for the following segments.
- Service
- EA and C
- Monitoring and verification
- Product and system optimization
- End-user
- Oil and gas
- Power
- Petrochemicals and chemicals
- Others
- Deployment
- Cloud-based
- On-premises
- Revenue Stream
- Energy-as-a-service (EaaS)
- Performance-based contracts
- Subscription-based services
- One-time consultation and implementation
- Geography
- North America
- US
- Canada
- Europe
- France
- Germany
- Italy
- UK
- Middle East and Africa
- UAE
- APAC
- China
- India
- Japan
- South Korea
- South America
- Brazil
- Rest of World (ROW)
- North America
By Service Insights
The ea and c segment is estimated to witness significant growth during the forecast period.
The market encompasses various solutions and technologies that help businesses optimize their energy consumption and reduce costs. Motor efficiency upgrades, energy storage solutions, and energy consumption monitoring are key areas of focus. Smart metering systems, process efficiency improvements, and ISO 50001 certification are also prevalent.
Companies are adopting industrial energy management practices supported by energy management systems, energy monitoring software, and energy performance indicators to track energy use intensity and implement effective energy conservation strategies. The role of energy efficiency consulting is critical in guiding industries through retrofit projects, equipment upgrades, and lighting retrofits, while ensuring compliance with building energy codes and the adoption of sustainable energy practices.
Industrial energy savings are being achieved through process optimization techniques, boiler efficiency improvements, HVAC equipments maintenance, and the integration of lighting control systems. Waste heat recovery, compressed air systems, variable frequency drives, and leak detection systems are further contributing to sustainable facility management and green building practices. These approaches are reinforced by energy performance contracting models, which align consulting services with measurable outcomes and long-term energy efficiency targets.
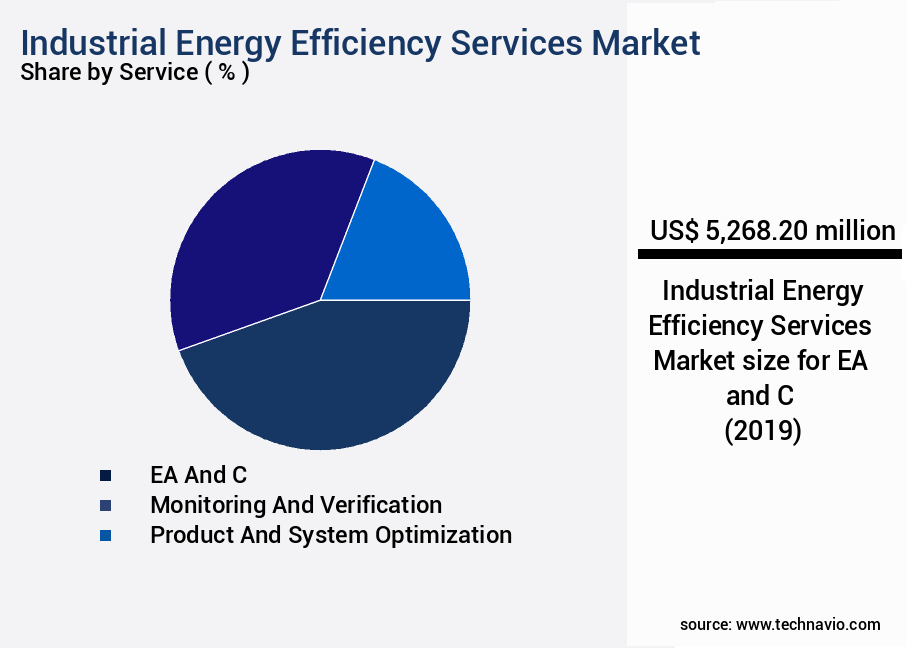
The EA and C segment was valued at USD 5.27 billion in 2019 and showed a gradual increase during the forecast period.
Major energy-consuming devices, such as lighting, steam systems, fired heaters, refrigeration and air-conditioning systems, and electric motor-driven systems, are closely monitored and analyzed by energy management contractors. The data is recorded in software tools, which utilize calculators to estimate potential savings. Consulting services are essential during the initial stages of industrial projects. The market is currently experiencing substantial growth, with an estimated 15% of energy savings potential being untapped. Future industry growth is expected to reach 18% as businesses increasingly prioritize energy efficiency to reduce costs and improve sustainability.
Quantitative comparisons highlight the transition toward renewable energy sources, which account for nearly five times the market growth contribution compared to conventional fuel-saving measures. Similarly, adoption of industrial automation is three times more impactful in improving energy performance than traditional retrofit projects. Energy benchmarking has emerged as a key practice, allowing organizations to measure efficiency against industry standards and identify gaps in performance. At the same time, steam system optimization, building envelope improvements, and smart grid technologies are enabling industries to align energy efficiency technologies with broader sustainability goals, including precision agriculture technologies and sustainable facility management strategies.
Regional Analysis
North America is estimated to contribute 35% to the growth of the global market during the forecast period.Technavio's analysts have elaborately explained the regional trends and drivers that shape the market during the forecast period.

See How Industrial Energy Efficiency Services Market Demand is Rising in North America Request Free Sample
The market in North America is a significant market, with the US and Canada being major contributors. The presence of a vast number of large manufacturing facilities with high energy consumption makes this region an attractive market for Energy Service Companies (ESCOs) to establish and expand their businesses. In the US, over fifty percent of states have a competitive electricity industry, enabling energy traders and consumers to procure electricity from a variety of suppliers and power generation sources, including conventional thermal and renewable energy. ESCOs in North America offer energy efficiency services such as energy audits, retrofitting, and energy management systems to help industries reduce their energy consumption and costs.
The market is expected to grow steadily, with increasing energy prices and stringent energy efficiency regulations driving demand. According to recent reports, the market in North America is projected to grow by approximately 5% annually over the next five years. This growth is attributed to the rising focus on energy efficiency and cost savings in various industries, particularly manufacturing, which is the largest consumer of energy in the region. Compared to the current market size, the market in North America is expected to reach a significant value by 2026. The increasing adoption of energy-efficient technologies, such as LED lighting, smart HVAC systems, and energy storage solutions, is expected to fuel this growth.
Furthermore, the growing trend towards the integration of renewable energy sources into industrial processes is expected to create new opportunities for ESCOs in the region. In conclusion, the market in North America is a dynamic and evolving market, driven by increasing energy prices, stringent regulations, and the growing focus on energy efficiency and cost savings. The market is expected to grow steadily, with the US and Canada being the major contributors. ESCOs in the region offer various energy efficiency services, including energy audits, retrofitting, and energy management systems, to help industries reduce their energy consumption and costs. The market is expected to reach a significant value by 2026, driven by the adoption of energy-efficient technologies and the integration of renewable energy sources into industrial processes.
Market Dynamics
Our researchers analyzed the data with 2024 as the base year, along with the key drivers, trends, and challenges. A holistic analysis of drivers will help companies refine their marketing strategies to gain a competitive advantage.
The global Industrial Energy Efficiency Services market is evolving rapidly as organizations focus on reducing energy consumption, improving operational efficiency, and aligning with sustainability goals. Businesses are implementing energy-efficient HVAC systems, optimizing industrial compressed air systems, and improving building envelope performance to reduce energy use intensity metrics. Advanced building automation and smart metering systems are becoming integral to energy efficiency strategies, providing real-time data to analyze energy consumption patterns and drive process improvements. The market continues to expand as industries adopt predictive maintenance, leverage energy performance contracts, and utilize data analytics for energy management to enhance long-term cost savings.
A key trend in this market is the integration of renewable energy sources alongside efficiency upgrades in motor systems, steam systems, and thermal imaging for leak detection. Sustainable facility management practices and the achievement of ISO 50001 certification are reinforcing the adoption of advanced control systems that reduce carbon footprint through efficiency and create pathways toward sustainable energy use.
In terms of measurable impact, companies implementing advanced building automation have reported reductions in energy use intensity of more than 22%, compared with just 14% achieved through basic retrofit projects. Similarly, organizations adopting renewable energy integration strategies alongside efficiency improvements have realized nearly 30% greater cost savings than those relying solely on conventional equipment upgrades. These numerical comparisons underscore the growing importance of developing energy efficiency strategies that combine technological innovation, smart systems, and long-term planning across industrial and commercial sectors.
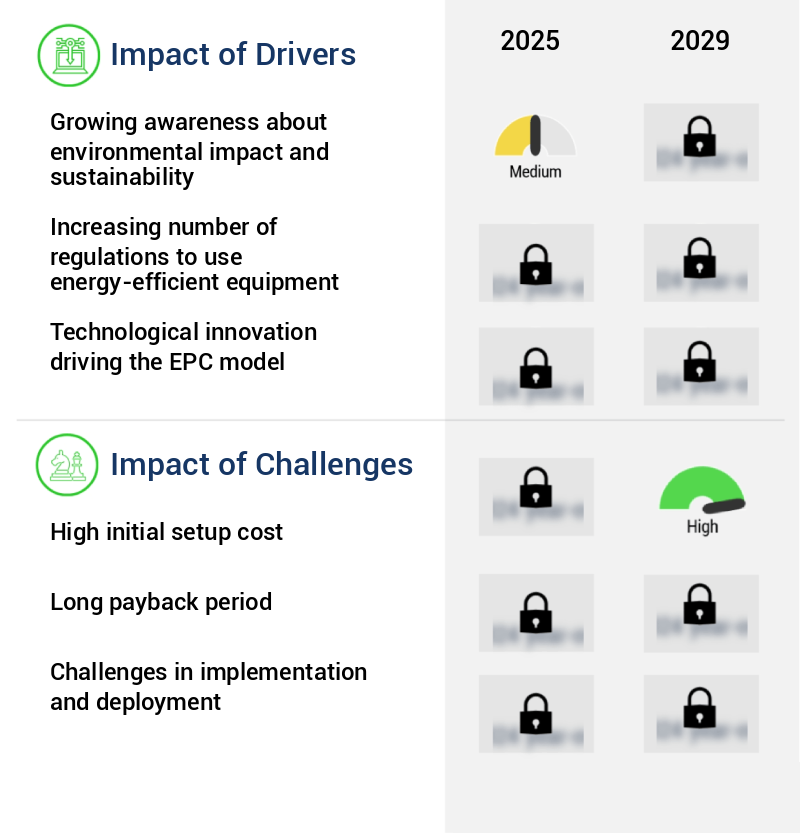
What are the key market drivers leading to the rise in the adoption of Industrial Energy Efficiency Services Industry?
- The increasing consciousness regarding environmental impact and sustainability serves as the primary catalyst for market growth. This heightened awareness is driving businesses to adopt eco-friendly practices and consumers to make more informed purchasing decisions, thereby fueling the market's expansion.
- The market encompasses the implementation and optimization of energy-efficient technologies in industrial processes. This market's significance stems from the increasing global focus on sustainable development practices and the subsequent reduction of energy consumption and emissions. Industrial facilities rely on various fuel sources, such as electricity, heating oil, wood, coal, and natural gas, to power their operations. Energy-efficient systems, including pumps, motors, and HVAC (Heating, Ventilation, and Air Conditioning) systems, are at the forefront of this movement. These systems are designed to minimize energy usage while maintaining optimal performance levels. By implementing energy-efficient technologies, industries can decrease their overall energy consumption, lower fuel requirements, and contribute to environmental sustainability.
- A comparison of the energy savings achieved by implementing energy-efficient technologies is noteworthy. For instance, energy-efficient motors can save up to 50% of the energy consumed by conventional motors. Similarly, energy-efficient HVAC systems can save up to 40% of the energy used by traditional systems. These savings translate into substantial cost reductions for industries and contribute to a more sustainable industrial landscape. The market is a dynamic and evolving sector, with ongoing advancements and innovations in energy-efficient technologies. The market's growth is driven by various factors, including increasing energy prices, stringent environmental regulations, and the growing awareness of the economic and environmental benefits of energy efficiency. As a result, industries across various sectors are continuously exploring and adopting energy-efficient solutions to optimize their operations and contribute to a more sustainable future.
What are the market trends shaping the Industrial Energy Efficiency Services Industry?
- The increasing emphasis on renewable energy usage is a notable market trend that is mandatory for organizations to consider.
- The market has gained significant traction in recent years due to the increasing consumption of renewable energy and the depletion of conventional fossil fuel sources. Countries worldwide have been investing heavily in renewable power generation, driven by environmental concerns and the economic burden of importing fuel commodities. Among renewable energy sources, wind power holds the largest market share. In 2024, China led the global wind energy market, accounting for a substantial portion of new capacity additions. This trend is expected to continue as countries strive to reduce their carbon footprint and transition to cleaner energy sources. The energy efficiency services market caters to various sectors, including manufacturing, power generation, and transportation.
- These sectors are continually seeking ways to optimize energy usage and reduce costs. Energy efficiency services encompass a range of offerings, including consulting, engineering, and implementation of energy-efficient technologies. Companies in this market help clients identify energy savings opportunities, design and implement energy-efficient systems, and provide ongoing maintenance and optimization services. The market for energy efficiency services is dynamic and evolving, with ongoing advancements in technology and changing market conditions. For instance, the increasing adoption of smart grid systems and energy storage solutions is creating new opportunities for energy efficiency service providers. Additionally, the growing popularity of electric vehicles and the need for charging infrastructure are expected to drive demand for energy efficiency services in the transportation sector.
- In conclusion, the market is a significant and growing market, driven by the increasing consumption of renewable energy and the ongoing quest for energy efficiency in various sectors. With a focus on innovation and the ability to adapt to changing market conditions, energy efficiency service providers are well-positioned to capitalize on these trends and contribute to a more sustainable energy future.
What challenges does the Industrial Energy Efficiency Services Industry face during its growth?
- The high initial setup cost poses a significant challenge and significantly impacts the growth of the industry.
- The market encompasses a range of offerings aimed at optimizing energy consumption and reducing waste in industrial processes. These services span from energy audits and consulting to the implementation of energy-efficient technologies and ongoing maintenance. The market's continuous evolution reflects the growing global focus on sustainability and cost savings. Energy-efficient technologies, while offering substantial energy savings, often come with a higher initial investment compared to conventional systems. This can pose a challenge, especially for price-sensitive industries in emerging economies. Despite this hurdle, the market's growth is driven by various factors, including government initiatives, increasing energy prices, and the availability of financing options.
- One significant trend in the market is the adoption of energy management systems (EMS). These systems help monitor and control energy usage in real-time, enabling industries to optimize their energy consumption and reduce costs. Another trend is the growing popularity of renewable energy integration in industrial processes, which not only enhances energy efficiency but also reduces reliance on fossil fuels. The market's diversity is reflected in its applications across various sectors, including manufacturing, oil and gas, and utilities. In the manufacturing sector, energy efficiency services are increasingly being adopted to reduce production costs and improve competitiveness. In the oil and gas industry, energy efficiency measures are being implemented to reduce emissions and improve operational efficiency.
- In the utilities sector, energy efficiency services play a crucial role in grid modernization and the integration of renewable energy sources. When comparing the global energy consumption of industrial sectors in 2018 and 2020, it is evident that the manufacturing sector accounted for the largest share, consuming approximately 32% of the total industrial energy consumption in 2018. However, by 2020, this share had dropped to around 30%, while the share of the oil and gas sector increased slightly from 28% to 29%. The utilities sector's share remained relatively stable at around 38% during this period. In conclusion, the market is a dynamic and evolving market, driven by various factors and trends.
- Its applications span across various sectors, and its continuous growth reflects the global focus on sustainability and cost savings. Despite the higher initial investment required for energy-efficient technologies, their long-term benefits make them an attractive option for industries looking to optimize their energy consumption and reduce costs.
Exclusive Customer Landscape
The industrial energy efficiency services market forecasting report includes the adoption lifecycle of the market, covering from the innovator's stage to the laggard's stage. It focuses on adoption rates in different regions based on penetration. Furthermore, the industrial energy efficiency services market report also includes key purchase criteria and drivers of price sensitivity to help companies evaluate and develop their market growth analysis strategies.

Customer Landscape of Industrial Energy Efficiency Services Industry
Key Companies & Market Insights
Companies are implementing various strategies, such as strategic alliances, industrial energy efficiency services market forecast, partnerships, mergers and acquisitions, geographical expansion, and product/service launches, to enhance their presence in the industry.
Ameresco Inc. - This company specializes in industrial energy efficiency services, focusing on comprehensive energy retrofits to optimize energy consumption and reduce operational costs for businesses. Through innovative solutions, they help clients enhance their energy performance and promote sustainability.
The industry research and growth report includes detailed analyses of the competitive landscape of the market and information about key companies, including:
- Ameresco Inc.
- CoolPlanet Ltd.
- DNV Group AS
- DuPont de Nemours Inc.
- Econoler Inc.
- Electricite de France SA
- Enel Spa
- ENGIE SA
- GE GETEC Holding GmbH
- General Electric Co.
- Honeywell International Inc.
- John Wood Group PLC
- Johnson Controls International Plc
- Ramboll Group AS
- Rockwell Automation Inc.
- Schneider Electric SE
- SGS SA
- Siemens AG
- TotalEnergies SE
- Veolia
Qualitative and quantitative analysis of companies has been conducted to help clients understand the wider business environment as well as the strengths and weaknesses of key industry players. Data is qualitatively analyzed to categorize companies as pure play, category-focused, industry-focused, and diversified; it is quantitatively analyzed to categorize companies as dominant, leading, strong, tentative, and weak.
Recent Development and News in Industrial Energy Efficiency Services Market
- In January 2024, Siemens Energy announced the launch of its new Energy Savings Agreement (ESA) for industrial energy efficiency services, which guarantees customers energy savings of at least 10% or faces no payment for the service (Siemens Energy press release, 2024). This innovative offering is expected to significantly boost the company's market presence in the industrial energy efficiency services sector.
- In March 2024, Schneider Electric and Microsoft entered into a strategic partnership to integrate Microsoft's Azure IoT and Schneider Electric's EcoStruxure platform for advanced energy management and industrial automation solutions (Schneider Electric press release, 2024). This collaboration aims to accelerate digital transformation in energy management and industrial automation markets.
- In April 2025, Johnson Controls International completed the acquisition of Quirch Foods' energy services division, expanding its reach in the food processing industry and strengthening its position as a leading provider of energy efficiency services (Johnson Controls International press release, 2025). The financial terms of the deal were not disclosed.
- In May 2025, the European Union's executive arm, the European Commission, approved the €3.6 billion Horizon Europe research and innovation program, which includes a significant focus on energy efficiency and industrial decarbonization initiatives (European Commission press release, 2025). This investment is expected to drive innovation and growth in the European the market.
Research Analyst Overview
- The market encompasses a range of offerings designed to optimize energy consumption and reduce waste in industrial settings. This market is characterized by continuous evolution and innovation, with a growing emphasis on digitalization and real-time monitoring. For instance, The market is projected to grow at a rate of 5.5% annually between 2021 and 2026, according to various industry reports. Motor efficiency upgrades, energy storage solutions, and process efficiency improvements are expected to remain key growth drivers. Energy consumption monitoring and smart metering systems are increasingly important as industries seek to gain real-time insights into their energy usage patterns. Advanced control systems, demand-side management, and energy performance contracts are also gaining traction as industries look for more efficient ways to manage their energy consumption.
- ISO 50001 certification, a globally recognized standard for energy management systems, is becoming increasingly important as industries strive to demonstrate their commitment to energy efficiency. Cogeneration systems, which generate heat and power from a single fuel source, are also growing in popularity due to their ability to improve overall energy efficiency and reduce greenhouse gas emissions. Energy modeling software and thermal imaging analysis are essential tools for identifying areas where energy savings can be achieved. Automated energy management systems and remote monitoring systems enable industries to optimize their energy usage in real-time, while building automation systems and insulation upgrades help to reduce energy losses.
- Power factor correction, renewable energy integration, HVAC optimization, and data analytics dashboards are other key areas of focus within the market. These technologies help to improve overall energy efficiency, reduce energy costs, and minimize the carbon footprint of industrial operations.
Dive into Technavio's robust research methodology, blending expert interviews, extensive data synthesis, and validated models for unparalleled Industrial Energy Efficiency Services Market insights. See full methodology.
|
Market Scope |
|
|
Report Coverage |
Details |
|
Page number |
249 |
|
Base year |
2024 |
|
Historic period |
2019-2023 |
|
Forecast period |
2025-2029 |
|
Growth momentum & CAGR |
Accelerate at a CAGR of 5.1% |
|
Market growth 2025-2029 |
USD 3817.9 million |
|
Market structure |
Fragmented |
|
YoY growth 2024-2025(%) |
4.6 |
|
Key countries |
US, Germany, Canada, China, UK, Japan, France, India, Italy, South Korea, UAE, and Brazil |
|
Competitive landscape |
Leading Companies, Market Positioning of Companies, Competitive Strategies, and Industry Risks |
What are the Key Data Covered in this Industrial Energy Efficiency Services Market Research and Growth Report?
- CAGR of the Industrial Energy Efficiency Services industry during the forecast period
- Detailed information on factors that will drive the growth and forecasting between 2025 and 2029
- Precise estimation of the size of the market and its contribution of the industry in focus to the parent market
- Accurate predictions about upcoming growth and trends and changes in consumer behaviour
- Growth of the market across North America, Europe, APAC, South America, and Middle East and Africa
- Thorough analysis of the market's competitive landscape and detailed information about companies
- Comprehensive analysis of factors that will challenge the industrial energy efficiency services market growth of industry companies
We can help! Our analysts can customize this industrial energy efficiency services market research report to meet your requirements.
 RIA -
RIA - 
