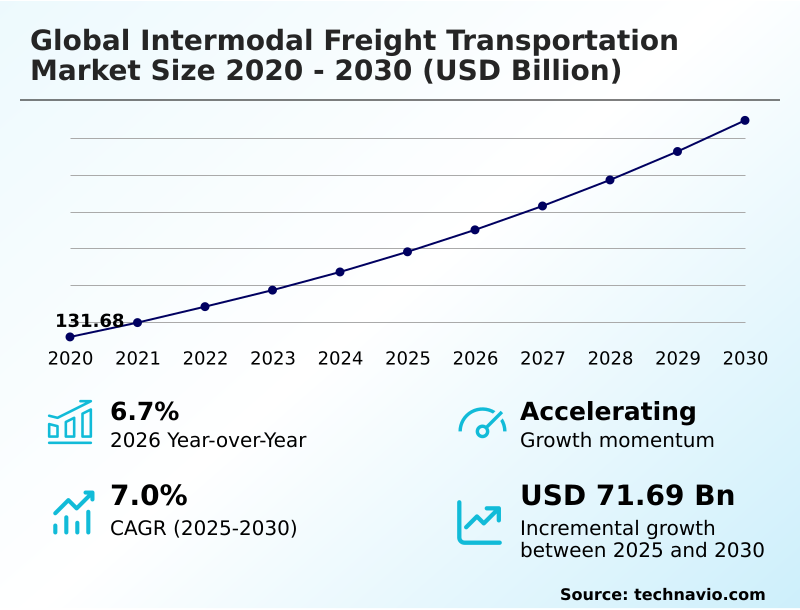
Intermodal Freight Transportation Market Size 2026-2030
The intermodal freight transportation market size is valued to increase by USD 71.69 billion, at a CAGR of 7% from 2025 to 2030. Expansion of transcontinental rail infrastructure will drive the intermodal freight transportation market.
Major Market Trends & Insights
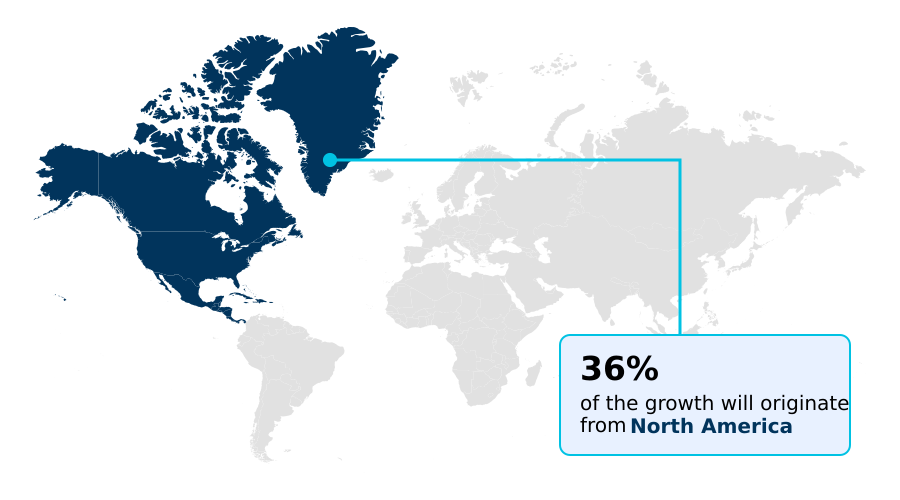
- North America dominated the market and accounted for a 35.8% growth during the forecast period.
- By Mode of Transportation - Rail transport segment was valued at USD 78.04 billion in 2024
- By Product - Minerals and ores segment accounted for the largest market revenue share in 2024
Market Size & Forecast
- Market Opportunities: USD 118.12 billion
- Market Future Opportunities: USD 71.69 billion
- CAGR from 2025 to 2030 : 7%
Market Summary
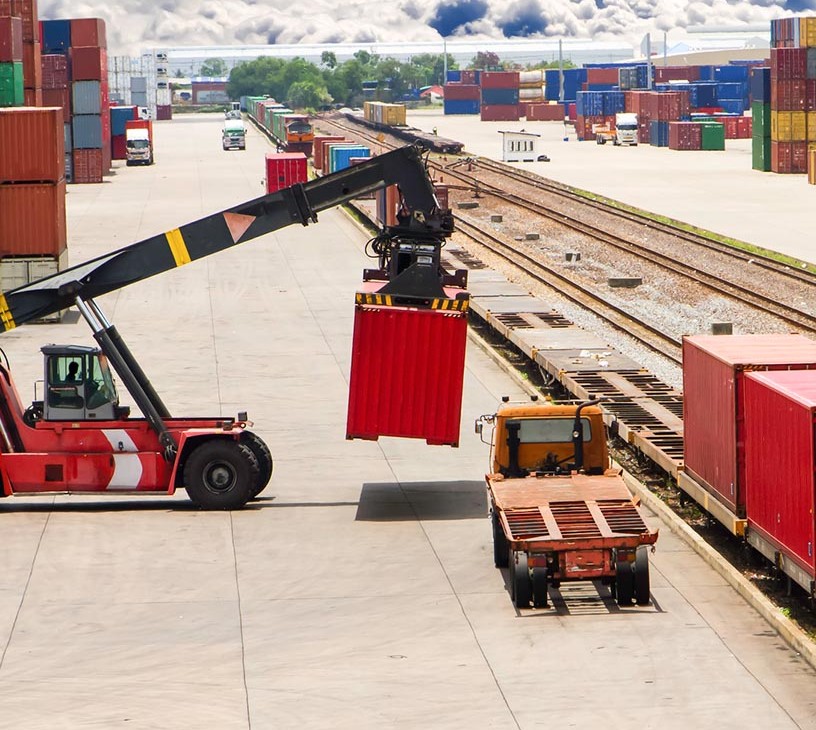
- The intermodal freight transportation market is a complex, technology-driven ecosystem designed to optimize the movement of goods across multiple transport modes. It relies on standardized containers and sophisticated logistics to create a seamless flow from origin to destination, leveraging the unique strengths of rail, sea, and road transport.
- Key drivers include the global expansion of e-commerce, which demands faster and more efficient supply chains, and stringent environmental regulations that encourage a modal shift away from road-centric transport.
- For instance, a global retailer might use sea transport for transoceanic shipping, transfer containers to rail for long-haul domestic transit to reduce its carbon footprint, and then use trucks for final-mile delivery. This approach balances cost, speed, and sustainability.
- The market is also shaped by trends such as digitalization, with the adoption of IoT for real-time tracking and digital twin technology for terminal optimization. However, the industry faces challenges from geopolitical instability, which can disrupt trade routes, and aging infrastructure in some regions, which can create bottlenecks and increase operational costs.
- Overall, the market's trajectory is toward greater integration, automation, and sustainability, driven by the need for more resilient and efficient global supply chains.
What will be the Size of the Intermodal Freight Transportation Market during the forecast period?
Get Key Insights on Market Forecast (PDF) Request Free Sample
How is the Intermodal Freight Transportation Market Segmented?
The intermodal freight transportation industry research report provides comprehensive data (region-wise segment analysis), with forecasts and estimates in "USD million" for the period 2026-2030, as well as historical data from 2020-2024 for the following segments.
- Mode of transportation
- Rail transport
- Road transport
- Sea transport
- Product
- Minerals and ores
- Food and farm products
- Equipment and instruments
- Chemicals
- Others
- Service
- Fleet management
- Intermodal terminals
- Geography
- North America
- US
- Canada
- Mexico
- Europe
- Germany
- UK
- France
- APAC
- China
- Japan
- India
- Middle East and Africa
- UAE
- Saudi Arabia
- South Africa
- South America
- Brazil
- Argentina
- Rest of World (ROW)
- North America
By Mode of Transportation Insights
The rail transport segment is estimated to witness significant growth during the forecast period.
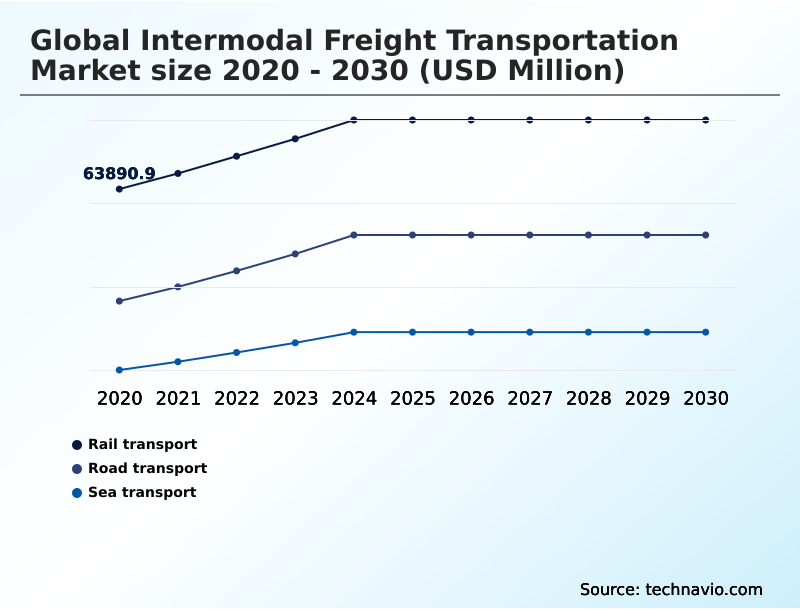
Rail transport is a cornerstone of the intermodal freight transportation market, offering significant efficiencies for long-distance cargo movement. This segment leverages double stack rail technology and advanced signaling systems to enhance freight network optimization.
The expansion of transcontinental rail infrastructure, including the development of inland dry ports, is critical for connecting manufacturing hubs with coastal gateways.
The implementation of precision scheduled railroading has improved rail freight efficiency, leading to a 15% increase in transit speed across key freight corridor developments.
By facilitating seamless port-to-rail transfer and integrating last-mile delivery integration, this mode provides a scalable and sustainable alternative to road transport, supporting complex end-to-end supply chains and mitigating port congestion.
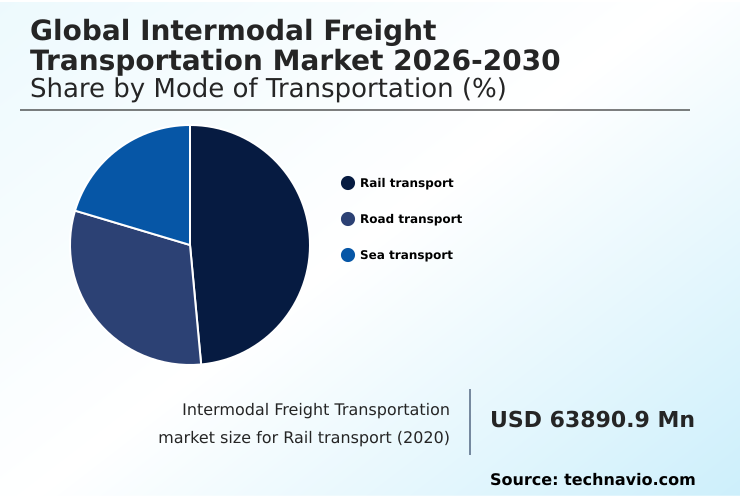
The Rail transport segment was valued at USD 78.04 billion in 2024 and showed a gradual increase during the forecast period.
Regional Analysis
North America is estimated to contribute 35.8% to the growth of the global market during the forecast period.Technavio’s analysts have elaborately explained the regional trends and drivers that shape the market during the forecast period.
See How Intermodal Freight Transportation Market Demand is Rising in North America Request Free Sample
The geographic landscape of the intermodal freight transportation market is characterized by distinct regional dynamics and growth trajectories.
North America, contributing over 35% of the market's incremental growth, leverages its vast transcontinental rail infrastructure and high adoption of double stack rail technology to maintain a mature and efficient network.
In contrast, APAC is the fastest-growing region, fueled by massive manufacturing output and significant investments in freight corridor development and port automation, particularly in China and India.
Europe focuses on sustainability and cross-border trade corridors, with a strong emphasis on shifting freight from road to rail and inland waterways to meet decarbonization initiatives, achieving up to a 20% reduction in emissions on certain routes.
These regions are central to freight network optimization, with each developing specialized multimodal logistics solutions to address unique economic and geographical demands.
Market Dynamics
Our researchers analyzed the data with 2025 as the base year, along with the key drivers, trends, and challenges. A holistic analysis of drivers will help companies refine their marketing strategies to gain a competitive advantage.
- Strategic decision-making in the intermodal freight transportation market is increasingly focused on balancing costs, efficiency, and sustainability. The cost-benefit of rail vs long-haul trucking remains a central consideration, especially as companies face pressure to reduce their carbon footprint with intermodal freight.
- For businesses involved in intermodal freight for automotive supply chains or the transport of chemicals, security and reliability are paramount. Technology plays a crucial role, with the impact of digital twins on terminal efficiency becoming a game-changer, allowing operators to simulate and de-risk operations. Similarly, technology for real-time intermodal shipment tracking is now a standard expectation.
- Investing in transcontinental rail infrastructure and the role of inland dry ports in supply chains are seen as long-term solutions to port congestion and logistics bottlenecks. On an operational level, optimizing drayage operations at busy ports and improving container repositioning efficiency are critical for profitability.
- For perishable goods, intermodal refrigerated transport for food products presents unique challenges that require specialized assets and monitoring. The rise of intermodal solutions for e-commerce logistics highlights the challenges of last-mile delivery in urban areas, where integration and speed are key.
- As the industry evolves, circular economy strategies for shipping containers and the adoption of hydrogen locomotives for sustainable freight are becoming key differentiators. Managing geopolitical risks in freight routing and addressing maintenance backlogs in rail and port infrastructure are ongoing challenges that demand resilient planning.
- For stakeholders, understanding precision scheduled railroading implementation benefits and methods for securing high-value cargo in multimodal transport is essential for navigating this complex landscape.
What are the key market drivers leading to the rise in the adoption of Intermodal Freight Transportation Industry?
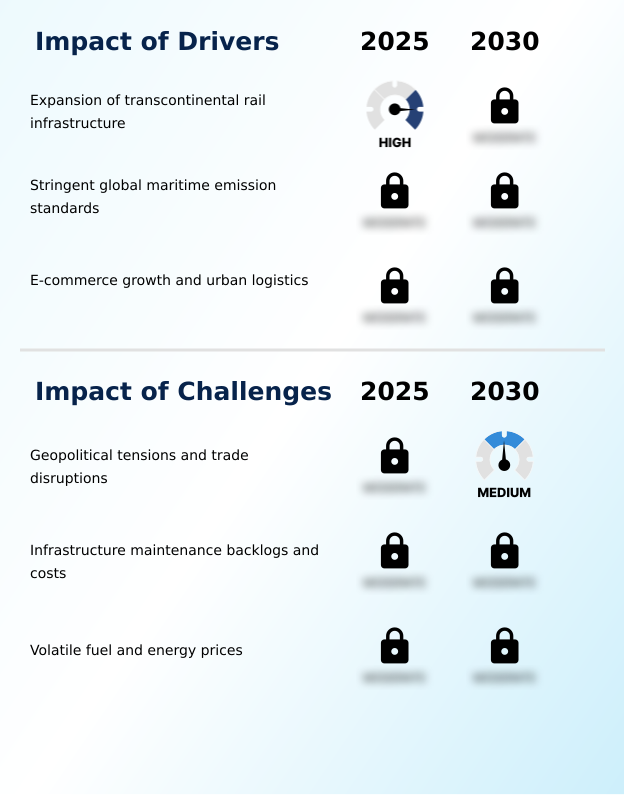
- The expansion of transcontinental rail infrastructure is a key driver for the market, connecting major manufacturing hubs with distant consumer markets more efficiently.
- Key drivers are reshaping the intermodal freight transportation market, primarily the boom in e-commerce and a stringent global focus on sustainability.
- The explosion of online retail has led to a nearly 40% increase in sales in major economies, fueling demand for sophisticated e-commerce fulfillment networks and efficient urban logistics solutions. This requires advanced supply chain orchestration to manage high-volume, time-sensitive deliveries.
- Concurrently, tightening maritime emission standards are compelling the industry to adopt green freight programs and other decarbonization initiatives, with targets set to reduce emissions by 20%.
- This regulatory pressure accelerates the shift to rail and other sustainable transport fuels, driving investments in green logistics and reinforcing the need for end-to-end supply chains with transparent carbon intensity reduction metrics.
What are the market trends shaping the Intermodal Freight Transportation Industry?
- The adoption of hydrogen-powered locomotives is emerging as a significant market trend. This shift represents a move toward zero-emission heavy-haul rail operations for long-distance intermodal routes.
- The intermodal freight transportation market is rapidly evolving, driven by technological advancements in digitalization and sustainability. The integration of digital twin simulation is a key trend, enabling terminal operators to create virtual replicas of their facilities. This allows for the optimization of container movements and predictive maintenance algorithms, which has been shown to reduce equipment downtime by over 25%.
- Another significant trend is the adoption of hydrogen-powered locomotives for heavy-haul rail operations, which supports decarbonization initiatives. These innovations, combined with smart container tracking and automated freight handling, are enhancing supply chain visibility platforms and improving asset utilization metrics.
- The move towards intermodal terminal automation and the use of a unified freight platform are further streamlining operations and contributing to more resilient distribution networks.
What challenges does the Intermodal Freight Transportation Industry face during its growth?
- Geopolitical tensions and trade disruptions present a key challenge, disrupting established trade routes and increasing operational costs for the industry.
- The intermodal freight transportation market confronts significant challenges from geopolitical instability and infrastructural decay. Escalating geopolitical tensions have led to the redirection of up to 40% of cargo volumes on certain trade routes, causing severe disruptions and a surge in operational costs. This uncertainty necessitates robust geopolitical risk management and resilient freight routing strategies.
- Compounding this issue are extensive infrastructure maintenance backlogs in many developed regions, where aging rail lines and ports struggle to support modern freight demands. The funding gap for these upgrades limits capacity and leads to service disruptions. Furthermore, volatile energy pricing creates financial unpredictability, making it difficult for operators to manage costs and invest in long-term solutions for sustainable transport.
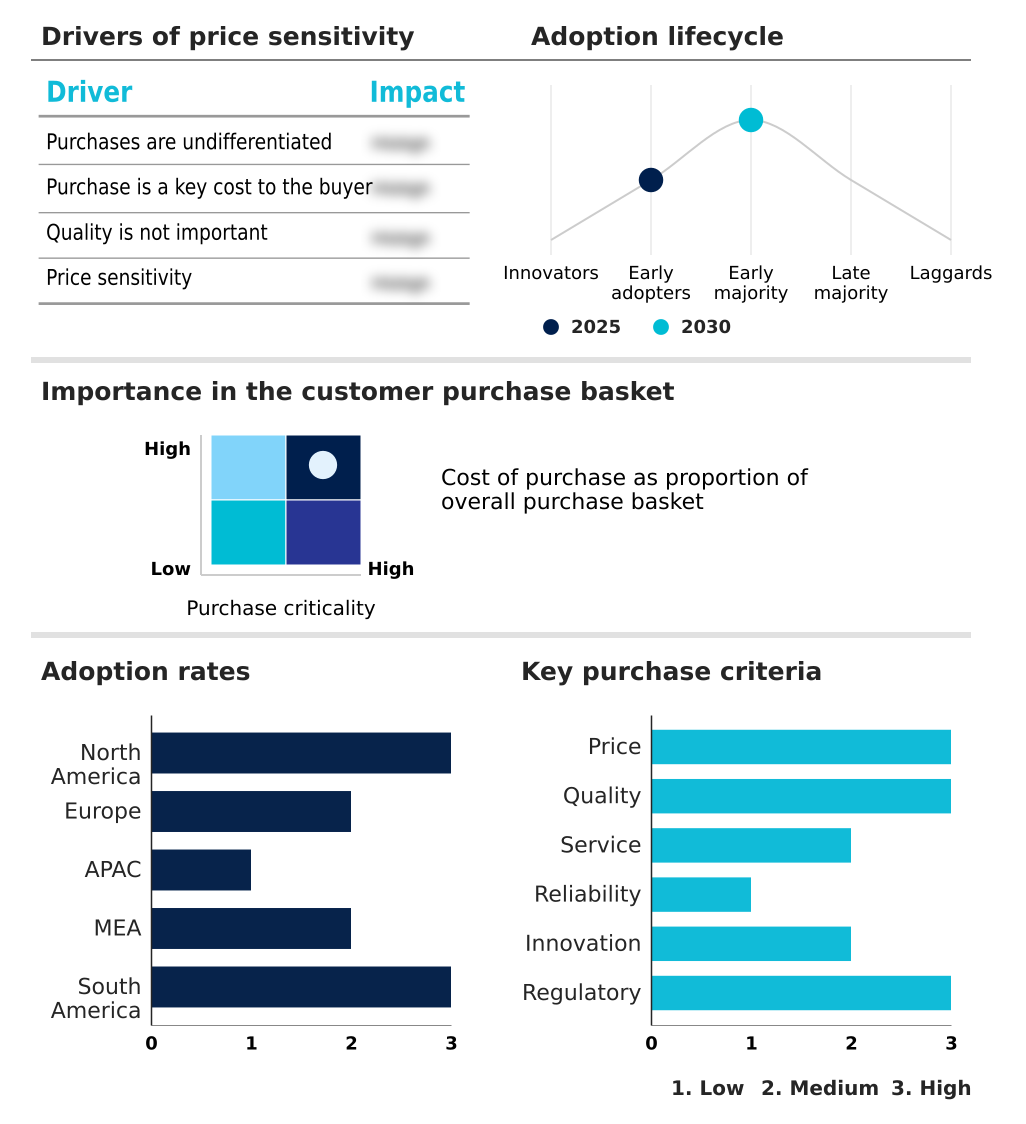
Exclusive Technavio Analysis on Customer Landscape
The intermodal freight transportation market forecasting report includes the adoption lifecycle of the market, covering from the innovator’s stage to the laggard’s stage. It focuses on adoption rates in different regions based on penetration. Furthermore, the intermodal freight transportation market report also includes key purchase criteria and drivers of price sensitivity to help companies evaluate and develop their market growth analysis strategies.
Customer Landscape of Intermodal Freight Transportation Industry
Competitive Landscape
Companies are implementing various strategies, such as strategic alliances, intermodal freight transportation market forecast, partnerships, mergers and acquisitions, geographical expansion, and product/service launches, to enhance their presence in the industry.
AP Moller Maersk AS - Offers integrated ocean, inland rail, and truck services, providing comprehensive multimodal logistics solutions that enhance the resilience of global end-to-end supply chains.
The industry research and growth report includes detailed analyses of the competitive landscape of the market and information about key companies, including:
- AP Moller Maersk AS
- BDP International Inc.
- C H Robinson Worldwide Inc.
- Convoy Logistics
- CSX Corp.
- Deutsche Bahn AG
- Deutsche Post AG
- Elemica Inc.
- Hapag Lloyd AG
- J.B. Hunt Transport Services
- Koerber AG
- Kuehne Nagel Management AG
- Lynden Inc.
- Marten Transport Ltd.
- Trimble Inc.
- Uber Technologies Inc.
- United Parcel Service Inc.
- Wabtec Corp.
- WiseTech Global Ltd.
- XPO Inc.
Qualitative and quantitative analysis of companies has been conducted to help clients understand the wider business environment as well as the strengths and weaknesses of key industry players. Data is qualitatively analyzed to categorize companies as pure play, category-focused, industry-focused, and diversified; it is quantitatively analyzed to categorize companies as dominant, leading, strong, tentative, and weak.
Recent Development and News in Intermodal freight transportation market
- In August 2024, Koerber AG reported that its logistics software clients are increasingly seeking contingency planning tools to manage the sudden closure of borders and transport corridors due to political instability.
- In September 2024, Lynden Inc. highlighted the operational difficulties and increased maintenance spending on its specialized transport equipment due to the convergence of extreme weather and aging infrastructure.
- In October 2024, DP World inaugurated a new intermodal terminal in India, equipped with state-of-the-art technology to ensure the rapid transfer of goods and handle over one million containers annually.
- In March 2025, BDP International Inc. expanded its digital platform to include enhanced simulation capabilities that allow shippers to model their entire intermodal journey and identify potential points of delay across international borders.
Dive into Technavio’s robust research methodology, blending expert interviews, extensive data synthesis, and validated models for unparalleled Intermodal Freight Transportation Market insights. See full methodology.
| Market Scope | |
|---|---|
| Page number | 304 |
| Base year | 2025 |
| Historic period | 2020-2024 |
| Forecast period | 2026-2030 |
| Growth momentum & CAGR | Accelerate at a CAGR of 7% |
| Market growth 2026-2030 | USD 71686.3 million |
| Market structure | Fragmented |
| YoY growth 2025-2026(%) | 6.7% |
| Key countries | US, Canada, Mexico, Germany, UK, France, The Netherlands, Italy, Spain, China, Japan, India, South Korea, Australia, Vietnam, UAE, Saudi Arabia, South Africa, Egypt, Nigeria, Brazil, Argentina and Chile |
| Competitive landscape | Leading Companies, Market Positioning of Companies, Competitive Strategies, and Industry Risks |
Research Analyst Overview
- The intermodal freight transportation market is advancing through the strategic integration of physical and digital infrastructure. Core assets like the intermodal chassis and gateway terminal operations are being enhanced with smart technologies. The adoption of a unified freight platform enables seamless drayage operations and port-to-rail transfer, which is critical as companies invest in transcontinental rail infrastructure.
- Innovations such as hydrogen-powered locomotives and green hydrogen fuel cells are pivotal for achieving zero-emission heavy haul, influencing long-term capital expenditure in modular refueling stations. In parallel, fleet management software, smart container tracking, and real-time cargo monitoring are becoming standard, with automated gate systems and terminal operating systems streamlining workflows at inland dry ports and major terminals.
- For instance, the use of predictive maintenance algorithms has been shown to reduce equipment downtime significantly. The implementation of digital twin simulation allows for proactive management of complex logistics, while high-strength steel rails and advanced signaling systems ensure the safety and capacity of heavy-haul rail operations.
- The push toward a circular economy is also evident in container lifecycle management, with eco-friendly coatings and robotic welding repair extending asset life.
What are the Key Data Covered in this Intermodal Freight Transportation Market Research and Growth Report?
-
What is the expected growth of the Intermodal Freight Transportation Market between 2026 and 2030?
-
USD 71.69 billion, at a CAGR of 7%
-
-
What segmentation does the market report cover?
-
The report is segmented by Mode of Transportation (Rail transport, Road transport, and Sea transport), Product (Minerals and ores, Food and farm products, Equipment and instruments, Chemicals, and Others), Service (Fleet management, and Intermodal terminals) and Geography (North America, Europe, APAC, Middle East and Africa, South America)
-
-
Which regions are analyzed in the report?
-
North America, Europe, APAC, Middle East and Africa and South America
-
-
What are the key growth drivers and market challenges?
-
Expansion of transcontinental rail infrastructure, Geopolitical tensions and trade disruptions
-
-
Who are the major players in the Intermodal Freight Transportation Market?
-
AP Moller Maersk AS, BDP International Inc., C H Robinson Worldwide Inc., Convoy Logistics, CSX Corp., Deutsche Bahn AG, Deutsche Post AG, Elemica Inc., Hapag Lloyd AG, J.B. Hunt Transport Services, Koerber AG, Kuehne Nagel Management AG, Lynden Inc., Marten Transport Ltd., Trimble Inc., Uber Technologies Inc., United Parcel Service Inc., Wabtec Corp., WiseTech Global Ltd. and XPO Inc.
-
Market Research Insights
- The dynamics of the intermodal freight transportation market are increasingly shaped by the push for greater efficiency and sustainability. The surge in e-commerce, which has grown by nearly 40% in some economies, is driving demand for sophisticated urban logistics solutions and resilient distribution networks. This necessitates better supply chain orchestration to manage volatile consumer demand.
- Concurrently, stringent maritime emission standards are compelling shippers to seek green freight programs that prioritize routes with lower carbon intensity. This focus on decarbonization initiatives is creating a clear preference for rail, which can reduce long-haul emissions by 5% for every 1000 miles of new track.
- As a result, companies are adopting transportation management systems that optimize for both cost and environmental impact, reinforcing the strategic shift toward integrated multimodal logistics solutions.
We can help! Our analysts can customize this intermodal freight transportation market research report to meet your requirements.
 RIA -
RIA - 
