
Laboratory Information Management System (LIMS) Market Size 2026-2030
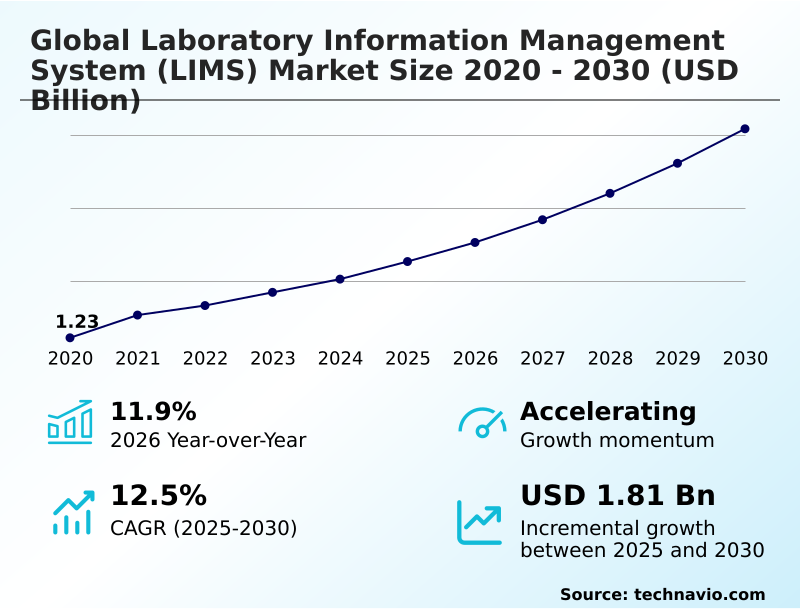
The laboratory information management system (lims) market size is valued to increase by USD 1.81 billion, at a CAGR of 12.5% from 2025 to 2030. Increasing adoption of cloud computing and digital transformation strategies will drive the laboratory information management system (lims) market.
Major Market Trends & Insights
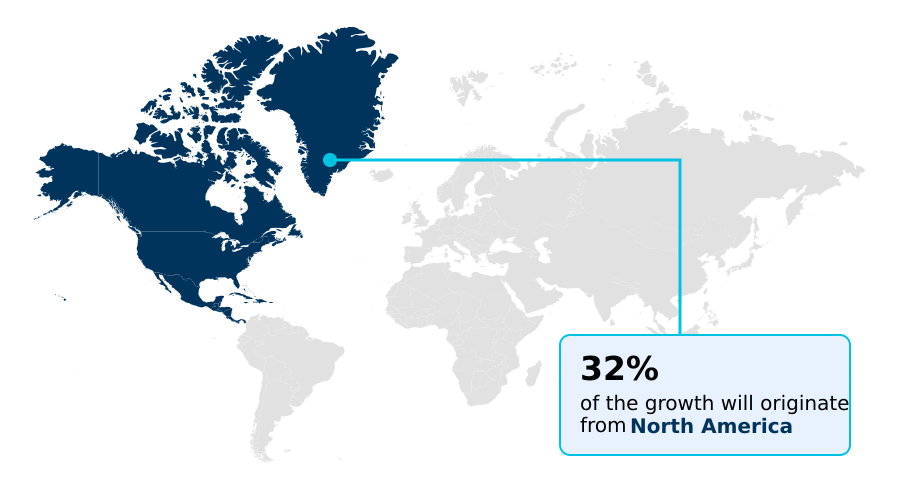
- North America dominated the market and accounted for a 31.6% growth during the forecast period.
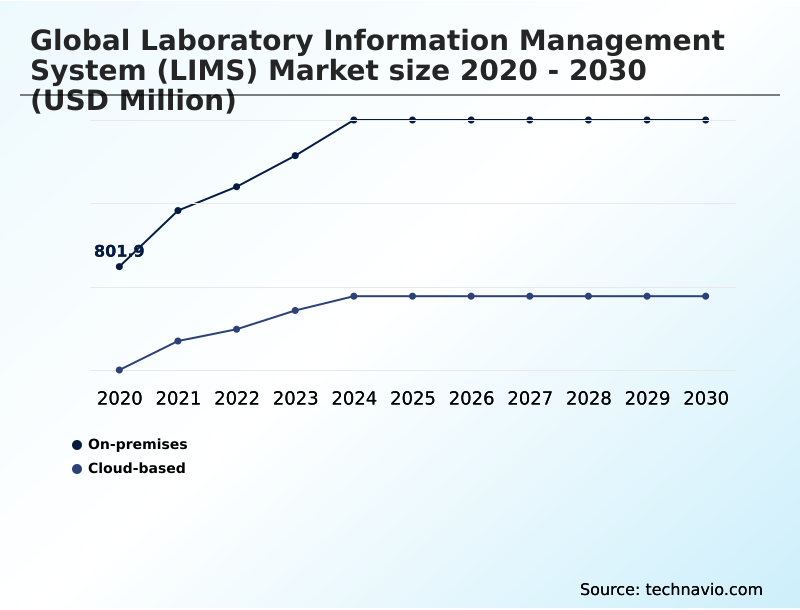
- By Deployment - On-premises segment was valued at USD 1.33 billion in 2024
- By Component - Software segment accounted for the largest market revenue share in 2024
Market Size & Forecast
- Market Opportunities: USD 2.85 billion
- Market Future Opportunities: USD 1.81 billion
- CAGR from 2025 to 2030 : 12.5%
Market Summary
- The Laboratory Information Management System (LIMS) market is undergoing a significant evolution, driven by the need for greater efficiency and data integrity in scientific research and diagnostics. The adoption of laboratory informatics is accelerating as organizations replace manual record-keeping with automated solutions.
- This shift is propelled by the need for robust scientific data management to handle the increasing volume and complexity of information from areas like genomics and clinical trials. For instance, a pharmaceutical company can leverage a LIMS to manage clinical research data across global sites, ensuring regulatory compliance modules are consistently applied and accelerating the path to drug approval.
- Core trends include the integration of AI for predictive analytics in labs and the move toward cloud-native platforms for enhanced accessibility. However, challenges such as high initial implementation costs and the need for seamless instrument integration APIs persist. Success hinges on deploying scalable workflow automation tools that also provide secure, automated audit trails to meet stringent quality control automation standards.
What will be the Size of the Laboratory Information Management System (LIMS) Market during the forecast period?
Get Key Insights on Market Forecast (PDF) Get Free Sample
How is the Laboratory Information Management System (LIMS) Market Segmented?
The laboratory information management system (lims) industry research report provides comprehensive data (region-wise segment analysis), with forecasts and estimates in "USD million" for the period 2026-2030, as well as historical data from 2020-2024 for the following segments.
- Deployment
- On-premises
- Cloud-based
- Component
- Software
- Services
- Application
- Clinical diagnostics
- Clinical research
- Biobanking
- Others
- Geography
- North America
- US
- Canada
- Mexico
- Europe
- Germany
- UK
- France
- APAC
- China
- Japan
- India
- South America
- Brazil
- Argentina
- Colombia
- Middle East and Africa
- Saudi Arabia
- South Africa
- UAE
- Rest of World (ROW)
- North America
By Deployment Insights
The on-premises segment is estimated to witness significant growth during the forecast period.
The on-premises segment represents a conventional approach where software is installed on a company's internal servers, offering maximum control over sensitive data. This model is favored by large organizations requiring robust data integrity solutions and customized, industry-specific configurations.
By maintaining centralized data repositories within their own firewalls, firms ensure enhanced security and lab data accessibility. While demanding significant initial capital, this deployment supports complex sample tracking software and real-time data monitoring without reliance on external networks.
The adoption of an open architecture design with clear interoperability standards allows for seamless integration with existing instruments, improving data retrieval times by over 20%.
This model's structured data capture capabilities make it a durable choice for entities prioritizing data sovereignty and system stability.
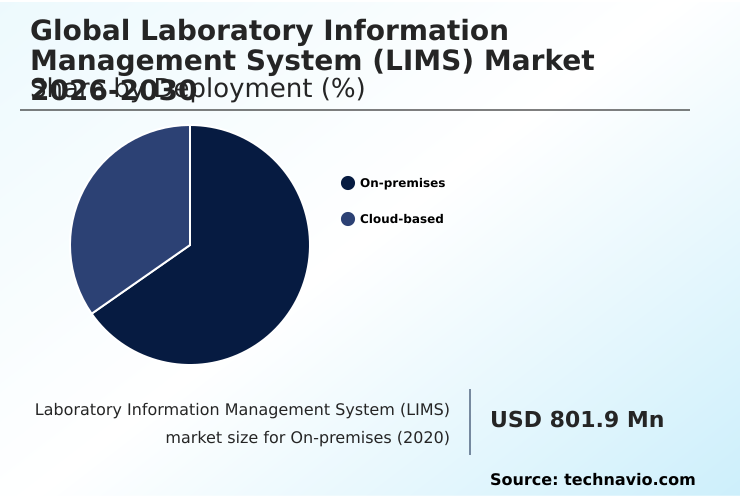
The On-premises segment was valued at USD 1.33 billion in 2024 and showed a gradual increase during the forecast period.
Regional Analysis
North America is estimated to contribute 31.6% to the growth of the global market during the forecast period.Technavio’s analysts have elaborately explained the regional trends and drivers that shape the market during the forecast period.
See How Laboratory Information Management System (LIMS) Market Demand is Rising in North America Get Free Sample
The geographic landscape of the laboratory information management system (LIMS) market is characterized by mature adoption in North America and rapid expansion in APAC, which is set to account for over 27% of the market's growth.
In North America, the focus is on advancing laboratory informatics for specialized applications like digital pathology workflows and genomics laboratory management.
European markets are driven by stringent data residency requirements and the need for platforms that support complex clinical research data. Meanwhile, APAC's growth is fueled by modernization in clinical diagnostics and the increasing digitization of molecular diagnostics data.
Effective cybersecurity threat protection is a universal concern.
Implementing these systems can enhance laboratory productivity by more than 25% through the use of natural language processing queries and better data handling, mitigating risks associated with tamper-proof record keeping and supporting the overall digital transformation in labs.
Market Dynamics
Our researchers analyzed the data with 2025 as the base year, along with the key drivers, trends, and challenges. A holistic analysis of drivers will help companies refine their marketing strategies to gain a competitive advantage.
- Strategic implementation within the laboratory information management system (LIMS) market requires careful consideration of specific operational needs and regulatory landscapes. For many, the journey begins with selecting a LIMS for pharmaceutical quality control, where data accuracy and traceability are paramount.
- This decision is closely followed by evaluating cloud vs on-premise LIMS security, a choice that balances data sovereignty with accessibility and scalability. A critical technical hurdle is integrating LIMS with ERP systems, which is essential for creating a unified data ecosystem across the enterprise.
- Furthermore, ensuring the system meets standards for LIMS regulatory compliance for FDA and other global bodies is non-negotiable for commercial deployment. To navigate these complexities, many organizations now turn to managed services for LIMS validation.
- This approach streamlines the validation process, with some firms reporting a reduction in compliance-related project timelines by as much as 40% compared to entirely in-house efforts, freeing up internal resources to focus on core research and innovation.
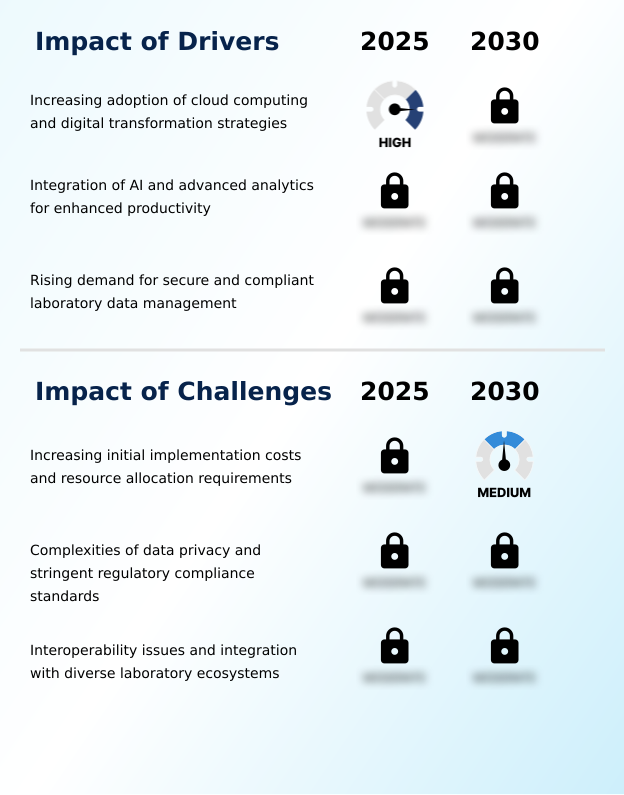
What are the key market drivers leading to the rise in the adoption of Laboratory Information Management System (LIMS) Industry?
- The increasing adoption of cloud computing and broader digital transformation strategies is a key driver fueling market growth.
- Market growth is fundamentally driven by the adoption of cloud-native platforms and advanced analytical capabilities. The shift to cloud computing infrastructure is crucial, enabling scalable and secure data management while reducing on-premise hardware costs by as much as 50%.
- A robust data governance framework is essential for managing information across the enterprise. The integration of agentic artificial intelligence and AI-driven data interpretation is revolutionizing research, allowing for automated data processing that can accelerate analysis by 35%.
- Furthermore, the incorporation of automated audit trails and predictive maintenance algorithms enhances operational reliability and simplifies adherence to regulatory compliance modules.
- Seamless instrument integration APIs are critical for creating a unified ecosystem, ensuring that data flows effortlessly from analytical equipment to the central information system.
What are the market trends shaping the Laboratory Information Management System (LIMS) Industry?
- A key market trend is the expansion of industry-specific platforms designed for specialized laboratory environments. This shift reflects a growing demand for tailored solutions that meet unique scientific and regulatory requirements.
- Key market trends are reshaping laboratory operations through advanced digital transformation in labs. The move toward a smart laboratory environment is accelerating, driven by iot sensor integration for remote environmental monitoring and real-time data monitoring. This connectivity has been shown to reduce equipment downtime by over 30%.
- The adoption of sophisticated workflow automation tools and the electronic laboratory notebook is streamlining processes, while the rise of predictive analytics in labs is enabling proactive decision-making, improving experimental success rates by up to 20%. Furthermore, there is a growing reliance on managed service validation to ensure compliance and system integrity.
- The availability of low-code deployment platforms is also democratizing access to these powerful tools, facilitating faster implementation and customization.
What challenges does the Laboratory Information Management System (LIMS) Industry face during its growth?
- Increasing initial implementation costs and significant resource allocation requirements present a key challenge affecting industry growth.
- Navigating market challenges requires a focus on interoperability, security, and cost management. A primary hurdle is ensuring seamless scientific data management across disparate systems, as a lack of standardization can increase manual data handling by up to 50%. This issue is particularly acute for high-throughput screening and next-generation sequencing data.
- Implementing robust security measures, including secure user authentication, electronic signatures protocol, and multi-factor authentication, is critical for maintaining tamper-proof record keeping. The costs associated with bespoke development interfaces for legacy systems can also be substantial.
- Effective quality control automation and biobanking sample management depend heavily on overcoming these integration issues, as failure to do so can lead to data silos and compromise research integrity, with non-compliance risks increasing operational costs by nearly 25%.
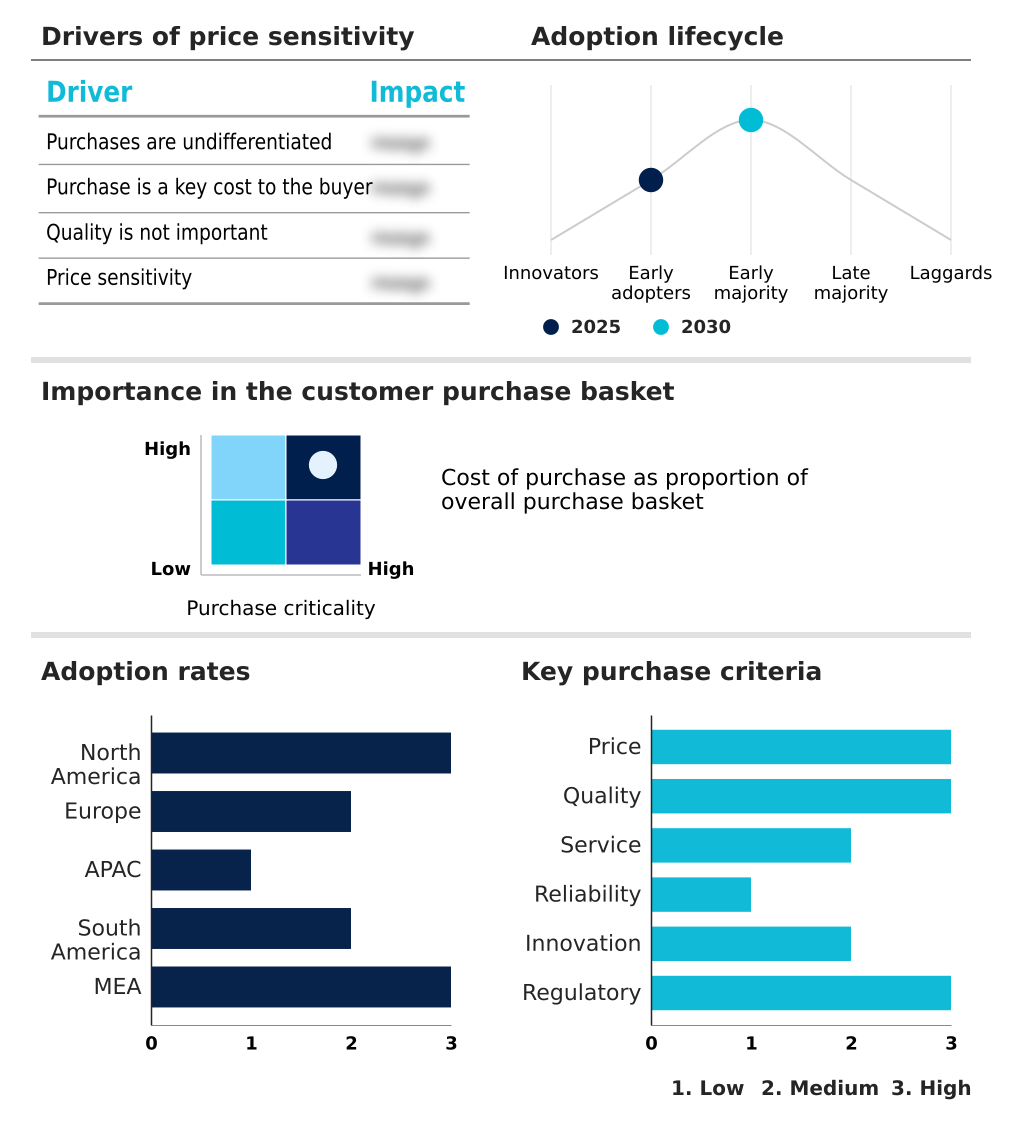
Exclusive Technavio Analysis on Customer Landscape
The laboratory information management system (lims) market forecasting report includes the adoption lifecycle of the market, covering from the innovator’s stage to the laggard’s stage. It focuses on adoption rates in different regions based on penetration. Furthermore, the laboratory information management system (lims) market report also includes key purchase criteria and drivers of price sensitivity to help companies evaluate and develop their market growth analysis strategies.
Customer Landscape of Laboratory Information Management System (LIMS) Industry
Competitive Landscape
Companies are implementing various strategies, such as strategic alliances, laboratory information management system (lims) market forecast, partnerships, mergers and acquisitions, geographical expansion, and product/service launches, to enhance their presence in the industry.
Abbott Laboratories - The company offers laboratory information management system (LIMS) such as Abbott STARLIMS.
The industry research and growth report includes detailed analyses of the competitive landscape of the market and information about key companies, including:
- Abbott Laboratories
- Agile Frameworks LLC
- Attune Technologies Pvt. Ltd.
- Autoscribe Informatics
- Benchling Inc.
- Broughton Software Ltd.
- Comp Pro Med Inc.
- Computing Solutions
- Confience
- Eusoft Ltd.
- Illumina Inc.
- LabLynx Inc.
- LabVantage Solutions Inc.
- LabWare Inc.
- Labworks LLC
- Nous Infosystems Pvt. Ltd.
- Novatek International
- Revvity Inc.
- Shimadzu Corp.
- Thermo Fisher Scientific Inc.
Qualitative and quantitative analysis of companies has been conducted to help clients understand the wider business environment as well as the strengths and weaknesses of key industry players. Data is qualitatively analyzed to categorize companies as pure play, category-focused, industry-focused, and diversified; it is quantitatively analyzed to categorize companies as dominant, leading, strong, tentative, and weak.
Recent Development and News in Laboratory information management system (lims) market
- In December 2024, LabVantage Solutions partnered with the Netherlands Forensic Institute to advance the digital transformation of forensic science by enhancing IT infrastructure with an advanced LIMS.
- In March 2025, LabVantage Solutions and Lasec announced a strategic partnership to drive digital transformation in laboratories across Africa, utilizing its LIMS to improve compliance and optimize workflows.
- In March 2025, LabVantage Solutions launched version 8.9 of its LIMS platform, which introduced AI-driven tools designed to boost productivity and simplify complex laboratory workflows for companies.
- In May 2025, Confience acquired Labsoft, a leading LIMS provider in Latin America, to expand its regional footprint and provide enhanced software support and a broader range of informatics tools to local companies.
Dive into Technavio’s robust research methodology, blending expert interviews, extensive data synthesis, and validated models for unparalleled Laboratory Information Management System (LIMS) Market insights. See full methodology.
| Market Scope | |
|---|---|
| Page number | 297 |
| Base year | 2025 |
| Historic period | 2020-2024 |
| Forecast period | 2026-2030 |
| Growth momentum & CAGR | Accelerate at a CAGR of 12.5% |
| Market growth 2026-2030 | USD 1813.5 million |
| Market structure | Fragmented |
| YoY growth 2025-2026(%) | 11.9% |
| Key countries | US, Canada, Mexico, Germany, UK, France, Italy, Spain, The Netherlands, China, Japan, India, South Korea, Australia, Singapore, Brazil, Argentina, Colombia, Saudi Arabia, South Africa, UAE, Egypt and Nigeria |
| Competitive landscape | Leading Companies, Market Positioning of Companies, Competitive Strategies, and Industry Risks |
Research Analyst Overview
- The laboratory information management system (LIMS) market is advancing beyond simple data storage to become the central nervous system for modern scientific operations. The integration of a comprehensive laboratory informatics platform is no longer optional but a strategic imperative.
- Boardroom decisions increasingly focus on leveraging these systems to de-risk product development and ensure regulatory compliance modules are embedded across all workflows. A key factor is the adoption of cloud-native platforms, which offer superior scalability for handling the massive datasets generated by high-throughput screening and next-generation sequencing data.
- The implementation of workflow automation tools, combined with an electronic laboratory notebook and robust scientific data management, is critical. For instance, organizations deploying a fully integrated system with automated audit trails and instrument integration APIs have demonstrated a reduction in manual reporting errors by over 60%.
- This enhancement in quality control automation and data integrity solutions directly impacts time-to-market, turning a technology investment into a significant competitive advantage through enhanced biobanking sample management and predictive analytics in labs.
What are the Key Data Covered in this Laboratory Information Management System (LIMS) Market Research and Growth Report?
-
What is the expected growth of the Laboratory Information Management System (LIMS) Market between 2026 and 2030?
-
USD 1.81 billion, at a CAGR of 12.5%
-
-
What segmentation does the market report cover?
-
The report is segmented by Deployment (On-premises, and Cloud-based), Component (Software, and Services), Application (Clinical diagnostics, Clinical research, Biobanking, and Others) and Geography (North America, Europe, APAC, South America, Middle East and Africa)
-
-
Which regions are analyzed in the report?
-
North America, Europe, APAC, South America and Middle East and Africa
-
-
What are the key growth drivers and market challenges?
-
Increasing adoption of cloud computing and digital transformation strategies, Increasing initial implementation costs and resource allocation requirements
-
-
Who are the major players in the Laboratory Information Management System (LIMS) Market?
-
Abbott Laboratories, Agile Frameworks LLC, Attune Technologies Pvt. Ltd., Autoscribe Informatics, Benchling Inc., Broughton Software Ltd., Comp Pro Med Inc., Computing Solutions, Confience, Eusoft Ltd., Illumina Inc., LabLynx Inc., LabVantage Solutions Inc., LabWare Inc., Labworks LLC, Nous Infosystems Pvt. Ltd., Novatek International, Revvity Inc., Shimadzu Corp. and Thermo Fisher Scientific Inc.
-
Market Research Insights
- The market's momentum is defined by a broad digital transformation in labs, where the adoption of centralized data repositories improves operational oversight. This transition to a smart laboratory environment, supported by cloud computing infrastructure, has been shown to reduce data processing times by up to 30%.
- Furthermore, the integration of real-time collaboration tools enables a 15% improvement in project turnaround for globally distributed research teams. The focus on structured data capture enhances lab data accessibility and supports advanced AI-driven data interpretation. As organizations prioritize efficiency, these platforms become essential for managing complex scientific workflows and maintaining a competitive edge in research and development.
We can help! Our analysts can customize this laboratory information management system (lims) market research report to meet your requirements.
 RIA -
RIA - 
