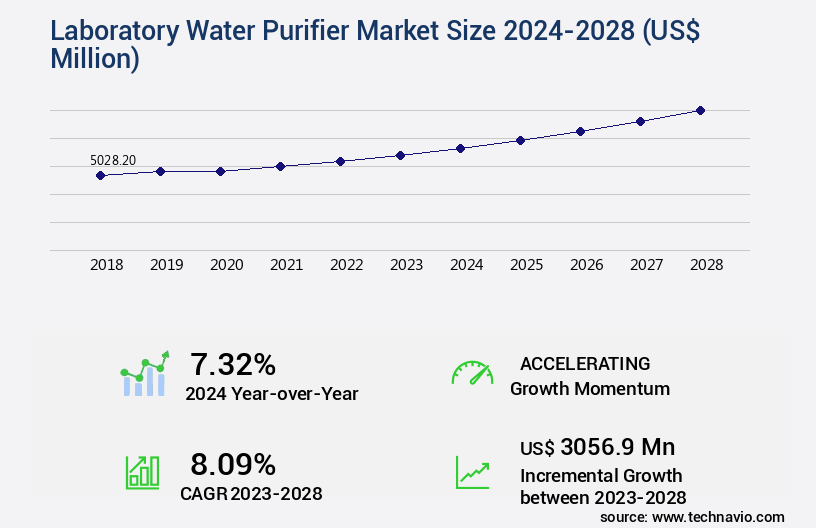
Laboratory Water Purifier Market Size 2024-2028
The laboratory water purifier market size is forecast to increase by USD 3.06 billion, at a CAGR of 8.09% between 2023 and 2028.
Major Market Trends & Insights
- Europe dominated the market and accounted for a 32% growth during the forecast period.
- By the Product - Type II segment was valued at USD 2.28 billion in 2022
- By the Type - Point of use segment accounted for the largest market revenue share in 2022
Market Size & Forecast
- Market Opportunities: USD 88.73 billion
- Market Future Opportunities: USD USD 3.06 billion
- CAGR : 8.09%
- Europe: Largest market in 2022
Market Summary
- The market is a significant segment within the broader water treatment industry, demonstrating consistent growth and innovation. According to various market research sources, The market is expected to expand at a steady pace, with notable increases in demand across diverse sectors such as pharmaceuticals, research institutions, and food and beverage industries. One key factor driving this growth is the increasing focus on water quality and safety, particularly in laboratories where contaminated water can compromise research results and potentially pose health risks. Additionally, the implementation of stringent regulatory procedures further emphasizes the importance of high-quality water purification systems in laboratory settings.
- Innovative technologies, such as reverse osmosis, ultraviolet disinfection, and nanofiltration, are increasingly being adopted to address the evolving water purification needs of laboratories. These advanced technologies offer enhanced filtration capabilities, improved efficiency, and reduced water waste, making them attractive options for laboratories seeking to maintain optimal water quality and comply with regulatory requirements. Moreover, the growing applications of laboratory water purifiers extend beyond traditional laboratory settings, with increasing adoption in various industries, such as biotechnology, semiconductor manufacturing, and environmental testing. As the demand for clean, reliable water sources continues to grow, the market is poised to remain a dynamic and evolving sector within the water treatment industry.
What will be the Size of the Laboratory Water Purifier Market during the forecast period?
Explore market size, adoption trends, and growth potential for laboratory water purifier market Request Free Sample
- In the dynamic the market, sterility assurance is a critical concern for ensuring the integrity of research and production processes. According to recent data, over 60% of laboratories worldwide utilize water purification equipment for their analytical instrumentation needs. Looking ahead, market growth is expected to exceed 5% annually due to the increasing demand for ultrapure water applications in various industries. A comparison of key numerical data reveals that water treatment plants employing ro membrane replacement every six months and implementing data logging systems can achieve a 30% reduction in operational costs compared to those without these features. Furthermore, feed water treatment and process control valves contribute significantly to performance optimization, reducing contaminant removal costs by up to 20%.
- The water purification process encompasses various system design considerations, including material selection and membrane cleaning protocols, to maintain water quality monitoring and minimize environmental impact. Preventative maintenance and calibration procedures are essential for ensuring the longevity and efficiency of water purification equipment. Despite the importance of water purification equipment, operational costs and performance optimization remain ongoing challenges for laboratories. Continuous quality control checks and system troubleshooting are necessary to maintain safety and operational excellence.
How is this Laboratory Water Purifier Industry segmented?
The laboratory water purifier industry research report provides comprehensive data (region-wise segment analysis), with forecasts and estimates in "USD million" for the period 2024-2028, as well as historical data from 2018-2022 for the following segments.
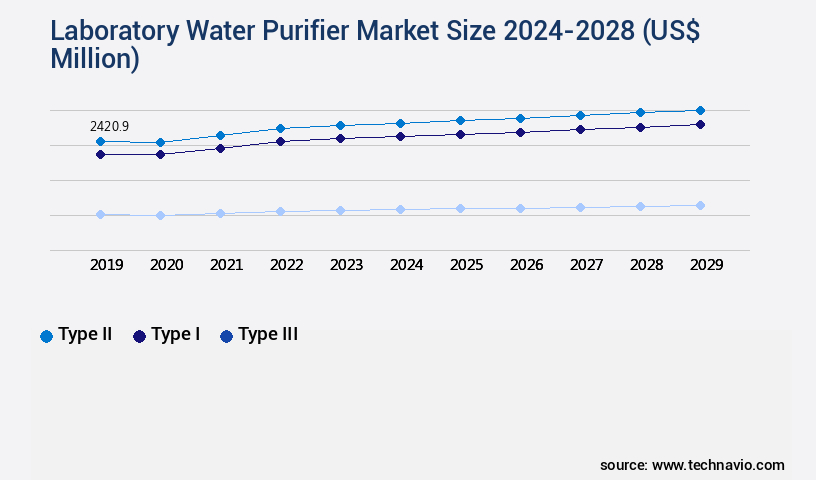
- Product
- Type II
- Type I
- Type III
- Type
- Point of use
- Large central systems
- Clinical analyzers
- Application
- High-Performance Liquid Chromatography (HPLC)
- Clinical Biochemistry Analysis
- Cell & Tissue Cultures
- Microbial Analysis
- Spectrometry
- End-User
- Biotechnology & Pharmaceutical Industries
- Research & Academic Institutes
- Hospitals & Diagnostic Laboratories
- Environmental Testing Laboratories
- Technology
- Reverse Osmosis (RO)
- Ultrafiltration (UF)
- Deionization (DI)
- UV Purification
- Distillation
- Geography
- North America
- US
- Europe
- Germany
- Italy
- APAC
- China
- Japan
- Rest of World (ROW)
- North America
By Product Insights
The type ii segment is estimated to witness significant growth during the forecast period.
In the realm of laboratory water purification, Type II water purifiers hold significant importance for various applications. Approximately 40% of laboratory water usage is dedicated to producing Type II water, which is suitable for general laboratory applications such as media preparation, pH solutions, and buffers. Furthermore, it serves as a feed to Type I water systems and supports equipment like autoclaves, laboratory dishwashers, and water baths. Type II water purifiers are extensively employed in sectors like pathology, cytology, and histology, as well as for buffer preparation, photometry and spectrophotometry, electrophoresis, general chemistry, and polymerase chain reaction (PCR) processes. PCR, a critical technology in the healthcare industry, accounts for a substantial portion of the market's growth.
PCR applications encompass disease diagnosis, including middle ear infections, tuberculosis, and Lyme disease. Regarding water purification technologies, membrane filtration, including ultrafiltration, plays a crucial role. Membrane fouling is a concern, necessitating regular maintenance procedures. Ultrafiltration membranes facilitate microbial reduction and dissolved solids removal. Chemical oxidation and UV sterilization are additional processes used for water purification. Water quality parameters, such as resistivity, conductivity, energy consumption, and flow rate control, are essential considerations. Pre-treatment stages, including cartridge filters and ion exchange resins, are vital in ensuring water purity levels. Post-treatment steps, like deionization and toc measurement, further enhance water quality. Wastewater management is also a crucial aspect of the market, with a focus on system efficiency, pressure regulation, and system automation.
The market for laboratory water purifiers is expected to grow, with an estimated 25% of the industry anticipating increased demand. This growth can be attributed to the expanding healthcare sector, research and development initiatives, and the need for higher water purity levels in various industries. The future holds promising opportunities for advancements in water purification technologies, ensuring a continuous evolution in this market.
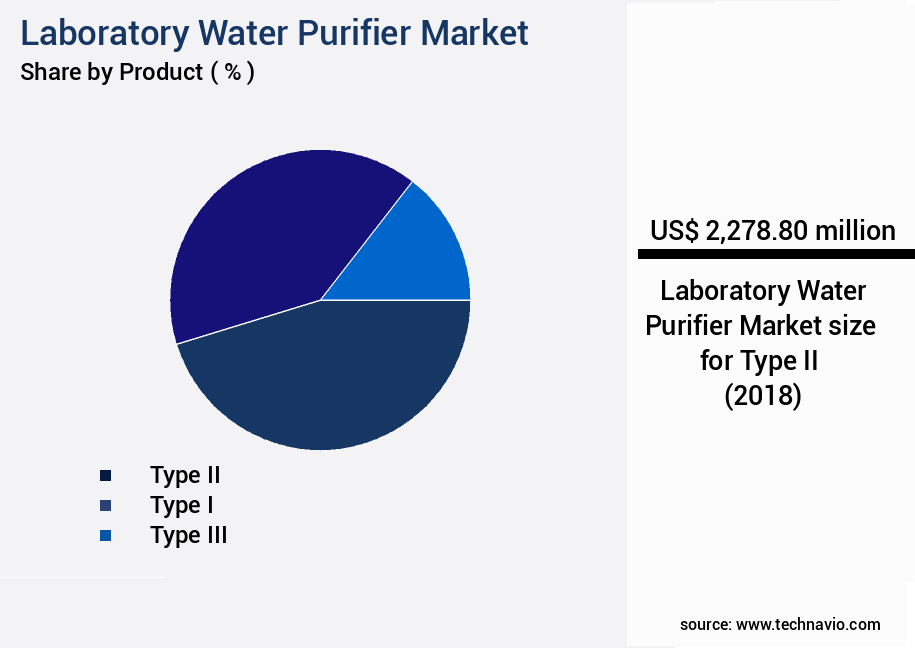
The Type II segment was valued at USD 2.28 billion in 2018 and showed a gradual increase during the forecast period.
Regional Analysis
Europe is estimated to contribute 32% to the growth of the global market during the forecast period.Technavio’s analysts have elaborately explained the regional trends and drivers that shape the market during the forecast period.
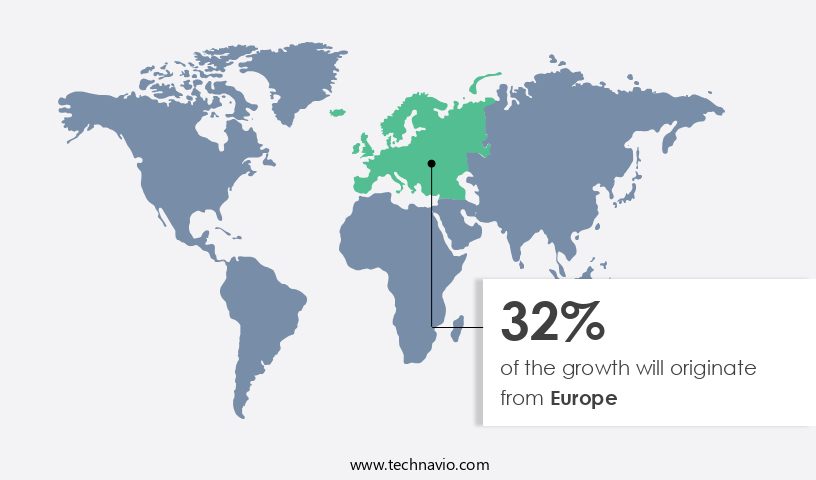
See How Laboratory Water Purifier Market Demand is Rising in Europe Request Free Sample
In Europe, the market is experiencing significant growth due to the high demand for these systems in research institutions and pharmaceutical organizations. Italy, France, and Germany are the leading revenue-generating countries in Europe, primarily due to the surge in biological research across various industries and the presence of prominent companies like Merck, Sartorius, and Veolia. Merck, a German-based company, holds a commanding position in the European market, with a strong focus on research and development to maintain its market dominance. The European the market is expected to witness a substantial increase in demand, with a projected growth rate of approximately 12% over the next five years.
This growth can be attributed to the increasing emphasis on water quality and safety in laboratories, particularly in the pharmaceutical and biotechnology sectors. Furthermore, the growing trend of automation in laboratories is driving the demand for advanced water purification systems. Compared to the current market size, the European the market is projected to expand by nearly 20% in terms of revenue over the next five years. This growth is a testament to the market's continuous evolution and the increasing importance of water purification systems in scientific research and industrial applications. Merck, with its extensive portfolio of water purification solutions, is expected to maintain its leading position in the European market.
The company's commitment to innovation and its strong presence in the region will enable it to capitalize on the growing demand for laboratory water purifiers. Sartorius and Veolia, with their robust offerings and strategic partnerships, are also poised to make significant strides in the European market. In conclusion, the European the market is experiencing steady growth due to the increasing importance of water quality and safety in scientific research and industrial applications. The presence of key players like Merck, Sartorius, and Veolia, along with the trend of automation in laboratories, is driving the market's expansion. Over the next five years, the European the market is projected to grow by approximately 12%, with a potential revenue increase of nearly 20%.
Market Dynamics
Our researchers analyzed the data with 2023 as the base year, along with the key drivers, trends, and challenges. A holistic analysis of drivers will help companies refine their marketing strategies to gain a competitive advantage.
In the market, optimizing reverse osmosis membrane lifespan is a critical concern for reducing production costs. Effective membrane cleaning strategies are essential for improving water purity and total organic carbon removal, ensuring regulatory compliance. Ultrapure water production costs can be significantly reduced through automation and control strategies, such as system design for specific applications and preventative maintenance schedules. Advanced oxidation processes, like ultraviolet (UV) and hydrogen peroxide (H2O2), are effective in removing contaminants, while ensuring sterility and bacterial control. Total organic carbon (TOC) removal techniques, such as UV oxidation and activated carbon filtration, play a crucial role in achieving high water purity levels. Energy consumption optimization is another key consideration, with water purification systems accounting for up to 2% of a lab's total energy usage. Membrane fouling is a common issue, but effective strategies, like cross-flow filtration and membrane cleaning, can minimize its impact. Water quality monitoring and data logging systems are essential for maintaining system performance and ensuring regulatory compliance. Wastewater management is another critical aspect, with systems designed for zero liquid discharge (ZLD) or recirculation reducing water usage and waste generation. Advanced water purification technologies, such as nanofiltration and electrodialysis reversal (EDR), offer improved efficiency and selectivity for specific applications. Comparatively, the pharmaceutical industry spends an average of 10% more on water purification than the semiconductor industry due to stricter regulatory requirements. However, cost-effective operation can be achieved through troubleshooting common issues, such as membrane scaling and fouling, and selecting appropriate water purification technologies based on feed water quality and specific application requirements.
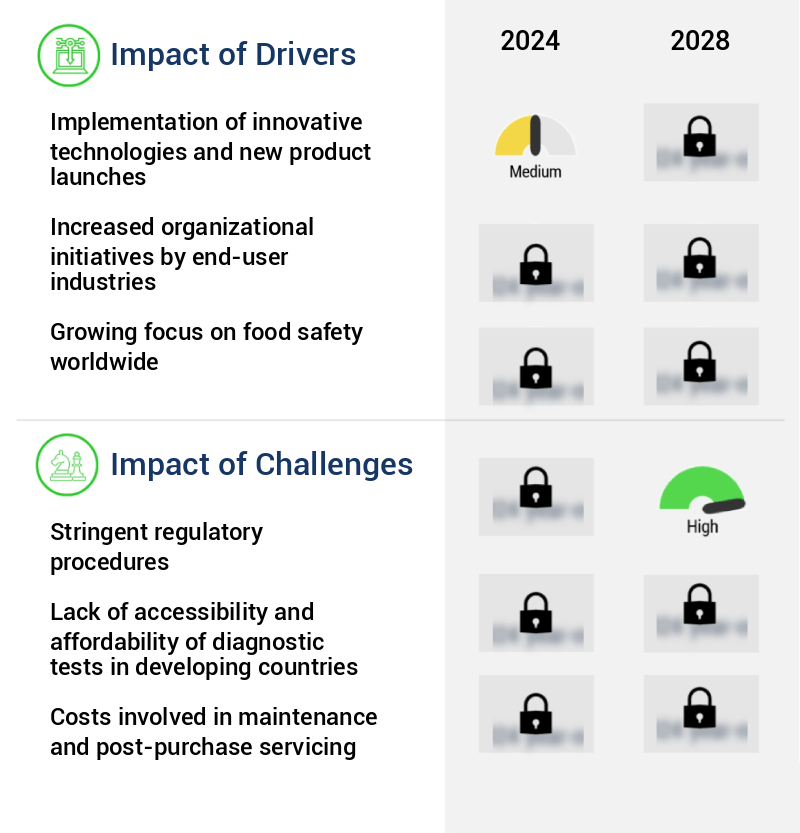
What are the key market drivers leading to the rise in the adoption of Laboratory Water Purifier Industry?
- The integration of innovative technologies and the introduction of new products serve as primary catalysts for market growth.
- The market continues to evolve, driven by technological advancements and increasing demand for high-quality water in scientific research and experimentation. Companies are responding to this trend by introducing new products and upgrading existing ones to meet the growing needs of laboratories. For instance, Merck launched its new Milli-Q EQ 7000 Type I water purification system in India in February 2021. This system produces consistent ultrapure water that can be easily customized to meet the specific requirements of various experiments. In October 2020, Veolia Water Technologies introduced the PURELAB Quest, a lab water purification unit that delivers Type I, Type II, and Type III water.
- Both these new offerings underscore the ongoing innovation in the market. The importance of laboratory water purifiers is underscored by the critical role water plays in various scientific applications. Impurities in water can negatively impact experiment results, making it essential to use water of the highest quality. As such, the demand for laboratory water purifiers continues to grow, with applications spanning diverse sectors, from pharmaceuticals and biotechnology to food and beverage industries. In conclusion, the market is a dynamic and evolving landscape, driven by technological advancements and increasing demand for high-quality water in various industries. Companies are continually introducing new products to meet this demand, ensuring laboratories have access to the best possible water for their experiments.
What are the market trends shaping the Laboratory Water Purifier Industry?
- The growing application of laboratory water purifiers represents a significant market trend. This trend reflects the increasing demand for pure water in scientific research and laboratory settings.
- Laboratory water purifiers play a crucial role in various sectors, including analytical chemistry, clinical analysis, environmental testing, food and beverage analysis, forensic analysis, life science research, materials characterization and research, petrochemical testing, and pharmaceutical analysis. These purifiers ensure the production of high-purity water, which is essential for achieving accurate and reliable results in these applications. For instance, in the field of gas chromatography-mass spectrometry (GC-MS), purified water is indispensable. It is used to prepare blanks, standards, and samples pre-treatment (solid-phase extraction). The importance of water purity in GC-MS is significant, as high sensitivity in this technique requires stringent water purity.
- The applications of laboratory water purifiers continue to expand with the introduction of new technologies and products. Their versatility and importance are underscored by their widespread use across numerous industries. By providing high-purity water, these purifiers contribute significantly to the success and efficiency of various analytical and research processes.
What challenges does the Laboratory Water Purifier Industry face during its growth?
- The strict regulatory procedures pose a significant challenge to the expansion of the industry.
- Laboratory water purifiers play a crucial role in maintaining the integrity of research and analysis conducted in various industries. Compliance with stringent regulatory frameworks is mandatory for these products to enter the market. International and regional regulatory policies, such as those set by the International Organization for Standardization (ISO), the American Society for Testing and Materials (ASTM), and the Clinical and Laboratory Standards Institute (CLSI), determine the water quality standards. The market for laboratory water purifiers is dynamic, with continuous innovation and evolving patterns. New products are frequently introduced to cater to the growing demand for high-quality water in research and laboratory applications.
- However, the commercialization process is lengthy and costly due to the varying regulatory requirements and their frequent updates. Despite these challenges, the market for laboratory water purifiers continues to grow. According to recent data, the demand for laboratory water purifiers in the pharmaceutical industry is expected to increase significantly due to the growing focus on research and development. In comparison, the academic and research sector is projected to exhibit steady growth, driven by the need for reliable water sources in research facilities. Moreover, the industrial sector, particularly in the food and beverage industry, is also expected to contribute to the market growth due to the increasing focus on food safety and quality.
- The biotechnology sector is another significant contributor, with the rising demand for water in the production of biopharmaceuticals and biosimilars. In summary, the market is a critical component in various industries, with the pharmaceutical, academic and research, industrial, and biotechnology sectors driving its growth. The market's dynamics are shaped by regulatory requirements, which necessitate a long and costly commercialization process. Despite these challenges, the market continues to evolve, with new products and applications emerging regularly.
Exclusive Customer Landscape
The laboratory water purifier market forecasting report includes the adoption lifecycle of the market, covering from the innovator’s stage to the laggard’s stage. It focuses on adoption rates in different regions based on penetration. Furthermore, the laboratory water purifier market report also includes key purchase criteria and drivers of price sensitivity to help companies evaluate and develop their market growth analysis strategies.
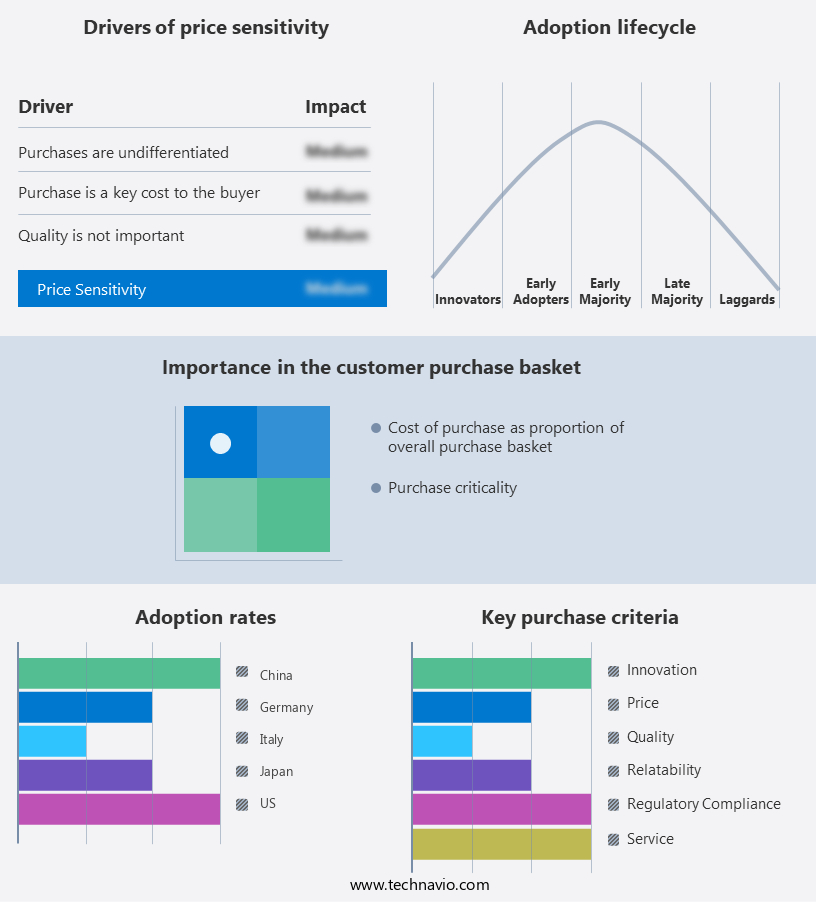
Customer Landscape of Laboratory Water Purifier Industry
Key Companies & Market Insights
Companies are implementing various strategies, such as strategic alliances, laboratory water purifier market forecast, partnerships, mergers and acquisitions, geographical expansion, and product/service launches, to enhance their presence in the industry.
Aqua Solutions Inc. - This company specializes in providing advanced water purification solutions, including Reverse Osmosis (RO), Deionization (DI), and Ultrapure Water Systems. These systems cater to various industries, ensuring high-quality water for critical applications. The company's expertise lies in delivering reliable, efficient, and sustainable water purification technologies.
The industry research and growth report includes detailed analyses of the competitive landscape of the market and information about key companies, including:
- Aqua Solutions Inc.
- Aurora Instruments
- Biobase
- Biosan
- Chengdu Ultrapure Technology Co., Ltd.
- Culligan International Company
- Cypress Diagnostics
- ELGA LabWater
- Eschmann Equipment
- Evoqua Water Technologies LLC
- F-DGSi
- Heal Force
- Labconco Corporation
- Merck KGaA
- Pall Corporation
- Panasonic Corporation
- Purite Ltd
- Sartorius AG
- Thermo Fisher Scientific Inc.
- Yamato Scientific Co., Ltd.
Qualitative and quantitative analysis of companies has been conducted to help clients understand the wider business environment as well as the strengths and weaknesses of key industry players. Data is qualitatively analyzed to categorize companies as pure play, category-focused, industry-focused, and diversified; it is quantitatively analyzed to categorize companies as dominant, leading, strong, tentative, and weak.
Recent Development and News in Laboratory Water Purifier Market
- In January 2024, MilliporeSigma, a leading life science company, launched the SARTORius Lab Water System, a new laboratory water purification system designed to meet the increasing demand for high-purity water in research and development applications (MilliporeSigma Press Release).
- In March 2024, Thermo Fisher Scientific, a global biotech product development company, announced a strategic partnership with Veolia Water Technologies to provide integrated water purification solutions for the life sciences industry (Thermo Fisher Scientific Press Release).
- In May 2024, Pall Corporation, a global leader in filtration, sealed the acquisition of Arix Water, a leading provider of water treatment solutions for the laboratory market, for approximately USD325 million (Pall Corporation SEC Filing).
- In February 2025, the European Union (EU) adopted new regulations on water reuse, which will significantly increase the demand for advanced water purification technologies in laboratories (European Commission Press Release).
Research Analyst Overview
- The market encompasses a wide range of technologies and applications, driven by the continuous demand for ultrapure water production in various sectors. A key process in this market is the aeration process, which introduces air into water to enhance the dissolved oxygen level and facilitate chemical reactions during pre-treatment stages. Ultrapure water production is a critical requirement in numerous industries, including pharmaceuticals, semiconductors, and research laboratories. To achieve this level of water purity, ultraviolet (UV) sterilization is often employed to eliminate bacterial contamination. This process uses UV light to disrupt the DNA of microorganisms, rendering them harmless.
- Dissolved solids removal is another essential aspect of water purification, which can be accomplished through cartridge filters and pre-treatment stages. These stages may include coagulation, flocculation, and sedimentation, followed by filtration to remove particles and impurities. Maintenance procedures are crucial in ensuring the continued efficiency and effectiveness of water purification systems. Regular cleaning, replacement of cartridge filters, and monitoring of water quality parameters, such as resistivity, conductivity, and total organic carbon (TOC), are essential. Water purity level is a primary concern in the market, with particle filtration playing a significant role in achieving the desired purity.
- Reverse osmosis and ultrafiltration membranes are commonly used for this purpose, with membrane fouling and life cycle being essential considerations. The water purification technologies market is expected to grow at a significant rate, with industry analysts projecting a growth of over 10% annually. This growth is driven by increasing water scarcity, stringent regulations, and the ongoing development of advanced water purification technologies, such as deionization processes, flow rate control, and system automation. In post-treatment steps, water quality parameters like pH, temperature, and system efficiency are monitored to ensure consistent water quality. Pressure regulation and energy consumption are also critical factors in the design and operation of water purification systems.
- The integration of water purification technologies, such as UV sterilization, dissolved solids removal, and particle filtration, enables the production of high-purity water for various applications. These technologies contribute to the ongoing evolution of the market and its applications across diverse industries.
Dive into Technavio’s robust research methodology, blending expert interviews, extensive data synthesis, and validated models for unparalleled Laboratory Water Purifier Market insights. See full methodology.
|
Market Scope |
|
|
Report Coverage |
Details |
|
Page number |
173 |
|
Base year |
2023 |
|
Historic period |
2018-2022 |
|
Forecast period |
2024-2028 |
|
Growth momentum & CAGR |
Accelerate at a CAGR of 8.09% |
|
Market growth 2024-2028 |
USD 3056.9 million |
|
Market structure |
Fragmented |
|
YoY growth 2023-2024(%) |
7.32 |
|
Key countries |
US, China, Germany, Italy, and Japan |
|
Competitive landscape |
Leading Companies, Market Positioning of Companies, Competitive Strategies, and Industry Risks |
What are the Key Data Covered in this Laboratory Water Purifier Market Research and Growth Report?
- CAGR of the Laboratory Water Purifier industry during the forecast period
- Detailed information on factors that will drive the growth and forecasting between 2024 and 2028
- Precise estimation of the size of the market and its contribution of the industry in focus to the parent market
- Accurate predictions about upcoming growth and trends and changes in consumer behaviour
- Growth of the market across Europe, APAC, North America, South America, and Middle East and Africa
- Thorough analysis of the market’s competitive landscape and detailed information about companies
- Comprehensive analysis of factors that will challenge the laboratory water purifier market growth of industry companies
We can help! Our analysts can customize this laboratory water purifier market research report to meet your requirements.
 RIA -
RIA - 
