
Marketing Consulting Market Size 2026-2030
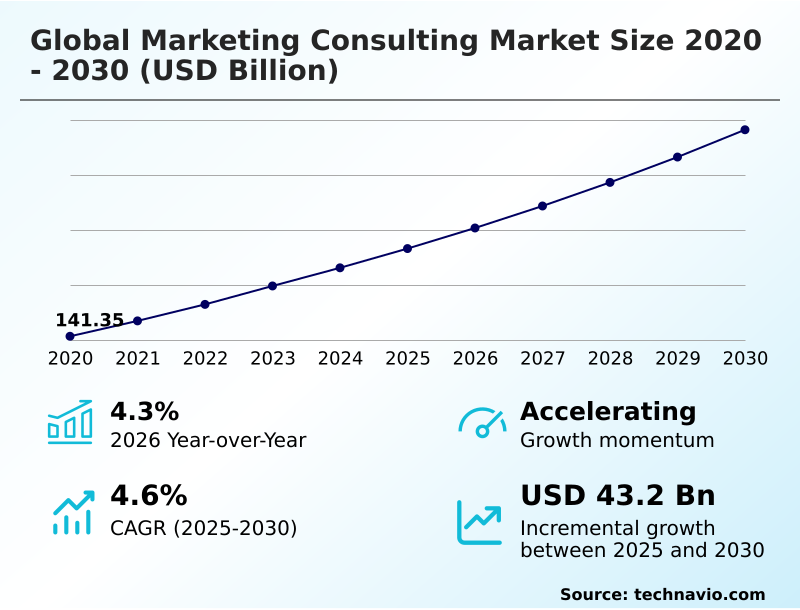
The marketing consulting market size is valued to increase by USD 43.20 billion, at a CAGR of 4.6% from 2025 to 2030. Digital transformation and Artificial intelligence chatbot integration will drive the marketing consulting market.
Major Market Trends & Insights
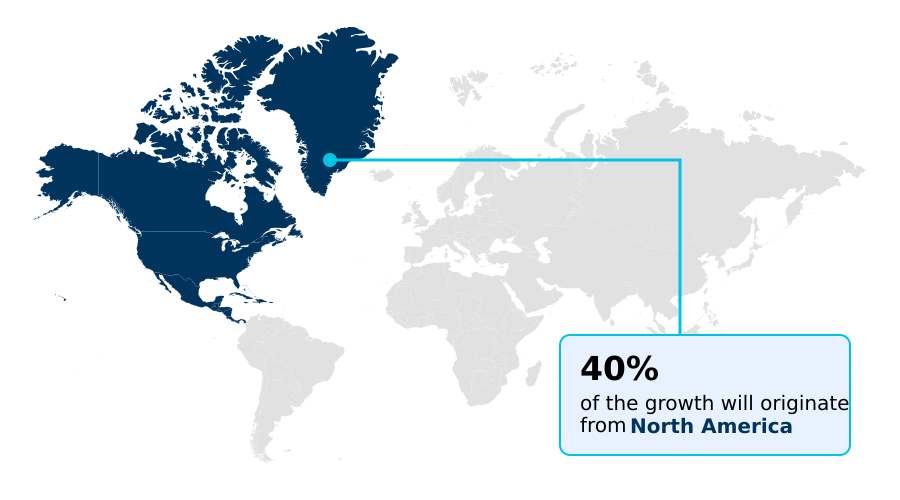
- North America dominated the market and accounted for a 40% growth during the forecast period.
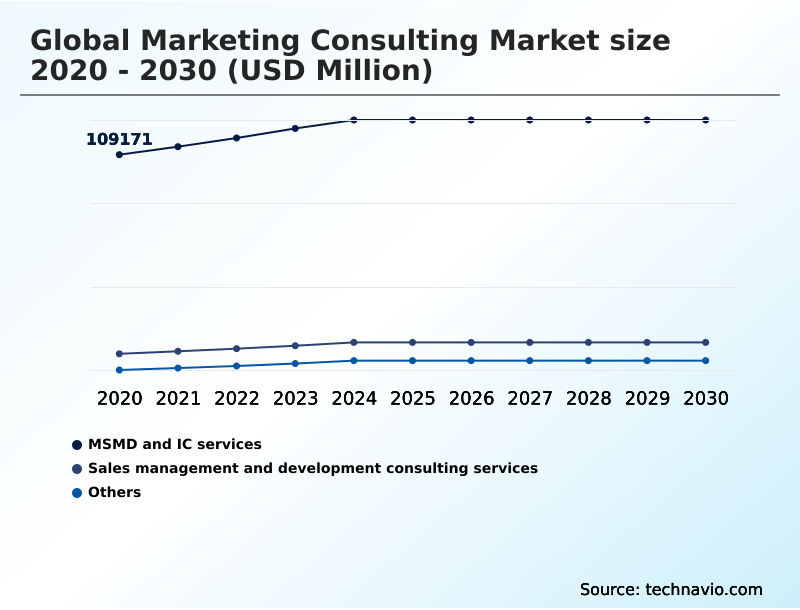
- By Service - MSMD and IC services segment was valued at USD 124.75 billion in 2024
- By Application - Automotive segment accounted for the largest market revenue share in 2024
Market Size & Forecast
- Market Opportunities: USD 75.10 billion
- Market Future Opportunities: USD 43.20 billion
- CAGR from 2025 to 2030 : 4.6%
Market Summary
- The marketing consulting market provides professional advisory services to help organizations design, optimize, and execute strategies for customer acquisition, retention, and growth. This ecosystem is defined by data-driven marketing and customer-centric strategies, where firms leverage advanced marketing analytics and predictive analytics to inform brand positioning and customer journey mapping.
- A key driver is the ongoing digital transformation, compelling businesses to adopt marketing automation and omnichannel marketing to remain competitive. For instance, a consumer goods company launching a new product line may engage consultants to develop a comprehensive go-to-market strategy that integrates influencer marketing with performance marketing, ensuring a cohesive customer experience management approach.
- However, the industry faces challenges from rising competition from in-house teams and a persistent talent scarcity for specialized roles in marketing technology and generative AI. The market's evolution is shaped by the need for privacy-first marketing frameworks, emphasizing first-party data and consent-based engagement to build brand reputation and trust in a complex digital landscape.
What will be the Size of the Marketing Consulting Market during the forecast period?
Get Key Insights on Market Forecast (PDF) Get Free Sample
How is the Marketing Consulting Market Segmented?
The marketing consulting industry research report provides comprehensive data (region-wise segment analysis), with forecasts and estimates in "USD million" for the period 2026-2030, as well as historical data from 2020-2024 for the following segments.
- Service
- MSMD and IC services
- Sales management and development consulting services
- Others
- Application
- Automotive
- Chemicals
- Machine industry
- Others
- Type
- Project-based
- Retainer-based
- On-demand
- Geography
- North America
- US
- Canada
- Mexico
- Europe
- Germany
- France
- UK
- APAC
- China
- Japan
- India
- Middle East and Africa
- UAE
- Saudi Arabia
- South Africa
- South America
- Brazil
- Argentina
- Colombia
- Rest of World (ROW)
- North America
By Service Insights
The msmd and ic services segment is estimated to witness significant growth during the forecast period.
The market is segmented by services including marketing strategy, market development, and integrated communications (MSMD and IC). This segment focuses on aligning digital strategy with creative execution to deliver unified brand messaging across all channels.
Organizations leverage marketing analytics and customer-centric strategies to support market development, particularly for geographic expansion where understanding local context is crucial.
The emphasis is on marketing effectiveness, utilizing real-time insights for personalized communications, which has been shown to improve campaign consistency by over 25%.
Consultants guide market entry through detailed research and support brand health by aligning marketing objectives with broader business strategy, ensuring a cohesive brand experience design to drive differentiation.
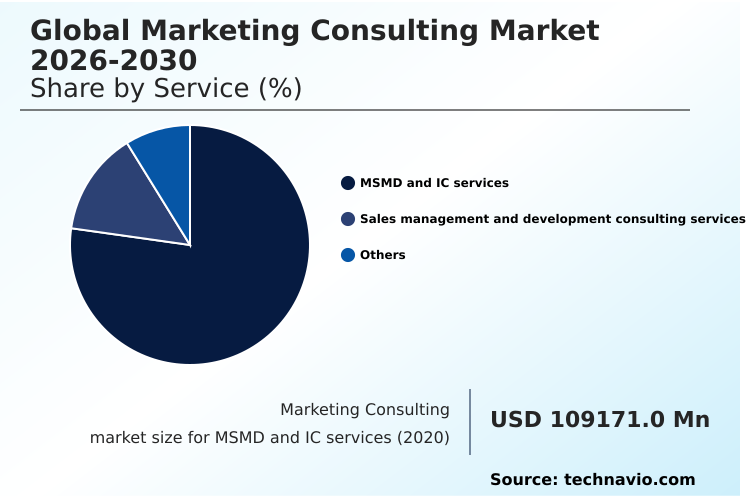
The MSMD and IC services segment was valued at USD 124.75 billion in 2024 and showed a gradual increase during the forecast period.
Regional Analysis
North America is estimated to contribute 40% to the growth of the global market during the forecast period.Technavio’s analysts have elaborately explained the regional trends and drivers that shape the market during the forecast period.
See How Marketing Consulting Market Demand is Rising in North America Get Free Sample
The global marketing consulting market exhibits distinct regional dynamics, with North America contributing over 40% of the incremental growth, driven by mature adoption of advanced technologies.
Europe shows strong growth, with a regional CAGR of 5.0%, led by demand for privacy-compliant and sustainable branding strategies in countries like Germany and the UK.
APAC is the fastest-growing region, fueled by rapid digitalization in China and India, where mobile-first personalization and e-commerce integration are paramount. Specialized advisory for digital product launch strategies and maintaining brand health is crucial across all regions.
The Middle East and Africa and South America are emerging markets, with increasing demand for foundational digital advisory and customer engagement innovation to capitalize on growing consumer markets.
Market Dynamics
Our researchers analyzed the data with 2025 as the base year, along with the key drivers, trends, and challenges. A holistic analysis of drivers will help companies refine their marketing strategies to gain a competitive advantage.
- Navigating the modern marketing landscape requires specialized expertise in several key areas. Integrating AI for marketing campaign optimization is no longer optional, as it provides a significant competitive edge. Organizations are actively developing first-party data collection strategies to build direct consumer relationships in a privacy-focused world.
- A primary objective is measuring marketing ROI with advanced analytics to justify expenditures and guide strategic pivots. To achieve this, businesses are implementing omnichannel customer journey personalization, a complex task that demands sophisticated technology and data integration. Success in this area is closely linked to building brand trust through purpose-driven marketing, which resonates with today's consumers.
- Internally, aligning sales and marketing for revenue growth is a critical operational goal. Advanced firms are leveraging predictive analytics for customer segmentation to enhance targeting precision. This data-driven approach informs how to optimize go-to-market strategies for B2B and manage brand reputation in digital channels. Ultimately, these efforts aim to enhance customer lifetime value via personalization.
- Firms that master using generative AI for scalable content creation while navigating data privacy in personalized marketing have demonstrated a 25% higher campaign performance. This includes improving demand generation with marketing automation and designing customer-centric digital transformation roadmaps.
- Expertise is also needed in evaluating marketing effectiveness across channels, executing project-based digital product launches, maintaining brand health with retainer-based advisory, supporting commercial excellence in sales operations, driving revenue growth strategy with customer analytics, and managing global awareness campaigns effectively.
What are the key market drivers leading to the rise in the adoption of Marketing Consulting Industry?
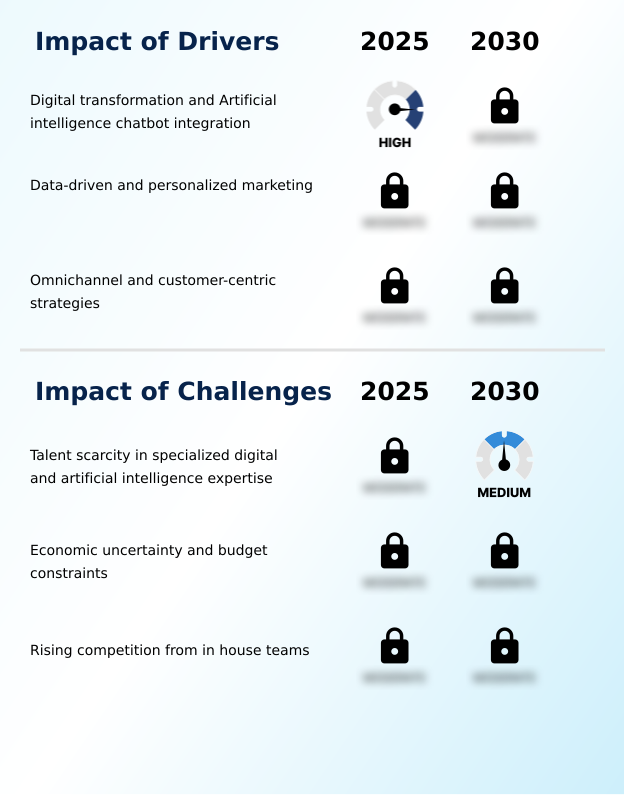
- The imperative for digital transformation and the integration of artificial intelligence technologies like chatbots serve as a significant driver propelling market expansion.
- The market is propelled by the imperative for digital transformation, which necessitates a move toward data-driven marketing and customer-centric strategies. Organizations are leveraging marketing analytics and marketing automation to gain deeper insights into consumer behavior, enabling precise customer segmentation.
- This approach boosts conversion rates by up to 20% and increases customer retention by 10%. The adoption of omnichannel marketing, supported by advanced marketing technology, ensures a consistent and personalized brand experience.
- Advisory services guide the implementation of these integrated systems, helping clients achieve significant performance improvement and a stronger competitive position through enhanced customer engagement innovation and data-backed decision-making.
What are the market trends shaping the Marketing Consulting Industry?
- A central trend influencing the market is the rise of sustainability and purpose-driven branding advisory. This shift compels organizations to integrate environmental, social, and governance factors into their core marketing strategies.
- Key trends are reshaping the marketing consulting landscape, led by the integration of generative AI to enhance content strategy and campaign ideation. This technology enables the scaled creation of personalized assets, with early adopters reporting a 40% improvement in content production efficiency.
- Concurrently, the shift to privacy-first marketing is driving the adoption of first-party data models and sophisticated customer relationship management systems. This focus on consent-based engagement helps organizations build consumer trust while reducing compliance risks by over 15%.
- Advisory in digital experience management is also gaining prominence, as businesses aim to deliver seamless, high-quality interactions across all touchpoints, directly influencing brand reputation and customer loyalty.
What challenges does the Marketing Consulting Industry face during its growth?
- Talent scarcity in specialized digital and artificial intelligence expertise presents a critical challenge that constrains market growth and service scalability.
- The industry faces notable challenges, including intense competition from in-house teams equipped with accessible marketing technology. This trend is compelling consulting firms to shift focus from execution to high-value strategic guidance in areas like go-to-market strategy and sales and marketing alignment.
- Talent scarcity for specialized roles in predictive analytics and account-based marketing further complicates service delivery, increasing talent acquisition costs by nearly 30%. Economic pressures also lead clients to prioritize short-term, measurable outcomes, resulting in a 15% shift toward project-based engagements over long-term retainers. Consultants must demonstrate clear ROI and commercial effectiveness to secure business in this environment.
Exclusive Technavio Analysis on Customer Landscape
The marketing consulting market forecasting report includes the adoption lifecycle of the market, covering from the innovator’s stage to the laggard’s stage. It focuses on adoption rates in different regions based on penetration. Furthermore, the marketing consulting market report also includes key purchase criteria and drivers of price sensitivity to help companies evaluate and develop their market growth analysis strategies.
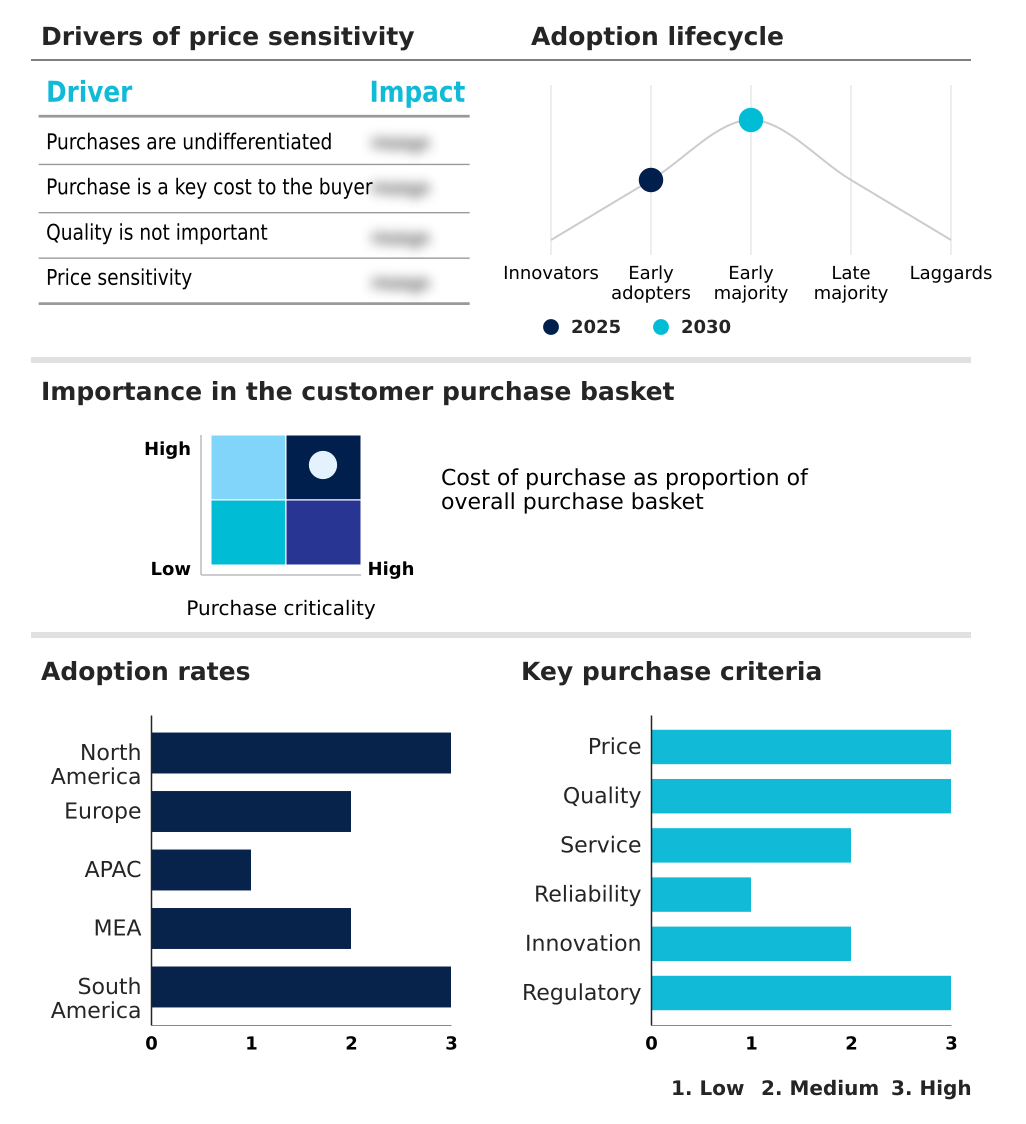
Customer Landscape of Marketing Consulting Industry
Competitive Landscape
Companies are implementing various strategies, such as strategic alliances, marketing consulting market forecast, partnerships, mergers and acquisitions, geographical expansion, and product/service launches, to enhance their presence in the industry.
Accenture Plc - Offers data-driven marketing transformation, focusing on digital customer experience, technology integration, and end-to-end go-to-market optimization across industries to achieve commercial excellence.
The industry research and growth report includes detailed analyses of the competitive landscape of the market and information about key companies, including:
- Accenture Plc
- Alvarez and Marsal Holdings
- Bain and Co. Inc.
- BearingPoint Holding BV
- Boston Consulting Group Inc.
- Cedar Management Consulting
- Deloitte Touche Tohmatsu Ltd.
- Elixirr International plc
- Ernst and Young Global Ltd.
- KPMG International Ltd.
- L.E.K. Consulting LLC
- McKinsey and Co.
- Nextcontinent
- OC and C Strategy Consultants
- PricewaterhouseCoopers LLP
- RGA Media Group Inc.
- The Nielsen Co. LLC
- YCP Holdings Ltd.
- ZS Associates Inc.
Qualitative and quantitative analysis of companies has been conducted to help clients understand the wider business environment as well as the strengths and weaknesses of key industry players. Data is qualitatively analyzed to categorize companies as pure play, category-focused, industry-focused, and diversified; it is quantitatively analyzed to categorize companies as dominant, leading, strong, tentative, and weak.
Recent Development and News in Marketing consulting market
- In February 2024, Accenture acquired The Lumery, a marketing technology consultancy, to enhance its capabilities in customer experience and integrated digital transformation services.
- In April 2024, PwC acquired Surfaceink, a product design and engineering consultancy, to bolster its data analytics capabilities for creating data-driven, personalized product and marketing strategies.
- In May 2024, Boston Consulting Group initiated a partnership with Adobe to launch an omnichannel marketing initiative, strengthening its consulting services in digital experience management and unified customer engagement.
- In June 2024, Bain and Company acquired the consulting division of Max Kelsen, an artificial intelligence firm, to expand its expertise in applying machine learning to marketing analytics for data insights and campaign optimization.
Dive into Technavio’s robust research methodology, blending expert interviews, extensive data synthesis, and validated models for unparalleled Marketing Consulting Market insights. See full methodology.
| Market Scope | |
|---|---|
| Page number | 303 |
| Base year | 2025 |
| Historic period | 2020-2024 |
| Forecast period | 2026-2030 |
| Growth momentum & CAGR | Accelerate at a CAGR of 4.6% |
| Market growth 2026-2030 | USD 43197.4 million |
| Market structure | Fragmented |
| YoY growth 2025-2026(%) | 4.3% |
| Key countries | US, Canada, Mexico, Germany, France, UK, Italy, Spain, The Netherlands, China, Japan, India, South Korea, Australia, Indonesia, UAE, Saudi Arabia, South Africa, Turkey, Israel, Brazil, Argentina and Colombia |
| Competitive landscape | Leading Companies, Market Positioning of Companies, Competitive Strategies, and Industry Risks |
Research Analyst Overview
- The marketing consulting market is characterized by a strategic shift toward technology-led advisory, where digital transformation is central to achieving a competitive edge. Firms are increasingly focused on deploying generative AI and predictive analytics to redefine customer experience management and content strategy. The integration of marketing automation and customer relationship management systems enables a highly personalized, omnichannel marketing approach.
- This is crucial for effective customer journey mapping and demand generation. Consultants guide organizations in building robust, data-driven marketing frameworks that utilize first-party data, ensuring compliance with privacy-first marketing standards. Expertise in sales force automation and account-based marketing helps align sales and marketing functions, directly impacting revenue.
- A key value proposition is the ability to craft a comprehensive go-to-market strategy that includes sophisticated brand positioning and customer segmentation, with some firms achieving a 30% reduction in campaign launch times. Offerings also cover performance marketing, influencer marketing, and brand reputation management to deliver holistic solutions.
What are the Key Data Covered in this Marketing Consulting Market Research and Growth Report?
-
What is the expected growth of the Marketing Consulting Market between 2026 and 2030?
-
USD 43.20 billion, at a CAGR of 4.6%
-
-
What segmentation does the market report cover?
-
The report is segmented by Service (MSMD and IC services, Sales management and development consulting services, and Others), Application (Automotive, Chemicals, Machine industry, and Others), Type (Project-based, Retainer-based, and On-demand) and Geography (North America, Europe, APAC, Middle East and Africa, South America)
-
-
Which regions are analyzed in the report?
-
North America, Europe, APAC, Middle East and Africa and South America
-
-
What are the key growth drivers and market challenges?
-
Digital transformation and Artificial intelligence chatbot integration, Talent scarcity in specialized digital and artificial intelligence expertise
-
-
Who are the major players in the Marketing Consulting Market?
-
Accenture Plc, Alvarez and Marsal Holdings, Bain and Co. Inc., BearingPoint Holding BV, Boston Consulting Group Inc., Cedar Management Consulting, Deloitte Touche Tohmatsu Ltd., Elixirr International plc, Ernst and Young Global Ltd., KPMG International Ltd., L.E.K. Consulting LLC, McKinsey and Co., Nextcontinent, OC and C Strategy Consultants, PricewaterhouseCoopers LLP, RGA Media Group Inc., The Nielsen Co. LLC, YCP Holdings Ltd. and ZS Associates Inc.
-
Market Research Insights
- The market's momentum is driven by a focus on tangible outcomes, with advisory services centered on commercial effectiveness and revenue growth strategy. Firms leverage deep customer analytics and pricing optimization to deliver measurable performance improvement, with successful engagements showing a 20% uplift in marketing effectiveness.
- By focusing on customer engagement innovation and brand experience design, consultants help clients improve customer lifetime value by over 15%. Advisory extends to optimizing digital advertising and audience measurement to refine brand performance analytics. The adoption of creative-led business transformation and sales and marketing alignment frameworks ensures that strategies are both innovative and commercially viable, leading to enhanced commercial excellence.
We can help! Our analysts can customize this marketing consulting market research report to meet your requirements.
 RIA -
RIA - 
