Mechanically Separated Meat Market Size 2024-2028
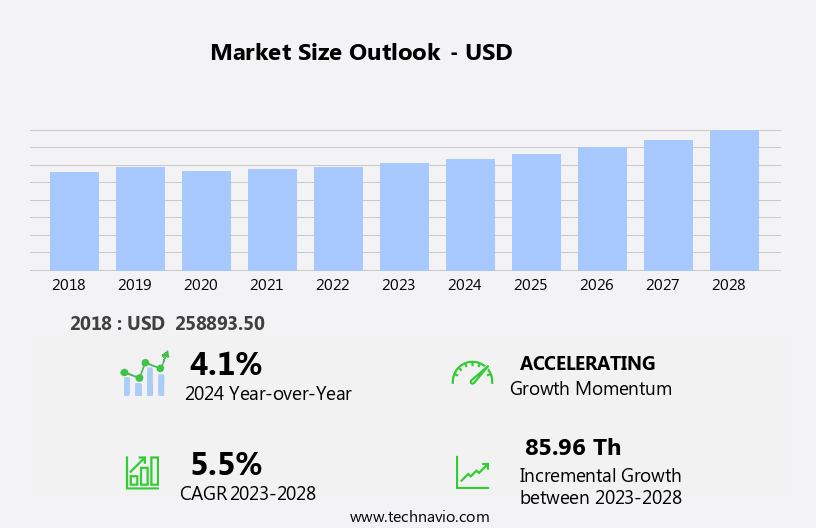
The mechanically separated meat market size is forecast to increase by USD 85.96 th, at a CAGR of 5.5% between 2023 and 2028.
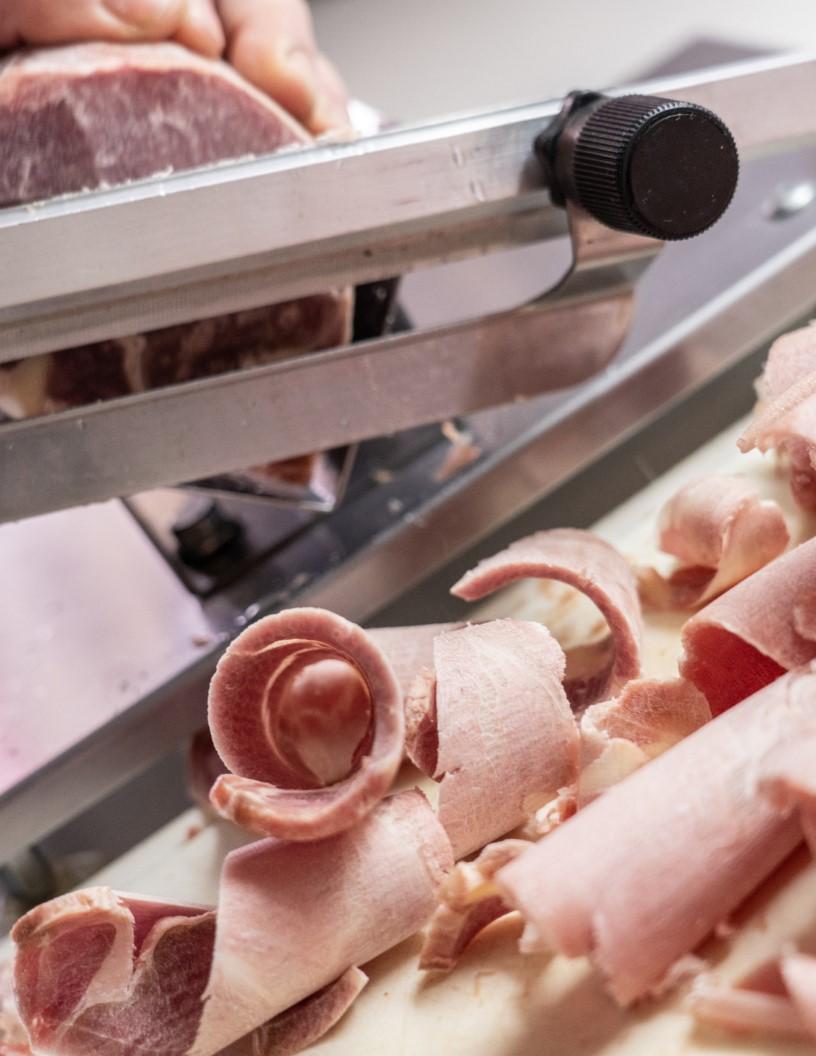
- The Mechanically Separated Meat (MSMeat) market is driven by the rising trend of high meat consumption and the growing demand for processed foods. Consumers' preference for convenient and affordable protein sources continues to fuel the market's growth. However, the industry faces significant challenges, including potential product recalls. The risk of contamination in MSMeat production can lead to costly recalls and damage to brand reputation. Companies must invest in robust quality control measures and adhere to stringent regulatory standards to mitigate these risks and maintain consumer trust.
- Navigating these challenges while capitalizing on the market's growth potential requires strategic planning and a commitment to operational excellence. Companies that prioritize food safety and quality will be well-positioned to succeed in the evolving MSMeat market landscape.
What will be the Size of the Mechanically Separated Meat Market during the forecast period?
Explore in-depth regional segment analysis with market size data - historical 2018-2022 and forecasts 2024-2028 - in the full report.
Request Free Sample
The market continues to evolve, driven by advancements in meat separation technology and the quest for improved product quality and sustainability. This dynamic industry focuses on enhancing various aspects of meat processing, from color stability and freezing protocols to nutritional value enhancement and oxidative stability. Automated separation systems are increasingly adopted for their ability to optimize product yield, ensuring consistent quality control metrics. Byproduct utilization is another key area of innovation, with a focus on reducing fat content and maximizing muscle fiber extraction. Legal compliance standards and waste management strategies are integral to market operations, with chilling methods and distribution logistics ensuring product freshness and food safety.
Ongoing research and development efforts aim to extend shelf life through advanced storage conditions and emulsion stability evaluation. Product yield optimization and sensory attributes evaluation are also critical, as consumer acceptance testing and cost reduction strategies shape market trends. Functional properties evaluation and processing efficiency improvements are essential for maintaining competitive edge. Innovations in meat processing equipment, pasteurization techniques, and packaging technologies continue to reshape the industry landscape, with a focus on improving ingredient functionality and texture modification techniques. Protein denaturation and microbial contamination control are ongoing challenges, with protein recovery methods and ingredient labeling requirements playing a crucial role in addressing these issues.
How is this Mechanically Separated Meat Industry segmented?
The mechanically separated meat industry research report provides comprehensive data (region-wise segment analysis), with forecasts and estimates in "USD thousand" for the period 2024-2028, as well as historical data from 2018-2022 for the following segments.
- Product
- Poultry
- Pork
- Type
- Fresh
- Frozen
- Application
- Sausages
- Hot Dogs
- Nuggets
- Others
- Distribution Channel
- B2B
- Supermarkets
- Online Retail
- Foodservice
- Geography
- North America
- US
- Canada
- Mexico
- Europe
- France
- Germany
- Russia
- Spain
- UK
- Middle East and Africa
- UAE
- APAC
- China
- Japan
- South America
- Brazil
- Rest of World (ROW)
- North America
By Product Insights
The poultry segment is estimated to witness significant growth during the forecast period.
The market, specifically in the poultry sector, is witnessing substantial growth due to the escalating global consumption of chicken meat. Poultry processors are under increasing pressure to optimize the use of the entire chicken carcass and minimize waste. Mechanically separated chicken meat (MSCM) is a crucial solution, extracting additional protein and meat from bones and cartilage that would otherwise be discarded. This not only boosts the efficiency of poultry processing but also advances industry sustainability. Advancements in meat separation technology are improving product quality and safety, making poultry products more desirable for manufacturers and consumers. These advancements include automated separation systems, which ensure consistent quality control metrics, and emulsion stability, which enhances the texture and taste of the final product.
Additionally, product yield optimization and nutritional value enhancement are key benefits, as MSCM can be used in various applications, from pet food to human consumption. Legal compliance standards and waste management strategies are essential considerations in the market. Proper chilling methods and distribution logistics help maintain water holding capacity, color stability, and oxidative stability, while adhering to food safety regulations. Furthermore, bone removal processes and protein denaturation techniques are essential for maintaining product quality and reducing microbial contamination. Ingredient functionality and pasteurization techniques are essential aspects of the market, with ingredient labeling requirements ensuring transparency for consumers. Texture modification techniques and protein recovery methods contribute to cost reduction strategies and improved processing efficiency. Consumer acceptance testing and sensory attributes evaluation are crucial for maintaining consumer perception and market competitiveness.
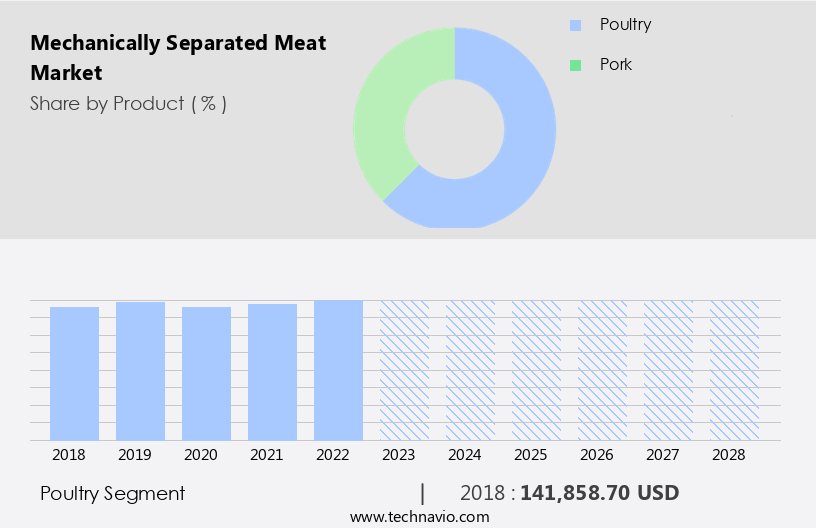
The Poultry segment was valued at USD 141858.70 th in 2018 and showed a gradual increase during the forecast period.
Regional Analysis
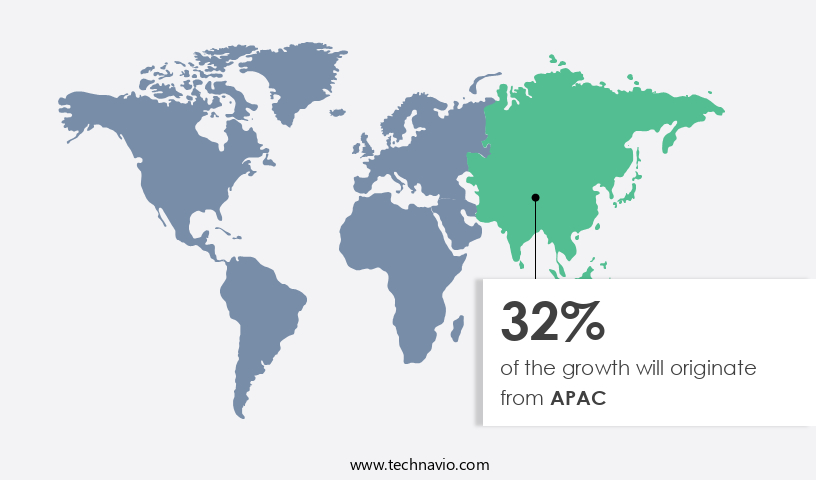
APAC is estimated to contribute 32% to the growth of the global market during the forecast period.Technavio's analysts have elaborately explained the regional trends and drivers that shape the market during the forecast period.
The mechanically separated meat (MSM) market in Europe is witnessing significant growth, fueled by the region's deep-rooted cultural attachment to meat. Traditional European diets incorporate a substantial amount of meat, both fresh and processed. MSM is utilized extensively in the production of various processed meat products, such as sausages, patties, and ready-to-eat meals, which are popular consumer favorites. MSM's role in the production of these items is vital, driving demand for this meat processing technology. The European market prioritizes product quality, leading to the adoption of advanced meat separation technology and automated systems. These innovations ensure improved quality control metrics, extended shelf life, and optimized product yield of meat.
Storage conditions and fat content reduction are essential considerations for MSM producers. Proper freezing protocols and nutritional value enhancement are crucial to maintain color stability and oxidative stability. Legal compliance standards, waste management strategies, and chilling methods are essential aspects of the production process. Food safety regulations, emulsion stability, and functional properties evaluation are key concerns for manufacturers. Processing efficiency improvements, consumer acceptance testing, and cost reduction strategies are essential to remain competitive. The market also focuses on microbial contamination control, packaging technologies, bone removal process, protein denaturation, ingredient functionality, and pasteurization techniques. Protein recovery methods and texture modification techniques are essential to cater to evolving consumer preferences and requirements. Ingredient labeling requirements are becoming increasingly stringent, necessitating transparency and accuracy in product information. Overall, the European MSM market is dynamic and evolving, with a strong focus on innovation, quality, and consumer satisfaction.
Market Dynamics
Our researchers analyzed the data with 2023 as the base year, along with the key drivers, trends, and challenges. A holistic analysis of drivers will help companies refine their marketing strategies to gain a competitive advantage.
B2B MSM strategies leverage protein recovery technologies for processed foods. MSM prospects 2024 include MSM for pet food manufacturers and MSM-based sausages, boosting demand. MSM logistics analytics optimize supply, while MSM benchmarks highlight Tyson Foods. Sustainable MSM sourcing aligns with cost-effective protein trends. MSM regulations 2024-2028 steer MSM demand in Europe 2024. Premium MSM products and MSM market forecasts fuel expansion. MSM for processed meats and custom MSM blends target niches. MSM hurdles and innovations address quality concerns, with MSM supplier networks and MSM cost tactics enhancing profitability. MSM market insights and protein recovery breakthroughs accelerate momentum.
What are the key market drivers leading to the rise in the adoption of Mechanically Separated Meat Industry?
- High meat consumption serves as the primary driver for the market's growth.
- The market experiences continuous growth due to the increasing consumption of meat, particularly in countries like Argentina and Mexico. According to the USDA Global Agricultural Information Network (GAIN) report, Argentine chicken consumption is projected to reach 2.37 MMT by 2025, driven by its price competitiveness and preference as a protein source. In Mexico, meat consumption is anticipated to increase over the next decade, with a combined projection of 82 MMT for poultry, pork, and beef. Meat separation technology plays a crucial role in this market, enabling the efficient extraction of meat from carcasses while preserving rheological properties.
- Automated separation systems ensure consistent quality control metrics, extending shelf life through optimal water holding capacity and storage conditions. Fat content reduction and muscle fiber extraction are essential considerations in this process, ensuring the final product maintains desirable textural and sensory attributes. Byproduct utilization is another critical factor, as the industry seeks to minimize waste and maximize efficiency. The market's dynamics are further influenced by the demand for leaner, healthier meat options and the ongoing research and development in meat processing technologies.
What are the market trends shaping the Mechanically Separated Meat Industry?
- The increasing preference for convenience and time-saving options has led to a significant growth in the demand for processed foods. This trend is expected to continue shaping the market in the upcoming years.
- The mechanically separated meat (MSM) market is witnessing notable growth due to the rising demand for convenient and ready-to-eat food products. Consumers' busy lifestyles have led to an increased preference for quick meal solutions, making MSM an essential ingredient in various processed meat items, such as sausages, nuggets, and deli meats. Additionally, the trend toward protein-rich snack foods has fueled the usage of MSM in snack products. Manufacturers are focusing on optimizing product yield, preserving color stability, and enhancing nutritional value through various methods, including oxidative stability and chilling techniques. Strict adherence to legal compliance standards and efficient waste management strategies are also crucial aspects of the MSM production process.
- Moreover, proper freezing protocols and distribution logistics are essential to maintain the quality and freshness of MSM products. Fat oxidation is a significant challenge in the MSM market, and ongoing research is focused on developing methods to minimize its impact on the final product. In conclusion, the MSM market is experiencing significant growth due to the increasing demand for convenient and nutritious food options. Manufacturers are responding to this trend by focusing on product yield optimization, nutritional value enhancement, and maintaining strict quality control standards.
What challenges does the Mechanically Separated Meat Industry face during its growth?
- Product recalls pose a significant challenge to industry expansion. This issue, which involves the removal of defective products from the market, can negatively impact a company's reputation and financial standing, potentially leading to decreased sales and revenue. Effective management of product recalls requires a swift response, clear communication with customers, and a comprehensive plan for addressing the root cause of the issue to prevent future occurrences.
- The mechanically separated meat (MSM) market encounters notable challenges due to product recalls, which can negatively influence market growth. Food safety and quality consistency concerns have resulted in periodic MSM-related product recalls, causing consumer apprehension and eroding market confidence. These recalls, often triggered by bacterial contamination such as salmonella or listeria, can stem from inadequate processing or handling. The ensuing supply chain disruptions and brand reputation damage further hinder market expansion. Moreover, inconsistent product attributes, including texture, flavor, and appearance, can undermine consumer acceptance. To mitigate these challenges, ongoing research focuses on sensory attributes evaluation, functional properties assessment, and processing efficiency improvements.
- Consumer acceptance testing and cost reduction strategies are also crucial to maintaining market competitiveness. Microbial contamination control is a priority to ensure product safety and prevent future recalls. As the industry continues to evolve, adherence to stringent food safety regulations remains essential to restore consumer trust and foster market growth.
Exclusive Customer Landscape
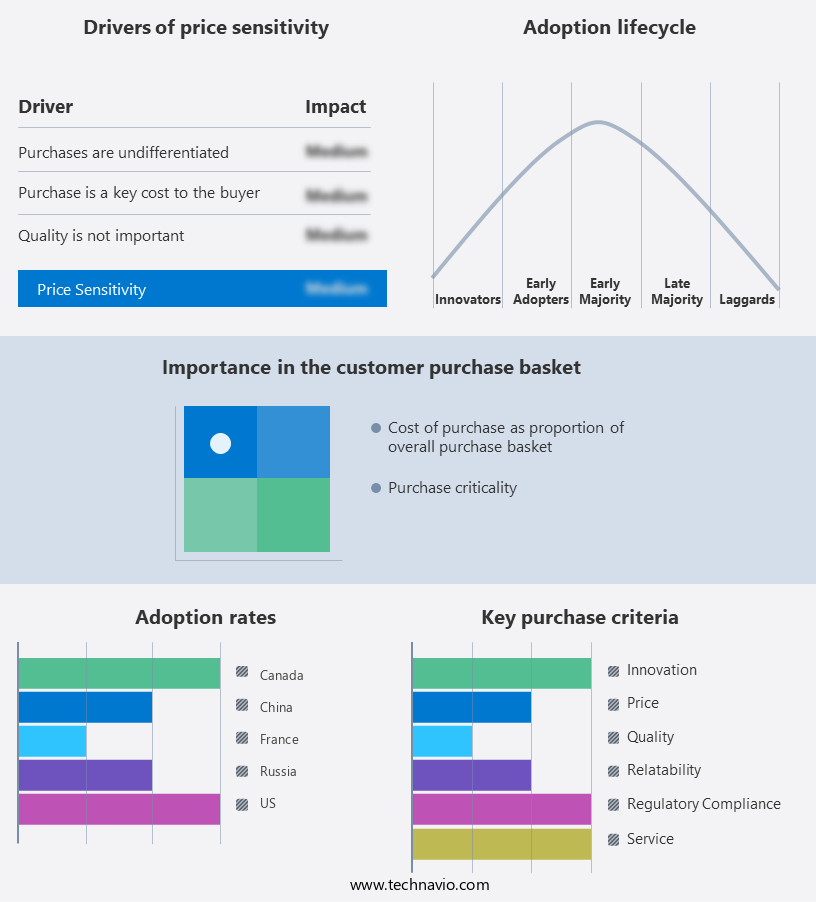
The mechanically separated meat market forecasting report includes the adoption lifecycle of the market, covering from the innovator's stage to the laggard's stage. It focuses on adoption rates in different regions based on penetration. Furthermore, the mechanically separated meat market report also includes key purchase criteria and drivers of price sensitivity to help companies evaluate and develop their market growth analysis strategies.
Customer Landscape
Key Companies & Market Insights
Companies are implementing various strategies, such as strategic alliances, mechanically separated meat market forecast, partnerships, mergers and acquisitions, geographical expansion, and product/service launches, to enhance their presence in the industry.
Argent Foods Ltd. - This company specializes in mechanically separated meat, produced through an advanced deboning process. Sourced from reputable abattoirs, the resulting meat is renowned for its consistent quality and reliability. Mechanically separated meat undergoes rigorous processing to ensure optimal texture and flavor, making it a preferred choice for various industries.
The industry research and growth report includes detailed analyses of the competitive landscape of the market and information about key companies, including:
- Argent Foods Ltd.
- Azelis SA
- Botham Bailey
- Crown Meat GmbH
- DTS Meat Processing NV
- Elfering Export GmbH
- GLORIA MALLORQUINA SA
- JBS SA
- Kam Yen Jan Foods
- Kipco Damaco NV
- Leroma GmbH
- Marel Group
- Polskamp Meat Industrie
- Trinity GMBH
- Tyson Foods Inc.
- Valmeat
Qualitative and quantitative analysis of companies has been conducted to help clients understand the wider business environment as well as the strengths and weaknesses of key industry players. Data is qualitatively analyzed to categorize companies as pure play, category-focused, industry-focused, and diversified; it is quantitatively analyzed to categorize companies as dominant, leading, strong, tentative, and weak.
Recent Development and News in Mechanically Separated Meat Market
- In January 2024, JBS USA, a leading global food company, announced the expansion of its mechanically separated meat production capacity by 30% at its Worthington, Minnesota, facility. This investment aimed to meet the growing demand for mechanically separated meat in the US market (JBS USA Press Release, 2024).
- In March 2024, Cargill and Danish Crown, two major players in the meat industry, entered into a strategic partnership to develop and commercialize plant-based meat alternatives using mechanically separated meat as a base. This collaboration was expected to leverage their combined expertise and resources to create competitive offerings in the rapidly growing plant-based meat market (Cargill Press Release, 2024).
- In May 2024, Pilgrim's Pride Corporation, the second-largest poultry producer in the US, completed the acquisition of Moy Park, a leading European poultry processing company. The acquisition expanded Pilgrim's Pride's international footprint and provided access to Moy Park's mechanically separated meat production capabilities (Pilgrim's Pride Corporation Press Release, 2024).
- In February 2025, the US Food and Drug Administration (FDA) approved the use of mechanically separated poultry in infant formula, expanding the applications of this product beyond the meat industry. This approval was a significant regulatory milestone, opening new opportunities for mechanically separated meat producers (FDA Press Release, 2025).
Research Analyst Overview
- In the mechanically separated poultry market, sustainability is a key trend as producers focus on efficient meat production. Finely textured meat, derived from muscle tissue recovery, addresses this need by increasing yield and reducing waste. Water binding capacity and protein degradation are critical factors in maintaining product quality during processing. Regulatory compliance and color measurement are essential for consumer acceptance, while organoleptic properties are assessed through product quality assessment. Refrigeration systems and packaging materials ensure product safety and shelf life. Advanced processing equipment optimizes process yield and improves nutrient retention methods. Consumer preferences for low-fat meat and value-added products drive innovation in the market.
- Novel protein sources and automated quality control are emerging trends, along with waste recycling techniques and emulsion characterization. Reduced waste production and supply chain management are crucial for cost-effective processing. Process optimization and food safety protocols are essential for maintaining product integrity. Protein functionality, lipid oxidation, texture analysis, and meat byproduct processing are ongoing research areas to enhance product quality and meet evolving consumer demands.
Dive into Technavio's robust research methodology, blending expert interviews, extensive data synthesis, and validated models for unparalleled Mechanically Separated Meat Market insights. See full methodology.
|
Market Scope |
|
|
Report Coverage |
Details |
|
Page number |
197 |
|
Base year |
2023 |
|
Historic period |
2018-2022 |
|
Forecast period |
2024-2028 |
|
Growth momentum & CAGR |
Accelerate at a CAGR of 5.5% |
|
Market growth 2024-2028 |
USD 85.96 thousand |
|
Market structure |
Fragmented |
|
YoY growth 2023-2024(%) |
4.1 |
|
Key countries |
China, US, Russia, France, Canada, Japan, Mexico, UK, Germany, and Spain |
|
Competitive landscape |
Leading Companies, Market Positioning of Companies, Competitive Strategies, and Industry Risks |
What are the Key Data Covered in this Mechanically Separated Meat Market Research and Growth Report?
- CAGR of the Mechanically Separated Meat industry during the forecast period
- Detailed information on factors that will drive the growth and forecasting between 2024 and 2028
- Precise estimation of the size of the market and its contribution of the industry in focus to the parent market
- Accurate predictions about upcoming growth and trends and changes in consumer behaviour
- Growth of the market across Europe, APAC, North America, South America, and Middle East and Africa
- Thorough analysis of the market's competitive landscape and detailed information about companies
- Comprehensive analysis of factors that will challenge the mechanically separated meat market growth of industry companies
We can help! Our analysts can customize this mechanically separated meat market research report to meet your requirements.
 RIA -
RIA - 
