
Meetings, Incentives, Conventions, And Exhibitions (MICE) Market Size 2025-2029
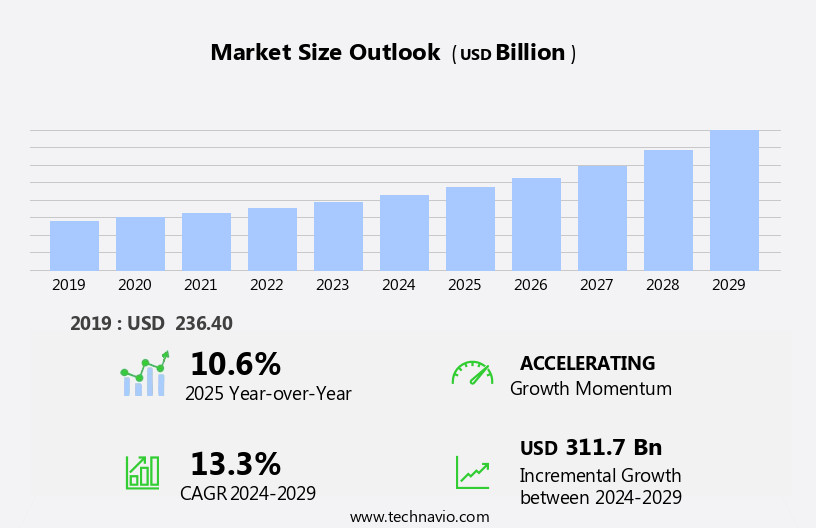
The meetings, incentives, conventions, and exhibitions market size is forecast to increase by USD 311.7 billion, at a CAGR of 13.3% between 2024 and 2029.
- The market is experiencing significant shifts, driven by the digitalization of travel digital payments and the rapid increase in globalization. These trends are transforming the way businesses conduct events, enabling more efficient and cost-effective solutions. However, the market faces challenges as well, with the growing threat of terrorism posing a significant risk to large gatherings. This necessitates heightened security measures and contingency planning for event organizers. As the business landscape continues to evolve, companies must adapt to these trends and challenges to capitalize on opportunities and effectively navigate the complexities of the MICE industry.
- Digitalization offers potential for streamlined operations and improved customer experience, while globalization broadens the reach and scope of events. Conversely, ensuring security and mitigating terrorism risks requires a strategic approach and robust contingency plans. By staying informed of these trends and challenges, businesses can position themselves to thrive in the dynamic MICE market.
What will be the Size of the Meetings, Incentives, Conventions, And Exhibitions (MICE) Market during the forecast period?
Explore in-depth regional segment analysis with market size data - historical 2019-2023 and forecasts 2025-2029 - in the full report.
Request Free Sample
The market continues to evolve, with dynamic market activities unfolding across various sectors. Corporate events integrate onsite registration, virtual events, attendee tracking, event security, event staffing, and seamless applications of incentive travel, venue selection, networking opportunities, speaker acquisition, team building activities, social media engagement, and more. These elements are not static, but rather, they continuously adapt to the ever-changing landscape of business needs and technological advancements. Onsite registration systems streamline attendee check-in processes, while virtual events offer expanded reach and accessibility. Attendee tracking tools provide valuable data for post-event analysis, enabling organizations to assess delegate satisfaction and optimize future events.
Event security measures ensure a safe and secure environment, while event staffing solutions provide professional and efficient support. Incentive travel programs motivate and reward top performers, driving productivity and employee engagement. Venue selection plays a crucial role in creating memorable experiences and leaving lasting impressions. Networking opportunities foster collaboration and relationship-building, while speaker acquisition and educational content contribute to knowledge transfer and skill development. Team building activities and social media engagement strengthen corporate culture and brand identity. Registration management, event management software, and destination management streamline logistics and enhance the overall event experience. Sustainability practices and badge printing ensure eco-consciousness and professionalism.
How is this Meetings, Incentives, Conventions, And Exhibitions (MICE) Industry segmented?
The meetings, incentives, conventions, and exhibitions (mice) industry research report provides comprehensive data (region-wise segment analysis), with forecasts and estimates in "USD billion" for the period 2025-2029, as well as historical data from 2019-2023 for the following segments.
- Type
- Meeting
- Incentive
- Exhibition
- Convention
- Service
- Hospitality
- Transportation
- Retail
- Entertainment
- Booking Type
- Online
- Offline
- End-User
- Corporate
- Associations
- Government
- Academic
- Geography
- North America
- US
- Canada
- Mexico
- Europe
- France
- Germany
- The Netherlands
- UK
- Middle East and Africa
- UAE
- APAC
- Australia
- China
- India
- Japan
- South Korea
- South America
- Brazil
- Rest of World (ROW)
- North America
By Type Insights
The meeting segment is estimated to witness significant growth during the forecast period.
Meetings, Incentives, Conferences, and Exhibitions (MICE) are essential for bringing individuals together to share ideas, collaborate, and solve problems. Various types of meetings, including board meetings, seminars, product launches, training sessions, and client interactions, foster teamwork and personal development. These events offer valuable opportunities for communication skill improvement and goal motivation. The expanding business landscape, resulting in increased job opportunities, is expected to fuel the demand for MICE. Moreover, digital marketing plays a crucial role in promoting these events, enabling onsite registration, attendee tracking, and virtual events. Event planning ensures a harmonious and immersive experience through brand activation, exhibition booth design, and catering services.
Post-event analysis provides essential feedback mechanisms for continuous improvement. Public relations and awards ceremonies recognize achievements and boost brand reputation. Networking opportunities, speaker acquisition, team building activities, and social media engagement further enhance the value of MICE. Event technology, including event management software, event security, and risk management, ensures a seamless experience. Incentive travel and sponsorship acquisition offer rewards and recognition. Venue selection and destination management cater to diverse preferences and sustainability practices. Educational content and hybrid events cater to diverse learning styles and accessibility needs. Data analytics and lead generation provide valuable insights for future planning.
Contract negotiation and audio visual equipment ensure efficient and effective event execution. Brand activation, exhibition space, and badge printing add to the overall experience. Overall, the MICE market is evolving to meet the dynamic needs of businesses and participants.
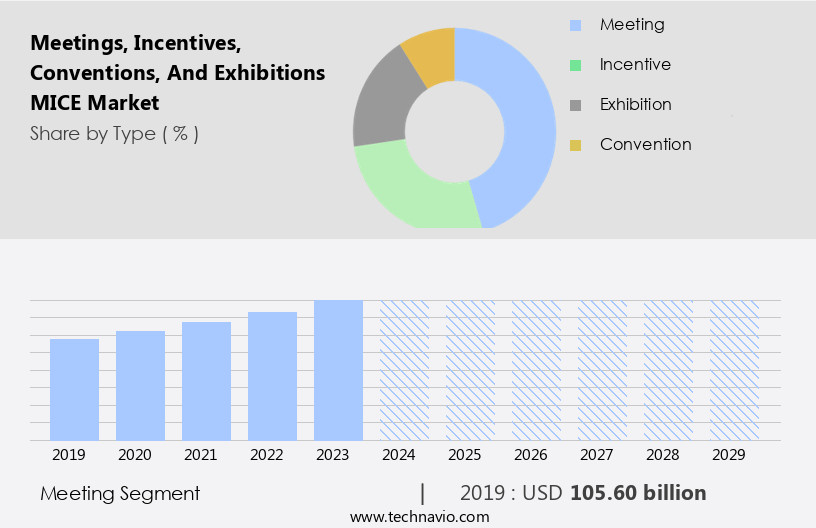
The Meeting segment was valued at USD 105.60 billion in 2019 and showed a gradual increase during the forecast period.
Regional Analysis
North America is estimated to contribute 37% to the growth of the global market during the forecast period.Technavio's analysts have elaborately explained the regional trends and drivers that shape the market during the forecast period.
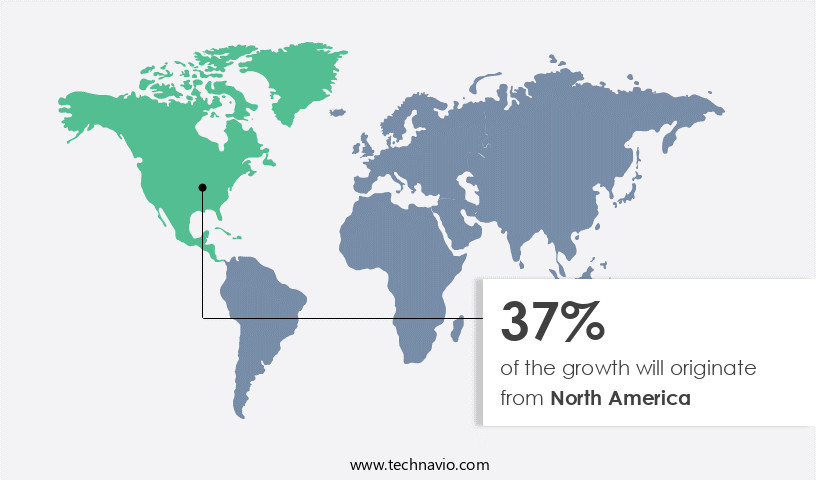
The Meetings, Incentives, Conferences, and Exhibitions (MICE) market in North America is witnessing significant growth, driven by various factors. Transportation logistics, including the intense competition between legacy and low-cost carriers, is leading to lower prices for business travelers. This price decrease, while offset by ancillary fees, is seen as an opportunity for revenue generation. Digital marketing plays a crucial role in event promotion and registration management, enabling seamless onsite and virtual attendance through event apps and registration software. Event planning, branding, and delegate satisfaction are key areas of focus, with experiential marketing and sustainability practices enhancing attendee engagement.
Public relations, awards ceremonies, and social media engagement help boost event prestige and reach. Speaker acquisition, team building activities, and networking opportunities foster collaboration and knowledge sharing. Data analytics and lead generation facilitate effective sponsorship acquisition and contract negotiation. Event technology, including audio-visual equipment and event management software, ensures smooth event execution. Venue selection, catering services, and destination management contribute to a memorable attendee experience. Hybrid events, educational content, and exhibition booth design showcase innovation and flexibility. Risk management and event security ensure a safe and secure environment for all participants.
Market Dynamics
Our researchers analyzed the data with 2024 as the base year, along with the key drivers, trends, and challenges. A holistic analysis of drivers will help companies refine their marketing strategies to gain a competitive advantage.
The market is a vibrant and dynamic sector that brings together professionals from various industries for collaboration, learning, and networking. This market encompasses a range of events, from small incentive trips to large-scale conventions and exhibitions. MICE events provide opportunities for businesses to showcase their products or services, build relationships, and incentivize top performers. They also offer attendees the chance to gain valuable industry insights, learn new skills, and expand their professional networks. The MICE industry caters to diverse needs, including accommodation, transportation, catering, and technical support. By fostering innovation, collaboration, and growth, the MICE market plays a crucial role in driving economic development and business success.
What are the key market drivers leading to the rise in the adoption of Meetings, Incentives, Conventions, And Exhibitions (MICE) Industry?
- The digitalization of travel payments is a significant market trend, driving growth and convenience in the industry by enabling secure and efficient online transactions.
- The Meetings, Incentives, Conferences, and Exhibitions (MICE) market is experiencing significant growth due to the increasing digitalization and global expansion of businesses. The ease of booking and securing payments through virtual options has streamlined the transportation logistics for corporate travel. This trend is driving the demand for MICE services, as companies can efficiently manage their travel arrangements and expenses. Moreover, the integration of technology in event planning has led to the development of event apps, feedback mechanisms, and experiential marketing techniques. These tools enhance delegate satisfaction and provide valuable data for post-event analysis. Event branding and marketing collateral have also become essential components of MICE events, allowing companies to effectively showcase their products and services.
- Public relations and awards ceremonies are other key aspects of the MICE industry, providing opportunities for businesses to build relationships and foster industry recognition. As the market continues to evolve, it is essential for companies to stay updated on the latest trends and best practices in digital marketing and event planning to maximize their ROI.
What are the market trends shaping the Meetings, Incentives, Conventions, And Exhibitions (MICE) Industry?
- Globalization is experiencing a significant acceleration, representing the latest market trend. This trend signifies increasing interconnectedness and interdependence among countries and economies around the world.
- The Meetings, Incentives, Conferences, and Exhibitions (MICE) market is experiencing significant growth due to the increasing globalization and business expansion of corporations. Companies such as Toyota Motor Corporation, Walmart Inc, and Adidas AG are expanding their operations internationally to tap into new markets and opportunities. This trend is driving the demand for corporate events, including onsite registrations, virtual events, and incentive travel. Attendee tracking, event security, event staffing, and networking opportunities are essential components of MICE events, ensuring a harmonious and immersive experience for attendees. Venue selection is a critical factor in the success of these events, and social media engagement plays a significant role in promoting and enhancing the event experience.
- Speaker acquisition and team building activities are essential elements of MICE events, fostering collaboration and knowledge sharing among attendees. Incentive travel programs offer additional value to attendees, providing opportunities for professional development and personal growth. In today's digital age, virtual events have become increasingly popular, offering flexibility and convenience for attendees. However, they also present unique challenges, such as ensuring event security and providing engaging and interactive experiences for attendees. In conclusion, the MICE market is a dynamic and evolving industry, with a focus on providing innovative and valuable experiences for attendees.
- Corporations are investing in MICE events to build relationships, foster collaboration, and expand their market presence. The future of the industry lies in leveraging technology to create engaging and immersive experiences for attendees, while ensuring the highest level of security and professionalism.
What challenges does the Meetings, Incentives, Conventions, And Exhibitions (MICE) Industry face during its growth?
- The escalating threat of terrorism poses a significant challenge to the growth of various industries.
- The Meetings, Incentives, Conferences, and Exhibitions (MICE) market is a significant sector in the global business events industry. Registration management and event management software are essential tools for organizers to streamline processes and enhance attendee experience. Destination management companies play a crucial role in ensuring seamless logistics and local coordination. Social events, gala dinners, trade shows, and catering services are integral components of MICE offerings. Data analytics is transforming the industry by providing valuable insights into attendee behavior, lead generation, and sponsorship acquisition. Event technology, including virtual and hybrid events, is increasingly popular due to its flexibility and cost savings.
- Brand activation through experiential marketing and immersive experiences is a growing trend. However, terrorism poses a significant challenge to the MICE market. Safety concerns arising from terrorist threats can deter organizers and attendees from participating in events in high-risk regions. Cancellations, postponements, and increased insurance costs are potential consequences. Organizers must prioritize safety measures to mitigate risks and maintain attendee confidence. In conclusion, the MICE market is dynamic and evolving, with a focus on technology, data analytics, and attendee experience. Despite challenges, the sector continues to grow, offering opportunities for innovation and growth.
Exclusive Customer Landscape
The meetings, incentives, conventions, and exhibitions (mice) market forecasting report includes the adoption lifecycle of the market, covering from the innovator's stage to the laggard's stage. It focuses on adoption rates in different regions based on penetration. Furthermore, the meetings, incentives, conventions, and exhibitions (mice) market report also includes key purchase criteria and drivers of price sensitivity to help companies evaluate and develop their market growth analysis strategies.
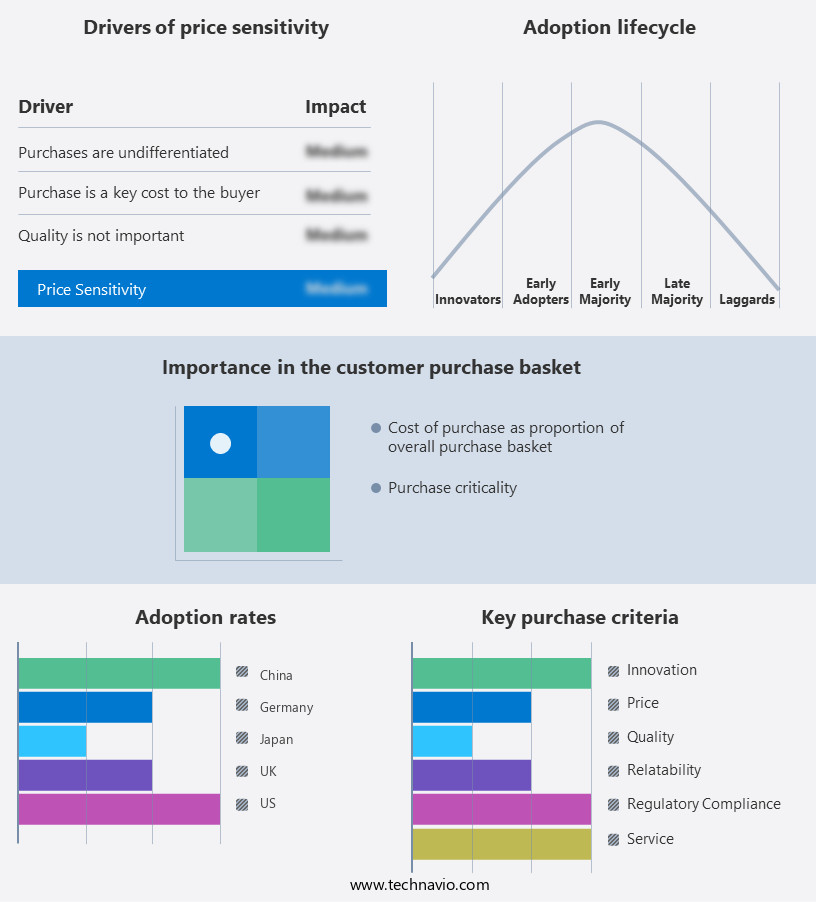
Customer Landscape
Key Companies & Market Insights
Companies are implementing various strategies, such as strategic alliances, meetings, incentives, conventions, and exhibitions (mice) market forecast, partnerships, mergers and acquisitions, geographical expansion, and product/service launches, to enhance their presence in the industry.
360 Destination Group - The company specializes in designing and executing meetings, incentives, conventions, and exhibitions (MICE). These events encompass offsite gatherings, virtual and hybrid conferences, and traditional conferences. Our offerings cater to diverse business needs, fostering productive interactions and knowledge exchange.
The industry research and growth report includes detailed analyses of the competitive landscape of the market and information about key companies, including:
- 360 Destination Group
- ATPI Ltd.
- BCD Group
- BI WORLDWIDE
- Capita Plc
- Carlson Inc.
- Conference Care Ltd.
- Coterie Spark
- CSI DMC
- Direct Travel Inc.
- Flight Centre Travel Group Ltd.
- GL events Group
- ITA Group
- Maritz Holdings Inc.
- Meetings and Incentives Worldwide Inc.
- One10 LLC
- Questex Media Group LLC
- RELX Plc
- REVEZ Corp. Ltd.
- Sustain Europe
Qualitative and quantitative analysis of companies has been conducted to help clients understand the wider business environment as well as the strengths and weaknesses of key industry players. Data is qualitatively analyzed to categorize companies as pure play, category-focused, industry-focused, and diversified; it is quantitatively analyzed to categorize companies as dominant, leading, strong, tentative, and weak.
Recent Development and News in Meetings, Incentives, Conventions, And Exhibitions (MICE) Market
- In January 2024, Cvent, a leading global event management platform, announced the acquisition of Social Tables, a software company specializing in event planning and design, for an undisclosed amount. This strategic move aimed to strengthen Cvent's offerings in the market by integrating Social Tables' event design and collaboration tools (Source: Cvent Press Release).
- In March 2024, ICCA (International Congress and Convention Association) launched its new Global Report on Trends and Statistics in the MICE industry. The report revealed a 5% increase in international association meetings in 2023, signifying a positive recovery from the pandemic-induced downturn (Source: ICCA Global Report).
- In May 2024, Messe Frankfurt, one of the world's largest trade fair organizers, signed a strategic partnership with Microsoft to digitize and enhance its trade fair offerings. The collaboration included the implementation of Microsoft's Teams platform for virtual events and digital services like AI-powered matchmaking and lead generation tools (Source: Messe Frankfurt Press Release).
- In January 2025, the European Union (EU) announced the launch of the European Destinations of Excellence (EDEN) Awards for Sustainable and Accessible Tourism. The initiative aimed to promote sustainable MICE tourism and recognize destinations that offer accessible facilities for people with disabilities (Source: EU Press Release).
Research Analyst Overview
- The MICE market is witnessing significant advancements, with accessibility considerations and risk mitigation taking center stage. Big data analytics and technology integration are transforming event planning and management, enabling personalized experiences for attendees. International standards ensure consistency and quality, while accessibility features, such as interactive displays and closed captioning, expand reach. Augmented reality (AR) and virtual reality (VR) enhance engagement, and artificial intelligence (AI) streamlines company management and contract negotiations. Economic impact, sustainability initiatives, and community engagement are crucial, with local partnerships and waste management strategies reducing carbon footprints.
- Risk management and contract negotiation safeguard investments and mitigate potential issues. ProAudio visual equipment and event technology provide engaging and interactive experiences, while brand activation and exhibition booth design showcase products and services effectively. Hybrid events offer a blend of onsite and virtual components, catering to diverse attendee preferences and expanding reach. Data analytics and lead generation provide valuable insights, enabling organizations to optimize their MICE strategies and maximize ROI. Sponsorship acquisition and event marketing further expand reach and generate revenue. The MICE market continues to evolve, with ongoing innovation and adaptation to the ever-changing business landscape.
- Project management tools facilitate efficient planning, while security protocols and emergency response plans ensure safety. Venue capacity and 3D modeling enable seamless event design, and holographic projection adds a touch of innovation. Mobile engagement and contract management systems streamline communication and administration.
Dive into Technavio's robust research methodology, blending expert interviews, extensive data synthesis, and validated models for unparalleled Meetings, Incentives, Conventions, And Exhibitions (MICE) Market insights. See full methodology.
|
Market Scope |
|
|
Report Coverage |
Details |
|
Page number |
205 |
|
Base year |
2024 |
|
Historic period |
2019-2023 |
|
Forecast period |
2025-2029 |
|
Growth momentum & CAGR |
Accelerate at a CAGR of 13.3% |
|
Market growth 2025-2029 |
USD 311.7 billion |
|
Market structure |
Fragmented |
|
YoY growth 2024-2025(%) |
10.6 |
|
Key countries |
US, China, Germany, Japan, UK, India, Canada, Brazil, UAE, Australia, Saudi Arabia, France, South Korea, Mexico, and The Netherlands |
|
Competitive landscape |
Leading Companies, Market Positioning of Companies, Competitive Strategies, and Industry Risks |
What are the Key Data Covered in this Meetings, Incentives, Conventions, And Exhibitions (MICE) Market Research and Growth Report?
- CAGR of the Meetings, Incentives, Conventions, And Exhibitions (MICE) industry during the forecast period
- Detailed information on factors that will drive the growth and forecasting between 2025 and 2029
- Precise estimation of the size of the market and its contribution of the industry in focus to the parent market
- Accurate predictions about upcoming growth and trends and changes in consumer behaviour
- Growth of the market across North America, Europe, APAC, Middle East and Africa, and South America
- Thorough analysis of the market's competitive landscape and detailed information about companies
- Comprehensive analysis of factors that will challenge the meetings, incentives, conventions, and exhibitions (mice) market growth of industry companies
We can help! Our analysts can customize this meetings, incentives, conventions, and exhibitions (mice) market research report to meet your requirements.
 RIA -
RIA - 
