Men Underwear Market Size 2025-2029
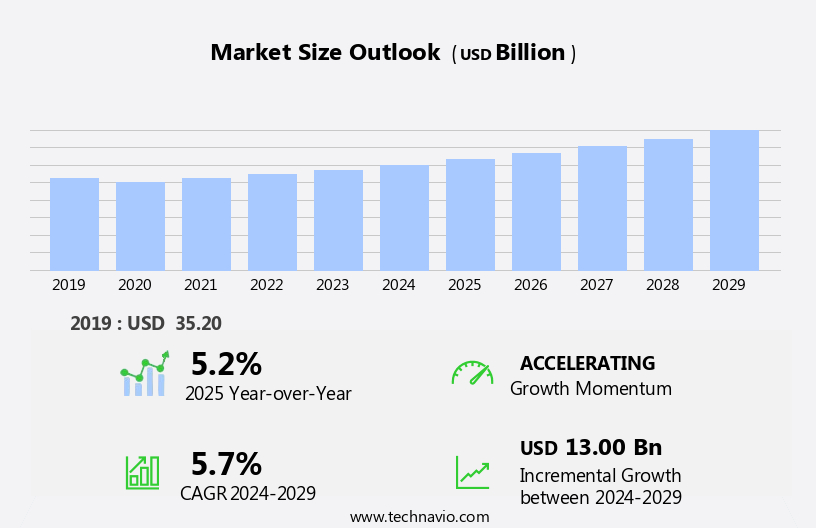
The men underwear market size is forecast to increase by USD 13.00 billion, at a CAGR of 5.7% between 2024 and 2029.
- The market is witnessing significant growth, driven by the increasing consciousness towards health and wellness and hygiene. Consumers are becoming more mindful of the importance of wearing comfortable and hygienic undergarments, leading to a surge in demand for high-quality men's underwear and intimate apparel. Market companies are responding to this trend by investing heavily in research and development and launching innovative products. However, the market faces challenges related to purchasing behavior. Men often purchase underwear based on price and availability rather than quality, leading to a fragmented market and intense competition.
- This makes it essential for market players to differentiate themselves by offering superior comfort, durability, and unique features to attract and retain customers. Companies that can effectively address this challenge by focusing on customer education and building brand loyalty will be well-positioned to capitalize on the growing demand for premium men's underwear.
What will be the Size of the Men Underwear Market during the forecast period?
Explore in-depth regional segment analysis with market size data - historical 2019-2023 and forecasts 2025-2029 - in the full report.
Request Free Sample
The market continues to evolve, driven by dynamic market forces and consumer preferences. Fabric blends, such as moisture-wicking and antimicrobial treatments, are increasingly popular in performance underwear, catering to active lifestyles. Seamless construction and relaxed fits ensure comfort, while athletic wear and casual styles dominate retail channels. Quality control measures, including ethical sourcing and sizing charts, are essential for maintaining customer loyalty. New product development, including compression underwear and specialty stores, cater to diverse consumer needs. Online retail channels offer convenience, while supply chain optimization and digital printing enable quick turnaround times for new designs.
Consumer preferences for comfort stretch, odor control, and various waistband types continue to shape market trends. The ongoing unfolding of these patterns reflects the continuous nature of market activities in the men underwear sector.
How is this Men Underwear Industry segmented?
The men underwear industry research report provides comprehensive data (region-wise segment analysis), with forecasts and estimates in "USD billion" for the period 2025-2029, as well as historical data from 2019-2023 for the following segments.
- Type
- Boxer brief
- Briefs
- Trunks
- Boxers
- Others
- Material
- Cotton
- Polyester
- Modal
- Nylon
- Others
- Distribution Channel
- Offline
- Online
- Age Group
- 26-35 year
- 36-45 year
- 15-25 year
- Above 45
- Geography
- North America
- US
- Canada
- Mexico
- Europe
- Germany
- UK
- APAC
- Australia
- China
- India
- Japan
- South Korea
- Rest of World (ROW)
- North America
By Type Insights
The boxer brief segment is estimated to witness significant growth during the forecast period.
The market is witnessing significant growth, with boxer briefs emerging as a popular choice among consumers. This style, which combines the features of boxers and briefs, offers men a comfortable, supportive, and stylish alternative. The preference for boxer briefs over traditional boxers or briefs is driven by the increasing importance of comfort and breathability in men underwear. Department stores and specialty retailers are key retail channels for men underwear, catering to both everyday wear and performance-focused options. Moisture-wicking fabrics and seamless construction are popular features in performance underwear, while ethical sourcing and fabric blends are becoming increasingly important to consumers.
Price sensitivity is a key factor in the market, with consumers seeking value for money. Compression underwear and athletic fit styles are popular among men who engage in regular exercise or sports activities. New product development, such as mesh panels and antimicrobial treatment, adds value to the market. Consumer preferences for different waistband types, leg openings, and fly styles vary, with some men preferring a relaxed fit and others opting for a slim fit. Quality control and odor control are essential considerations for both retailers and consumers. Online retail is a growing retail channel, offering convenience and a wide range of options for consumers.
Brick-and-mortar stores continue to play a significant role in the market, allowing consumers to try on and feel the fabric before making a purchase. Innovations in technology, such as dye sublimation and digital printing, are driving product differentiation and enhancing the overall shopping experience for consumers. The market is expected to continue evolving, with a focus on sustainability, comfort, and style.
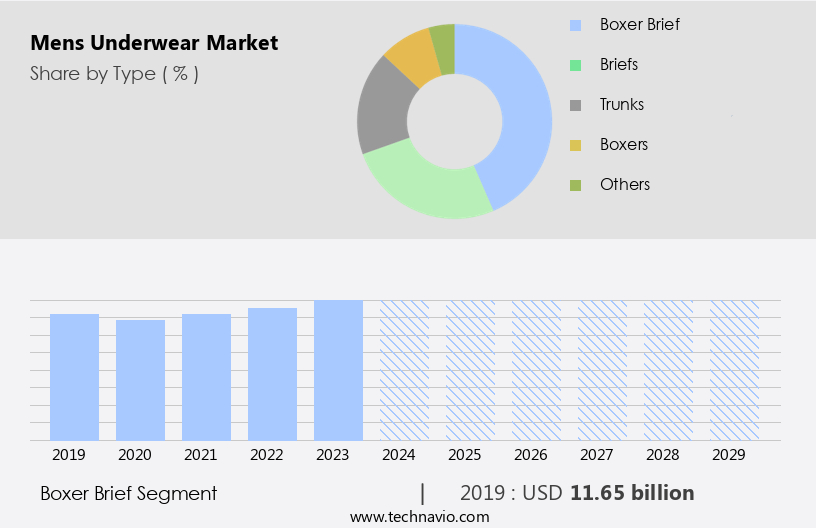
The Boxer brief segment was valued at USD 11.65 billion in 2019 and showed a gradual increase during the forecast period.
Regional Analysis
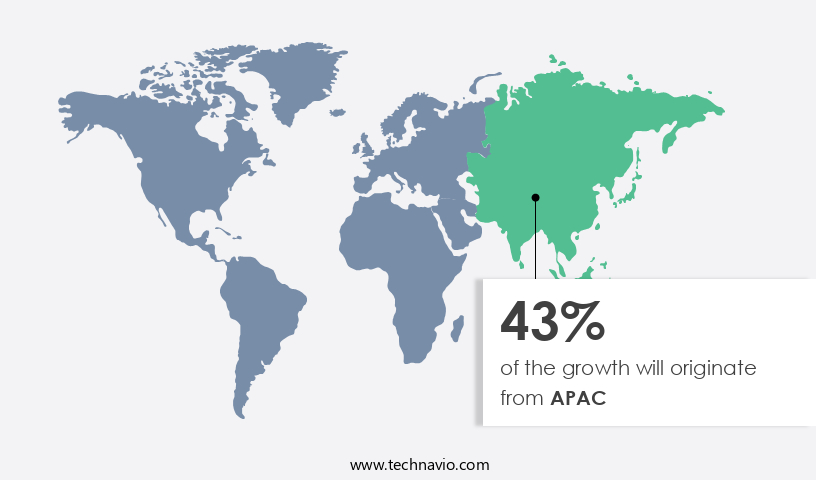
APAC is estimated to contribute 43% to the growth of the global market during the forecast period. Technavio's analysts have elaborately explained the regional trends and drivers that shape the market during the forecast period.
The market in Asia Pacific is experiencing significant growth, with China, India, Japan, Australia, and South Korea leading the charge. Brick-and-mortar stores, including department stores and specialty retailers, dominate the retail landscape, catering to consumers' preferences for trying on and feeling the quality of the product before purchase. Waistband types, such as athletic fit and slim fit, continue to gain popularity, while price sensitivity remains a key consideration for many buyers. Leg openings and mesh panels are popular features in men's fashion, and moisture-wicking fabrics are increasingly sought after for performance underwear. New product development, including dye sublimation and digital printing, is driving innovation in the market.
Customer loyalty is a significant factor, with men often returning to trusted brands for everyday wear and athletic wear. Ethical sourcing and supply chain transparency are also becoming important considerations for consumers. Comfort, quality control, and odor control are essential features, with many brands offering antimicrobial treatment and comfort stretch. Online retail is also gaining traction, offering convenience and competitive pricing. Overall, the market in Asia Pacific is dynamic and evolving, with a focus on meeting the diverse needs and preferences of its target audience.
Market Dynamics
Our researchers analyzed the data with 2024 as the base year, along with the key drivers, trends, and challenges. A holistic analysis of drivers will help companies refine their marketing strategies to gain a competitive advantage.
What are the key market drivers leading to the rise in the adoption of Men Underwear Industry?
- The increasing awareness and emphasis on health and hygiene serve as the primary catalyst for market growth.
- The market is experiencing significant growth due to increasing consumer preferences for functional and comfortable undergarments. Sizing charts and digital printing technologies have made it easier for manufacturers to cater to diverse customer needs, leading to product differentiation. The market is driven by the trend towards casual wear and the growing awareness of health and personal hygiene. Young men, particularly those engaged in sports and physical activities, are a key target audience. Ethical sourcing practices are also becoming increasingly important, with consumers showing a preference for brands that prioritize sustainable and ethical manufacturing processes.
- Wholesale distribution channels have facilitated the widespread availability of men underwear, further fueling market growth. Fly styles and boxer briefs remain popular choices, reflecting consumer preferences for functionality and comfort. Overall, the market is expected to continue its growth trajectory in the coming years.
What are the market trends shaping the Men Underwear Industry?
- Market trends indicate an increasing focus on growing investments and product launches among companies. This trend is evident as professionals in the industry continue to expand their offerings to remain competitive.
- The market is witnessing significant innovation, with companies investing heavily in research and development to create comfortable, functional, and inclusive products. Major players in this sector, such as Jockey, Hugo Boss, and Ralph Lauren Corp., are utilizing advanced tailoring techniques and fabric blends, including viscose and merino wool, to enhance comfort and moisture management. For instance, Saxx Underwear has introduced 3D hammock-shaped pouches and nine-panel fabric designs to improve fit and functionality. Seamless construction, comfort stretch, and antimicrobial treatment are also becoming popular features in men underwear, catering to the growing demand for athletic wear and odor control.
- Quality control measures are being prioritized to ensure consumer satisfaction and brand loyalty. Online retail channels are also gaining traction due to their convenience and accessibility.
What challenges does the Men Underwear Industry face during its growth?
- The growth of the industry is significantly impacted by challenges in the product purchasing process. Specifically, addressing these issues is essential for fostering industry expansion.
- The market faces challenges in expanding due to the limitations of brick-and-mortar stores in developing regions, providing a limited selection of products. Additionally, the inability to try or feel the product before purchasing online is another obstacle. Waistband types, leg openings, mesh panels, and moisture-wicking fabrics are essential considerations for men's fashion and performance underwear. Price sensitivity and fashion trends influence market dynamics.
- The market's growth may be hindered by these factors during the forecast period. However, the demand for men underwear continues to be driven by the need for comfort, functionality, and style. Men's underwear manufacturers and retailers must address these challenges to capitalize on the potential growth opportunities in this market.
Exclusive Customer Landscape
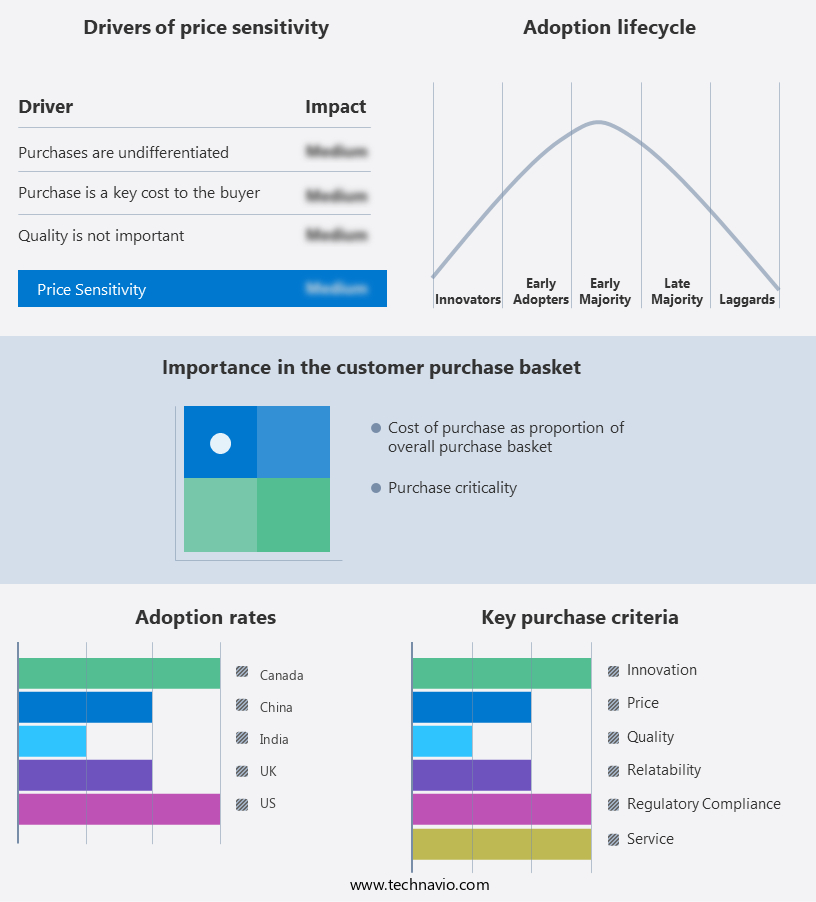
The men underwear market forecasting report includes the adoption lifecycle of the market, covering from the innovator's stage to the laggard's stage. It focuses on adoption rates in different regions based on penetration. Furthermore, the men underwear market report also includes key purchase criteria and drivers of price sensitivity to help companies evaluate and develop their market growth analysis strategies.
Customer Landscape
Key Companies & Market Insights
Companies are implementing various strategies, such as strategic alliances, men underwear market forecast, partnerships, mergers and acquisitions, geographical expansion, and product/service launches, to enhance their presence in the industry.
American Eagle Outfitters Inc. - This company specializes in producing high-quality men's undergarments, including pocket boxers and classic boxer shorts.
The industry research and growth report includes detailed analyses of the competitive landscape of the market and information about key companies, including:
- American Eagle Outfitters Inc.
- Derek Rose Ltd.
- Dolce and Gabbana Srl
- Duluth Holdings Inc.
- Farfetch Ltd.
- Hanesbrands Inc.
- Huber Holding AG
- Hugo Boss AG
- Iconix International
- Jockey International Inc.
- Levi Strauss and Co.
- Newell Brands Inc.
- OTB Spa
- Penney IP LLC
- Perry Ellis International Inc.
- PVH Corp.
- Ralph Lauren Corp.
- RibbedTee
- Under Armour Inc.
- UNIQLO Co. Ltd.
Qualitative and quantitative analysis of companies has been conducted to help clients understand the wider business environment as well as the strengths and weaknesses of key industry players. Data is qualitatively analyzed to categorize companies as pure play, category-focused, industry-focused, and diversified; it is quantitatively analyzed to categorize companies as dominant, leading, strong, tentative, and weak.
Recent Development and News in Men Underwear Market
- In February 2023, HanesBrands Inc., a leading marketer of basic apparel, announced the launch of its new brand, Zorba, exclusively for the Indian market. The new brand aims to cater to the growing demand for affordable, trendy, and comfortable men's underwear in India (HanesBrands Inc. Press release, 2023).
- In March 2024, Jockey International, a global underwear manufacturer, entered into a strategic partnership with Amazon Fashion to expand its reach and distribution network in the US market. The collaboration includes the exclusive sale of Jockey's new product lines on Amazon's platform (Amazon Business Wire, 2024).
- In May 2024, Calvin Klein, a leading fashion brand, unveiled its new tech-infused underwear collection, 'CK Tech,' at the TechStyle Fusion Summit. The collection features moisture-wicking, quick-drying, and antimicrobial properties, making it a significant technological advancement in the men's underwear market (Calvin Klein press release, 2024).
- In October 2024, Spanish underwear brand, MAN, secured a â¬10 million investment from the private equity firm, KKR, to support its expansion plans in Europe and the US markets. The investment will help MAN increase its production capacity and strengthen its distribution network (KKR press release, 2024).
Research Analyst Overview
- In the dynamic market, discount strategies play a significant role in driving sales. Brands employ various tactics, such as seasonal discounts and bulk purchase offers, to attract price-sensitive consumers. Social media marketing is another key trend, with influencer collaborations and promotional campaigns increasing brand visibility and engagement. Dyeing processes and fabric weight are crucial factors influencing customer preferences. Brands prioritize shrinkage resistance and washing instructions to ensure customer satisfaction. Waistband elasticity and leg opening elasticity are essential for comfort and fit, while product ratings and customer reviews significantly impact purchasing decisions. Promotional campaigns on social media and email marketing are effective channels for reaching potential customers.
- Brands optimize their online presence through search engine optimization and invest in content marketing to educate consumers about base layers, drying instructions, seam construction, and thermal underwear. Quality certifications, fabric density, and moisture management are essential aspects of product development. Brands prioritize international standards for product safety and compliance. Incorporating compression technology and underwear liners enhances product functionality and appeal. Retail price points and returns policies are critical considerations for both brands and consumers. Brands strive to offer competitive pricing while ensuring profitability, while transparent returns policies help build trust and customer loyalty. Garment care instructions and thermal underwear are essential for consumers in colder climates.
- Brands invest in research and development to create high-quality, durable products that meet evolving consumer needs. Fabric density and thermal properties are crucial factors in creating effective base layers. Online advertising and promotional campaigns are effective strategies for reaching a broad audience. Brands invest in targeted campaigns to reach specific demographics and optimize their online presence through search engine optimization and email marketing. Moisture management and seam construction are essential features for active consumers. Brands prioritize these aspects to create high-performance underwear that meets the needs of athletes and fitness enthusiasts. Compression technology and underwear liners are additional features that enhance product functionality and appeal.
- Customer service and product ratings are essential for building brand loyalty and reputation. Brands prioritize responsive customer service and invest in gathering and responding to customer feedback to improve product offerings and enhance the overall customer experience.
Dive into Technavio's robust research methodology, blending expert interviews, extensive data synthesis, and validated models for unparalleled men Underwear Market insights. See full methodology.
|
Market Scope |
|
|
Report Coverage |
Details |
|
Page number |
232 |
|
Base year |
2024 |
|
Historic period |
2019-2023 |
|
Forecast period |
2025-2029 |
|
Growth momentum & CAGR |
Accelerate at a CAGR of 5.7% |
|
Market growth 2025-2029 |
USD 13.00 billion |
|
Market structure |
Fragmented |
|
YoY growth 2024-2025(%) |
5.2 |
|
Key countries |
US, India, China, Japan, South Korea, UK, Canada, Australia, Germany, and Mexico |
|
Competitive landscape |
Leading Companies, Market Positioning of Companies, Competitive Strategies, and Industry Risks |
What are the Key Data Covered in this Men Underwear Market Research and Growth Report?
- CAGR of the men Underwear industry during the forecast period
- Detailed information on factors that will drive the growth and forecasting between 2025 and 2029
- Precise estimation of the size of the market and its contribution of the industry in focus to the parent market
- Accurate predictions about upcoming growth and trends and changes in consumer behaviour
- Growth of the market across APAC, North America, Europe, Middle East and Africa, and South America
- Thorough analysis of the market's competitive landscape and detailed information about companies
- Comprehensive analysis of factors that will challenge the men underwear market growth of industry companies
We can help! Our analysts can customize this men underwear market research report to meet your requirements.
 RIA -
RIA - 
