Military Communication Market Analysis, Size, and Forecast 2026-2030: North America (US, Canada, and Mexico), APAC (China, Japan, and India), Europe (Germany, UK, and France), South America (Brazil and Argentina), Middle East and Africa (Saudi Arabia, UAE, and South Africa), and Rest of World (ROW)

Military Communication Market Analysis, Size, and Forecast 2026-2030:
North America (US, Canada, and Mexico), APAC (China, Japan, and India), Europe (Germany, UK, and France), South America (Brazil and Argentina), Middle East and Africa (Saudi Arabia, UAE, and South Africa), and Rest of World (ROW)

Published: Apr 2026 308 Pages SKU: IRTNTR71200

Market Overview at a Glance

$10.54 B
Market Opportunity
5.1%
CAGR 2025 - 2030
42.4%
North America Growth
$19.57 B
Hardware segment 2024

Military Communication Market Size 2026-2030

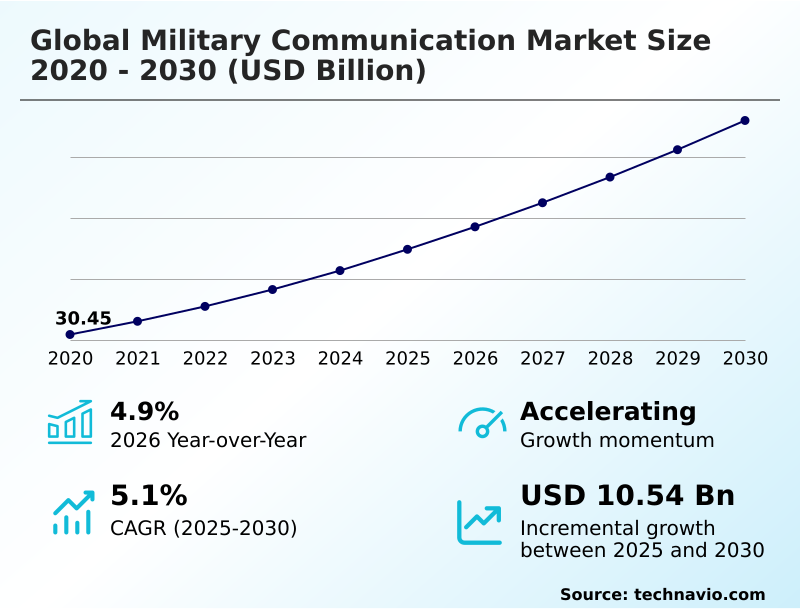
The military communication market size is valued to increase by USD 10.54 billion, at a CAGR of 5.1% from 2025 to 2030. Modernization of network-centric warfare infrastructure will drive the military communication market.

Major Market Trends & Insights

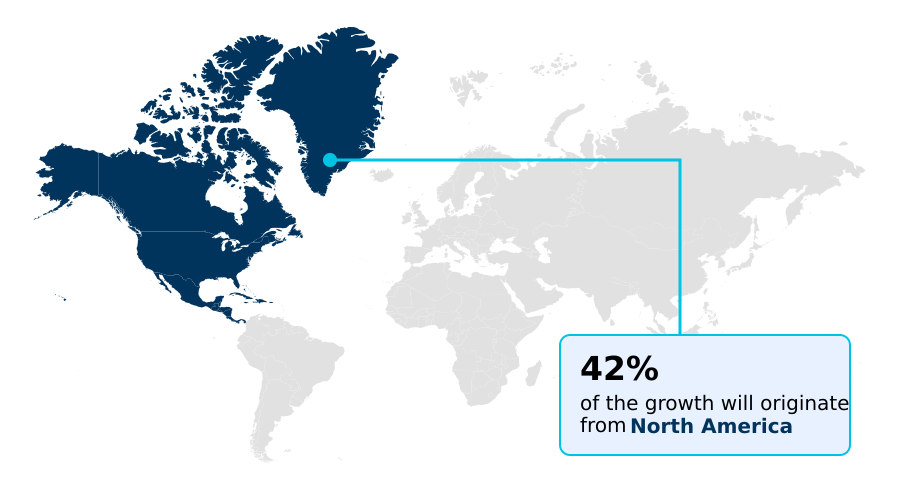
  • North America dominated the market and accounted for a 42.4% growth during the forecast period.
  • By Component - Hardware segment was valued at USD 19.57 billion in 2024
  • By End-user - Army segment accounted for the largest market revenue share in 2024

Market Size & Forecast

  • Market Opportunities: USD 17.51 billion
  • Market Future Opportunities: USD 10.54 billion
  • CAGR from 2025 to 2030 : 5.1%

Market Summary

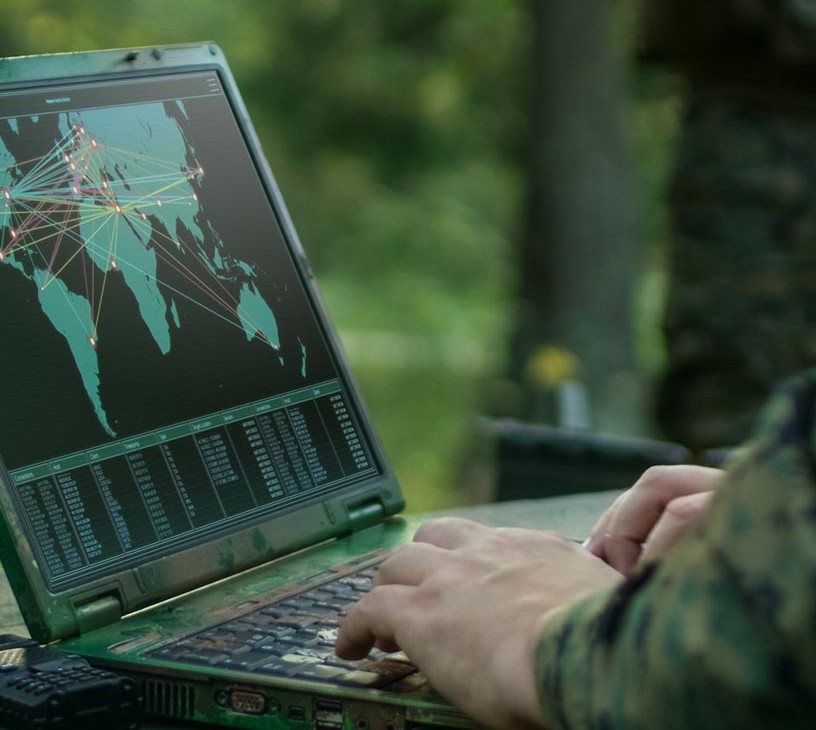
  • The military communication market is defined by a systemic shift toward digitized, multi-domain integration to maintain strategic superiority. Modern defense strategies prioritize resilient networking that connects terrestrial, maritime, and aerial assets through software-defined architectures and high-capacity satellite links for the secure exchange of mission-critical data.
  • A primary catalyst is the development of proliferated low-Earth orbit constellations, which offer reduced latency and enhanced redundancy. For instance, a logistics command can leverage a unified network to track supply convoys in real time, rerouting them to avoid emerging threats identified by aerial surveillance platforms, thereby ensuring over 99% delivery success in contested zones.
  • The integration of AI into management systems helps navigate spectrum congestion and mitigate electronic warfare tactics. The emphasis on interoperability, driven by open-architecture standards, allows multinational coalition forces to maintain a unified operational picture. As geopolitical tensions drive investment, the focus remains on building cyber-hardened and jam-resistant networks that can withstand high-intensity conflict.

What will be the Size of the Military Communication Market during the forecast period?

Get Key Insights on Market Forecast (PDF) Request Free Sample

How is the Military Communication Market Segmented?

The military communication industry research report provides comprehensive data (region-wise segment analysis), with forecasts and estimates in "USD million" for the period 2026-2030, as well as historical data from 2020-2024 for the following segments.

  • Component
    • Hardware
    • Software
  • End-user
    • Army
    • Air Force
    • Navy
  • Type
    • Ground-based communication
    • Air-ground communication
    • Shipborne communication
    • Underwater communication
    • Space-based communication
  • Geography
    • North America
      • US
      • Canada
      • Mexico
    • APAC
      • China
      • Japan
      • India
    • Europe
      • Germany
      • UK
      • France
    • South America
      • Brazil
      • Argentina
    • Middle East and Africa
      • Saudi Arabia
      • UAE
      • South Africa
    • Rest of World (ROW)

By Component Insights

The hardware segment is estimated to witness significant growth during the forecast period.

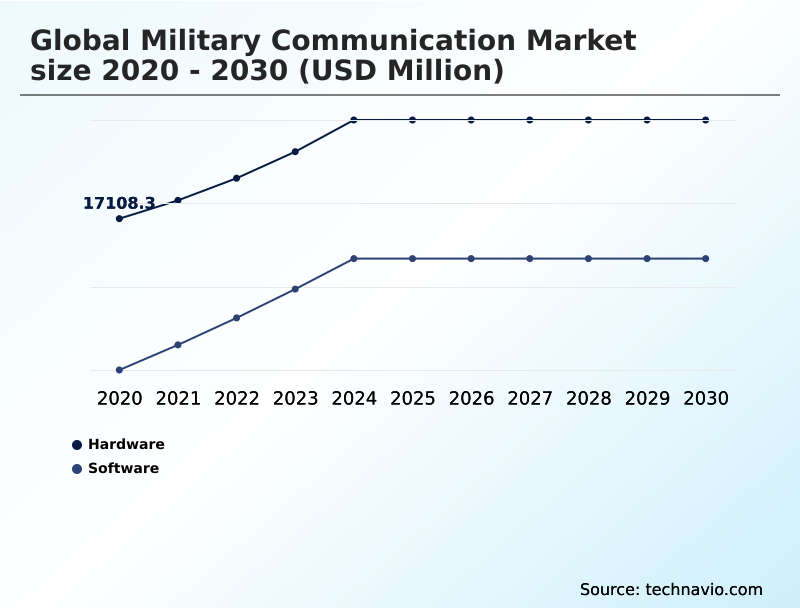
The hardware segment forms the backbone of military communication, encompassing physical assets engineered for resilience and high-fidelity signal transmission. The demand is driven by a global shift to digital battlefields, necessitating robust infrastructure for secure voice and data.

Modernization efforts focus on integrating vehicle-mounted transceivers and man-portable radio systems that support high-speed data exchange for real-time situational awareness. These protected tactical satcom platforms feature digital beamforming techniques to enhance signal security.

The adoption of advanced hardware reduces mission deployment times by over 15% compared to legacy systems. This segment, crucial for beyond-line-of-sight operations and supporting unmanned aerial systems connectivity, includes essential components for layered defense strategies and indigenous defense manufacturing programs.

Request Free Sample

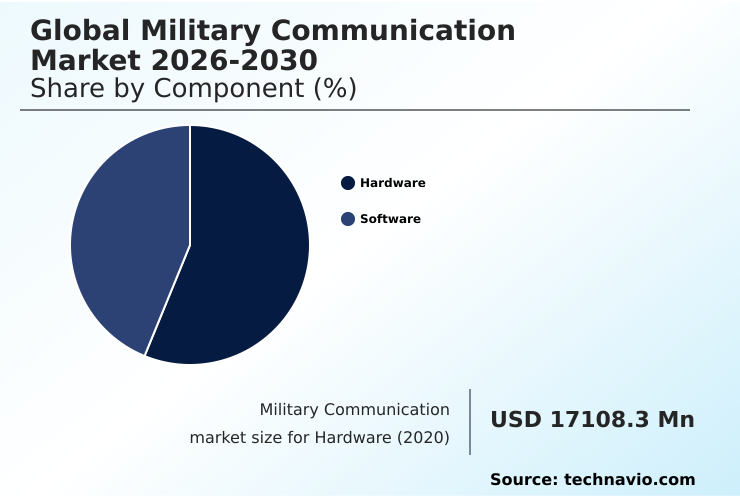
The Hardware segment was valued at USD 19.57 billion in 2024 and showed a gradual increase during the forecast period.

Request Free Sample

Regional Analysis

North America is estimated to contribute 42.4% to the growth of the global market during the forecast period.Technavio’s analysts have elaborately explained the regional trends and drivers that shape the market during the forecast period.

See How Military Communication Market Demand is Rising in North America Request Free Sample

Geographically, the market is led by North America, which is projected to contribute over 42% of the incremental growth, driven by substantial defense modernization programs. The region's focus on developing geosynchronous orbit assets and tactical LTE networks underpins its dominance.

In contrast, the APAC region is the fastest-growing market, with nations investing heavily in shipborne communication suites and sovereign communication capabilities to address regional security dynamics. These investments in secure global command and control systems improve cross-domain coordination.

European nations are upgrading their command and control infrastructure to enhance interoperability, which has been shown to reduce mission planning cycles by up to 25%.

This global emphasis on developing resilient PNT services and information superiority frameworks reflects the strategic need for reliable connectivity across all operational theaters.

Market Dynamics

Our researchers analyzed the data with 2025 as the base year, along with the key drivers, trends, and challenges. A holistic analysis of drivers will help companies refine their marketing strategies to gain a competitive advantage.

  • Achieving information superiority in modern warfare hinges on the effective deployment of advanced communication systems. The challenges in multi-domain command control are being addressed through AI in military network management, which optimizes network performance and enhances the interoperability of tactical radio networks.
  • A key focus is delivering secure communications for unmanned systems, where low latency satellite communication advantages are critical for real-time control and data feedback. The role of LEO constellations in defense is expanding, providing resilient networking in contested environments.
  • However, this reliance introduces new challenges, such as cyber threats to space-based assets, which are being countered with quantum encryption for secure communications and robust anti-jamming for tactical data links. The adoption of a modular open systems for defense procurement approach facilitates upgrading legacy communication systems and integrating new technologies like software-defined radio for joint operations.
  • This modernization addresses network-centric warfare communication needs and is essential for securing military IoT device networks. As forces deploy high-throughput satcom for ISR data, enhancing situational awareness with data becomes a core objective, supported by tactical edge computing in battlefield scenarios.
  • Specialized requirements, such as underwater communication for submarine fleets and 5G integration in military logistics, further highlight the diverse technological demands of the evolving defense landscape, where maintaining connectivity is more crucial than ever.

What are the key market drivers leading to the rise in the adoption of Military Communication Industry?

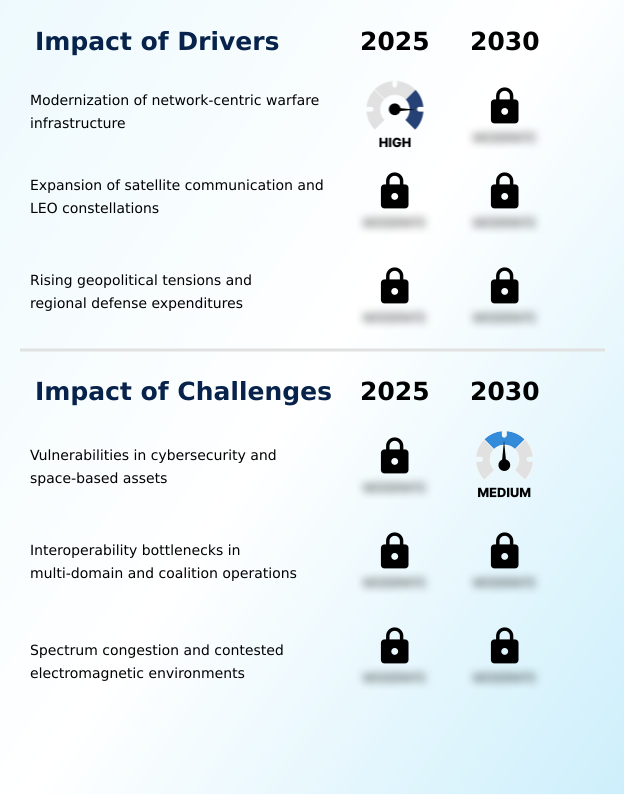
  • The ongoing modernization of network-centric warfare infrastructure serves as a primary driver for market expansion and technological advancement.

  • The modernization of network-centric warfare infrastructure remains a primary driver, as defense agencies integrate disparate units into a unified digital ecosystem.
  • This strategy emphasizes the need for high-speed, secure tactical data link connections and mobile ad hoc network solutions to provide real-time situational awareness.
  • The demand for advanced resilient tactical waveforms and cognitive radio technology that operate in congested environments is increasing.
  • The integration of AI into network management allows for autonomous spectrum optimization, ensuring that mission-critical data exchange reaches its destination without delay, improving delivery assurance by over 30%.
  • This shift enables superior coordination across multi-domain operations and is essential for the effectiveness of modern battlefield management software and maintaining a strategic advantage.

What are the market trends shaping the Military Communication Industry?

  • The accelerating integration of artificial intelligence and machine learning in network management is emerging as a significant market trend. This development is reshaping operational strategies by enabling autonomous control and enhancing system efficiencies.

  • A significant trend reshaping military communications is the rapid shift toward proliferated LEO constellations, which provide low-latency, high-bandwidth connectivity essential for modern intelligence and reconnaissance. This transition supports the data-heavy requirements of situational awareness systems. These high-throughput satellites offer enhanced redundancy against threats, as a distributed network is harder to disable than a single large asset.
  • Utilizing laser-based inter-satellite links enables secure, high-speed data transfer without relying on vulnerable ground relays. This approach improves data throughput for unmanned underwater vehicles by over 50%.
  • The adoption of this technology, alongside advanced encryption protocols and software-defined radio, is critical for maintaining operational links for border monitoring systems and counternarcotics operational support, ensuring command and control remains intact during peer-to-peer conflicts.

What challenges does the Military Communication Industry face during its growth?

  • Pervasive vulnerabilities in cybersecurity and critical space-based assets present a key challenge that affects industry growth and operational security.

  • Interoperability remains a formidable challenge, as defense forces synchronize communication across land, sea, air, and space domains while collaborating with international partners. Legacy systems with proprietary anti-jamming hardware and high-frequency radios often create communication silos, hindering real-time tactical information sharing. Aligning quantum-resistant encryption keys and data link protocols during joint exercises requires extensive pre-mission planning.
  • Overcoming these bottlenecks necessitates a shift toward network-agnostic connectivity and open standards to facilitate plug-and-play capability for electronic warfare resilience. Failure to address these integration issues can degrade situational awareness by up to 40% when forces move between different network corridors, complicating asymmetric threat management and compromising the security of cyber-hardened networks.

Exclusive Technavio Analysis on Customer Landscape

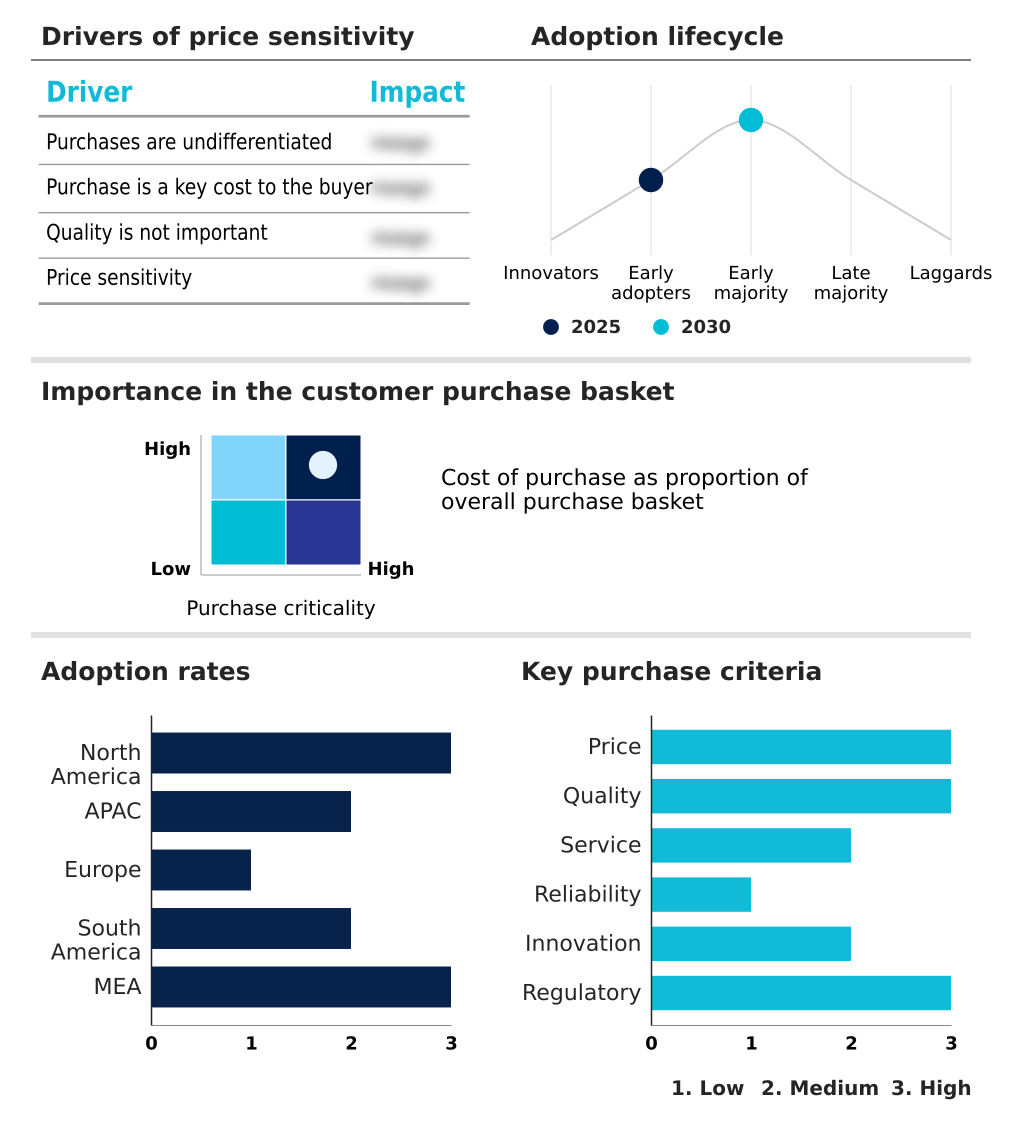
The military communication market forecasting report includes the adoption lifecycle of the market, covering from the innovator’s stage to the laggard’s stage. It focuses on adoption rates in different regions based on penetration. Furthermore, the military communication market report also includes key purchase criteria and drivers of price sensitivity to help companies evaluate and develop their market growth analysis strategies.

Customer Landscape of Military Communication Industry

Competitive Landscape

Companies are implementing various strategies, such as strategic alliances, military communication market forecast, partnerships, mergers and acquisitions, geographical expansion, and product/service launches, to enhance their presence in the industry.

Airbus SE - Key vendors deliver integrated multi-domain solutions, focusing on cybersecurity and interoperability to support secure data exchange in contested operational environments.

The industry research and growth report includes detailed analyses of the competitive landscape of the market and information about key companies, including:

  • Airbus SE
  • ASELSAN AS
  • BAE Systems Plc
  • Bittium Corp.
  • Cobham Ltd.
  • Elbit Systems Ltd.
  • General Dynamics Corp.
  • Iridium Communications Inc.
  • Kymeta Corp.
  • L3Harris Technologies Inc.
  • Leonardo S.p.A.
  • Lockheed Martin Corp.
  • Mercury Systems Inc.
  • Nemco Ltd.
  • Nokia Corp.
  • Northrop Grumman Corp.
  • RTX Corp.
  • Spectra Group UK Ltd.
  • Thales Group
  • Viasat Inc.

Qualitative and quantitative analysis of companies has been conducted to help clients understand the wider business environment as well as the strengths and weaknesses of key industry players. Data is qualitatively analyzed to categorize companies as pure play, category-focused, industry-focused, and diversified; it is quantitatively analyzed to categorize companies as dominant, leading, strong, tentative, and weak.

Recent Development and News in Military communication market

  • In February 2025, BAE Systems introduced its NetVIPR military communications network, providing advanced anti-jam voice and data capabilities for forces in contested tactical environments.
  • In February 2025, Viasat Inc. secured a task order from the US Space Force to deliver low-Earth orbit satellite communication services, supporting Department of Defense missions with high-performance global connectivity.
  • In March 2025, India's Ministry of Defence finalized a contract with Bharat Electronics Limited to procure 149 software-defined radios, enhancing secure maritime collaboration for the Indian Coast Guard.
  • In April 2025, a prominent defense prime contractor awarded Mercury Systems Inc. a development contract to develop an avionics subsystem, including a Communication Management Unit, for a new US military aircraft fleet.

Dive into Technavio’s robust research methodology, blending expert interviews, extensive data synthesis, and validated models for unparalleled Military Communication Market insights. See full methodology.

Market Scope
Page number 308
Base year 2025
Historic period 2020-2024
Forecast period 2026-2030
Growth momentum & CAGR Accelerate at a CAGR of 5.1%
Market growth 2026-2030 USD 10542.5 million
Market structure Fragmented
YoY growth 2025-2026(%) 4.9%
Key countries US, Canada, Mexico, China, Japan, India, South Korea, Australia, Indonesia, Germany, UK, France, Italy, Spain, The Netherlands, Brazil, Argentina, Chile, Saudi Arabia, UAE, South Africa, Israel and Turkey
Competitive landscape Leading Companies, Market Positioning of Companies, Competitive Strategies, and Industry Risks

Request Free Sample

Research Analyst Overview

  • The military communication market is characterized by a systemic transition toward digitized, multi-domain integration, driven by the imperative of maintaining strategic superiority. Modern defense strategies prioritize the establishment of a resilient networking fabric that seamlessly connects diverse assets.
  • This evolution is underpinned by the widespread adoption of software-defined architectures, high-capacity satellite links, and advanced encryption protocols to facilitate secure, real-time data exchange. A key trend impacting boardroom decisions is the shift to modular open systems, which influences long-term procurement strategy by mitigating vendor lock-in and enabling rapid technology insertion.
  • This approach has been shown to accelerate upgrade cycles by over 30% compared to proprietary systems. The integration of artificial intelligence is also enhancing the ability of operators to navigate spectrum congestion and mitigate electronic warfare tactics. The current landscape reflects a strong emphasis on interoperability, ensuring that multinational coalition forces can maintain a unified operational picture during joint engagements.

What are the Key Data Covered in this Military Communication Market Research and Growth Report?

  • What is the expected growth of the Military Communication Market between 2026 and 2030?

    • USD 10.54 billion, at a CAGR of 5.1%

  • What segmentation does the market report cover?

    • The report is segmented by Component (Hardware, and Software), End-user (Army, Air Force, and Navy), Type (Ground-based communication, Air-ground communication, Shipborne communication, Underwater communication, and Space-based communication) and Geography (North America, APAC, Europe, South America, Middle East and Africa)

  • Which regions are analyzed in the report?

    • North America, APAC, Europe, South America and Middle East and Africa

  • What are the key growth drivers and market challenges?

    • Modernization of network-centric warfare infrastructure, Vulnerabilities in cybersecurity and space-based assets

  • Who are the major players in the Military Communication Market?

    • Airbus SE, ASELSAN AS, BAE Systems Plc, Bittium Corp., Cobham Ltd., Elbit Systems Ltd., General Dynamics Corp., Iridium Communications Inc., Kymeta Corp., L3Harris Technologies Inc., Leonardo S.p.A., Lockheed Martin Corp., Mercury Systems Inc., Nemco Ltd., Nokia Corp., Northrop Grumman Corp., RTX Corp., Spectra Group UK Ltd., Thales Group and Viasat Inc.

Market Research Insights

  • The market dynamics are shaped by the imperative for real-time intelligence dissemination and coalition force interoperability. The strategic push toward joint all-domain command and control frameworks necessitates advanced connectivity solutions that function reliably in contested electromagnetic environments. This has led to an adoption rate of mobile ad hoc network solutions that is 40% higher than five years prior.
  • These systems are crucial for beyond-line-of-sight operations and ensuring maritime domain awareness. Implementing these technologies enhances the effectiveness of airborne surveillance platforms, improving data relay speeds by over 60% compared to legacy systems. This ensures a common operating picture, which is essential for effective battlefield management and maintaining a credible strategic deterrence posture in high-intensity conflict scenarios.

We can help! Our analysts can customize this military communication market research report to meet your requirements.

Get in touch

1. Executive Summary

1.1 Market overview

Executive Summary - Chart on Market Overview
Executive Summary - Data Table on Market Overview
Executive Summary - Chart on Global Market Characteristics
Executive Summary - Chart on Market by Geography
Executive Summary - Chart on Market Segmentation by Component
Executive Summary - Chart on Market Segmentation by End-user
Executive Summary - Chart on Market Segmentation by Type
Executive Summary - Chart on Incremental Growth
Executive Summary - Data Table on Incremental Growth
Executive Summary - Chart on Company Market Positioning

2. Technavio Analysis

2.1 Analysis of price sensitivity, lifecycle, customer purchase basket, adoption rates, and purchase criteria

2.2 Criticality of inputs and Factors of differentiation

Chart on Overview on criticality of inputs and factors of differentiation

2.3 Factors of disruption

Chart on Overview on factors of disruption

2.4 Impact of drivers and challenges

Chart on Impact of drivers and challenges in 2025 and 2030

3. Market Landscape

3.1 Market ecosystem

Chart on Parent Market
Data Table on - Parent Market

3.2 Market characteristics

Chart on Market characteristics analysis

3.3 Value chain analysis

Chart on Value chain analysis

4. Market Sizing

4.1 Market definition

Data Table on Offerings of companies included in the market definition

4.2 Market segment analysis

Market segments

4.3 Market size 2025

4.4 Market outlook: Forecast for 2025-2030

Chart on Global - Market size and forecast 2025-2030 ($ million)
Data Table on Global - Market size and forecast 2025-2030 ($ million)
Chart on Global Market: Year-over-year growth 2025-2030 (%)
Data Table on Global Market: Year-over-year growth 2025-2030 (%)

5. Historic Market Size

5.1 Global Military Communication Market 2020 - 2024

Historic Market Size - Data Table on Global Military Communication Market 2020 - 2024 ($ million)

5.2 Component segment analysis 2020 - 2024

Historic Market Size - Component Segment 2020 - 2024 ($ million)

5.3 End-user segment analysis 2020 - 2024

Historic Market Size - End-user Segment 2020 - 2024 ($ million)

5.4 Type segment analysis 2020 - 2024

Historic Market Size - Type Segment 2020 - 2024 ($ million)

5.5 Geography segment analysis 2020 - 2024

Historic Market Size - Geography Segment 2020 - 2024 ($ million)

5.6 Country segment analysis 2020 - 2024

Historic Market Size - Country Segment 2020 - 2024 ($ million)

6. Qualitative Analysis

6.1 Impact of AI on Global Military Communication Market

6.2 Impact of Geopolitical Conflict on Global Military Communication Market

7. Five Forces Analysis

7.1 Five forces summary

Five forces analysis - Comparison between 2025 and 2030

7.2 Bargaining power of buyers

Bargaining power of buyers - Impact of key factors 2025 and 2030

7.3 Bargaining power of suppliers

Bargaining power of suppliers - Impact of key factors in 2025 and 2030

7.4 Threat of new entrants

Threat of new entrants - Impact of key factors in 2025 and 2030

7.5 Threat of substitutes

Threat of substitutes - Impact of key factors in 2025 and 2030

7.6 Threat of rivalry

Threat of rivalry - Impact of key factors in 2025 and 2030

7.7 Market condition

Chart on Market condition - Five forces 2025 and 2030

8. Market Segmentation by Component

8.1 Market segments

Chart on Component - Market share 2025-2030 (%)
Data Table on Component - Market share 2025-2030 (%)

8.2 Comparison by Component

Chart on Comparison by Component
Data Table on Comparison by Component

8.3 Hardware - Market size and forecast 2025-2030

Chart on Hardware - Market size and forecast 2025-2030 ($ million)
Data Table on Hardware - Market size and forecast 2025-2030 ($ million)
Chart on Hardware - Year-over-year growth 2025-2030 (%)
Data Table on Hardware - Year-over-year growth 2025-2030 (%)

8.4 Software - Market size and forecast 2025-2030

Chart on Software - Market size and forecast 2025-2030 ($ million)
Data Table on Software - Market size and forecast 2025-2030 ($ million)
Chart on Software - Year-over-year growth 2025-2030 (%)
Data Table on Software - Year-over-year growth 2025-2030 (%)

8.5 Market opportunity by Component

Market opportunity by Component ($ million)
Data Table on Market opportunity by Component ($ million)

9. Market Segmentation by End-user

9.1 Market segments

Chart on End-user - Market share 2025-2030 (%)
Data Table on End-user - Market share 2025-2030 (%)

9.2 Comparison by End-user

Chart on Comparison by End-user
Data Table on Comparison by End-user

9.3 Army - Market size and forecast 2025-2030

Chart on Army - Market size and forecast 2025-2030 ($ million)
Data Table on Army - Market size and forecast 2025-2030 ($ million)
Chart on Army - Year-over-year growth 2025-2030 (%)
Data Table on Army - Year-over-year growth 2025-2030 (%)

9.4 Air Force - Market size and forecast 2025-2030

Chart on Air Force - Market size and forecast 2025-2030 ($ million)
Data Table on Air Force - Market size and forecast 2025-2030 ($ million)
Chart on Air Force - Year-over-year growth 2025-2030 (%)
Data Table on Air Force - Year-over-year growth 2025-2030 (%)

9.5 Navy - Market size and forecast 2025-2030

Chart on Navy - Market size and forecast 2025-2030 ($ million)
Data Table on Navy - Market size and forecast 2025-2030 ($ million)
Chart on Navy - Year-over-year growth 2025-2030 (%)
Data Table on Navy - Year-over-year growth 2025-2030 (%)

9.6 Market opportunity by End-user

Market opportunity by End-user ($ million)
Data Table on Market opportunity by End-user ($ million)

10. Market Segmentation by Type

10.1 Market segments

Chart on Type - Market share 2025-2030 (%)
Data Table on Type - Market share 2025-2030 (%)

10.2 Comparison by Type

Chart on Comparison by Type
Data Table on Comparison by Type

10.3 Ground-based communication - Market size and forecast 2025-2030

Chart on Ground-based communication - Market size and forecast 2025-2030 ($ million)
Data Table on Ground-based communication - Market size and forecast 2025-2030 ($ million)
Chart on Ground-based communication - Year-over-year growth 2025-2030 (%)
Data Table on Ground-based communication - Year-over-year growth 2025-2030 (%)

10.4 Air-ground communication - Market size and forecast 2025-2030

Chart on Air-ground communication - Market size and forecast 2025-2030 ($ million)
Data Table on Air-ground communication - Market size and forecast 2025-2030 ($ million)
Chart on Air-ground communication - Year-over-year growth 2025-2030 (%)
Data Table on Air-ground communication - Year-over-year growth 2025-2030 (%)

10.5 Shipborne communication - Market size and forecast 2025-2030

Chart on Shipborne communication - Market size and forecast 2025-2030 ($ million)
Data Table on Shipborne communication - Market size and forecast 2025-2030 ($ million)
Chart on Shipborne communication - Year-over-year growth 2025-2030 (%)
Data Table on Shipborne communication - Year-over-year growth 2025-2030 (%)

10.6 Underwater communication - Market size and forecast 2025-2030

Chart on Underwater communication - Market size and forecast 2025-2030 ($ million)
Data Table on Underwater communication - Market size and forecast 2025-2030 ($ million)
Chart on Underwater communication - Year-over-year growth 2025-2030 (%)
Data Table on Underwater communication - Year-over-year growth 2025-2030 (%)

10.7 Space-based communication - Market size and forecast 2025-2030

Chart on Space-based communication - Market size and forecast 2025-2030 ($ million)
Data Table on Space-based communication - Market size and forecast 2025-2030 ($ million)
Chart on Space-based communication - Year-over-year growth 2025-2030 (%)
Data Table on Space-based communication - Year-over-year growth 2025-2030 (%)

10.8 Market opportunity by Type

Market opportunity by Type ($ million)
Data Table on Market opportunity by Type ($ million)

11. Customer Landscape

11.1 Customer landscape overview

Analysis of price sensitivity, lifecycle, customer purchase basket, adoption rates, and purchase criteria

12. Geographic Landscape

12.1 Geographic segmentation

Chart on Market share by geography 2025-2030 (%)
Data Table on Market share by geography 2025-2030 (%)

12.2 Geographic comparison

Chart on Geographic comparison
Data Table on Geographic comparison

12.3 North America - Market size and forecast 2025-2030

Chart on North America - Market size and forecast 2025-2030 ($ million)
Data Table on North America - Market size and forecast 2025-2030 ($ million)
Chart on North America - Year-over-year growth 2025-2030 (%)
Data Table on North America - Year-over-year growth 2025-2030 (%)
Chart on Regional Comparison - North America
Data Table on Regional Comparison - North America

12.3.1 US - Market size and forecast 2025-2030

Chart on US - Market size and forecast 2025-2030 ($ million)
Data Table on US - Market size and forecast 2025-2030 ($ million)
Chart on US - Year-over-year growth 2025-2030 (%)
Data Table on US - Year-over-year growth 2025-2030 (%)

12.3.2 Canada - Market size and forecast 2025-2030

Chart on Canada - Market size and forecast 2025-2030 ($ million)
Data Table on Canada - Market size and forecast 2025-2030 ($ million)
Chart on Canada - Year-over-year growth 2025-2030 (%)
Data Table on Canada - Year-over-year growth 2025-2030 (%)

12.3.3 Mexico - Market size and forecast 2025-2030

Chart on Mexico - Market size and forecast 2025-2030 ($ million)
Data Table on Mexico - Market size and forecast 2025-2030 ($ million)
Chart on Mexico - Year-over-year growth 2025-2030 (%)
Data Table on Mexico - Year-over-year growth 2025-2030 (%)

12.4 APAC - Market size and forecast 2025-2030

Chart on APAC - Market size and forecast 2025-2030 ($ million)
Data Table on APAC - Market size and forecast 2025-2030 ($ million)
Chart on APAC - Year-over-year growth 2025-2030 (%)
Data Table on APAC - Year-over-year growth 2025-2030 (%)
Chart on Regional Comparison - APAC
Data Table on Regional Comparison - APAC

12.4.1 China - Market size and forecast 2025-2030

Chart on China - Market size and forecast 2025-2030 ($ million)
Data Table on China - Market size and forecast 2025-2030 ($ million)
Chart on China - Year-over-year growth 2025-2030 (%)
Data Table on China - Year-over-year growth 2025-2030 (%)

12.4.2 Japan - Market size and forecast 2025-2030

Chart on Japan - Market size and forecast 2025-2030 ($ million)
Data Table on Japan - Market size and forecast 2025-2030 ($ million)
Chart on Japan - Year-over-year growth 2025-2030 (%)
Data Table on Japan - Year-over-year growth 2025-2030 (%)

12.4.3 India - Market size and forecast 2025-2030

Chart on India - Market size and forecast 2025-2030 ($ million)
Data Table on India - Market size and forecast 2025-2030 ($ million)
Chart on India - Year-over-year growth 2025-2030 (%)
Data Table on India - Year-over-year growth 2025-2030 (%)

12.4.4 South Korea - Market size and forecast 2025-2030

Chart on South Korea - Market size and forecast 2025-2030 ($ million)
Data Table on South Korea - Market size and forecast 2025-2030 ($ million)
Chart on South Korea - Year-over-year growth 2025-2030 (%)
Data Table on South Korea - Year-over-year growth 2025-2030 (%)

12.4.5 Australia - Market size and forecast 2025-2030

Chart on Australia - Market size and forecast 2025-2030 ($ million)
Data Table on Australia - Market size and forecast 2025-2030 ($ million)
Chart on Australia - Year-over-year growth 2025-2030 (%)
Data Table on Australia - Year-over-year growth 2025-2030 (%)

12.4.6 Indonesia - Market size and forecast 2025-2030

Chart on Indonesia - Market size and forecast 2025-2030 ($ million)
Data Table on Indonesia - Market size and forecast 2025-2030 ($ million)
Chart on Indonesia - Year-over-year growth 2025-2030 (%)
Data Table on Indonesia - Year-over-year growth 2025-2030 (%)

12.5 Europe - Market size and forecast 2025-2030

Chart on Europe - Market size and forecast 2025-2030 ($ million)
Data Table on Europe - Market size and forecast 2025-2030 ($ million)
Chart on Europe - Year-over-year growth 2025-2030 (%)
Data Table on Europe - Year-over-year growth 2025-2030 (%)
Chart on Regional Comparison - Europe
Data Table on Regional Comparison - Europe

12.5.1 Germany - Market size and forecast 2025-2030

Chart on Germany - Market size and forecast 2025-2030 ($ million)
Data Table on Germany - Market size and forecast 2025-2030 ($ million)
Chart on Germany - Year-over-year growth 2025-2030 (%)
Data Table on Germany - Year-over-year growth 2025-2030 (%)

12.5.2 UK - Market size and forecast 2025-2030

Chart on UK - Market size and forecast 2025-2030 ($ million)
Data Table on UK - Market size and forecast 2025-2030 ($ million)
Chart on UK - Year-over-year growth 2025-2030 (%)
Data Table on UK - Year-over-year growth 2025-2030 (%)

12.5.3 France - Market size and forecast 2025-2030

Chart on France - Market size and forecast 2025-2030 ($ million)
Data Table on France - Market size and forecast 2025-2030 ($ million)
Chart on France - Year-over-year growth 2025-2030 (%)
Data Table on France - Year-over-year growth 2025-2030 (%)

12.5.4 Italy - Market size and forecast 2025-2030

Chart on Italy - Market size and forecast 2025-2030 ($ million)
Data Table on Italy - Market size and forecast 2025-2030 ($ million)
Chart on Italy - Year-over-year growth 2025-2030 (%)
Data Table on Italy - Year-over-year growth 2025-2030 (%)

12.5.5 Spain - Market size and forecast 2025-2030

Chart on Spain - Market size and forecast 2025-2030 ($ million)
Data Table on Spain - Market size and forecast 2025-2030 ($ million)
Chart on Spain - Year-over-year growth 2025-2030 (%)
Data Table on Spain - Year-over-year growth 2025-2030 (%)

12.5.6 The Netherlands - Market size and forecast 2025-2030

Chart on The Netherlands - Market size and forecast 2025-2030 ($ million)
Data Table on The Netherlands - Market size and forecast 2025-2030 ($ million)
Chart on The Netherlands - Year-over-year growth 2025-2030 (%)
Data Table on The Netherlands - Year-over-year growth 2025-2030 (%)

12.6 South America - Market size and forecast 2025-2030

Chart on South America - Market size and forecast 2025-2030 ($ million)
Data Table on South America - Market size and forecast 2025-2030 ($ million)
Chart on South America - Year-over-year growth 2025-2030 (%)
Data Table on South America - Year-over-year growth 2025-2030 (%)
Chart on Regional Comparison - South America
Data Table on Regional Comparison - South America

12.6.1 Brazil - Market size and forecast 2025-2030

Chart on Brazil - Market size and forecast 2025-2030 ($ million)
Data Table on Brazil - Market size and forecast 2025-2030 ($ million)
Chart on Brazil - Year-over-year growth 2025-2030 (%)
Data Table on Brazil - Year-over-year growth 2025-2030 (%)

12.6.2 Argentina - Market size and forecast 2025-2030

Chart on Argentina - Market size and forecast 2025-2030 ($ million)
Data Table on Argentina - Market size and forecast 2025-2030 ($ million)
Chart on Argentina - Year-over-year growth 2025-2030 (%)
Data Table on Argentina - Year-over-year growth 2025-2030 (%)

12.6.3 Chile - Market size and forecast 2025-2030

Chart on Chile - Market size and forecast 2025-2030 ($ million)
Data Table on Chile - Market size and forecast 2025-2030 ($ million)
Chart on Chile - Year-over-year growth 2025-2030 (%)
Data Table on Chile - Year-over-year growth 2025-2030 (%)

12.7 Middle East and Africa - Market size and forecast 2025-2030

Chart on Middle East and Africa - Market size and forecast 2025-2030 ($ million)
Data Table on Middle East and Africa - Market size and forecast 2025-2030 ($ million)
Chart on Middle East and Africa - Year-over-year growth 2025-2030 (%)
Data Table on Middle East and Africa - Year-over-year growth 2025-2030 (%)
Chart on Regional Comparison - Middle East and Africa
Data Table on Regional Comparison - Middle East and Africa

12.7.1 Saudi Arabia - Market size and forecast 2025-2030

Chart on Saudi Arabia - Market size and forecast 2025-2030 ($ million)
Data Table on Saudi Arabia - Market size and forecast 2025-2030 ($ million)
Chart on Saudi Arabia - Year-over-year growth 2025-2030 (%)
Data Table on Saudi Arabia - Year-over-year growth 2025-2030 (%)

12.7.2 UAE - Market size and forecast 2025-2030

Chart on UAE - Market size and forecast 2025-2030 ($ million)
Data Table on UAE - Market size and forecast 2025-2030 ($ million)
Chart on UAE - Year-over-year growth 2025-2030 (%)
Data Table on UAE - Year-over-year growth 2025-2030 (%)

12.7.3 South Africa - Market size and forecast 2025-2030

Chart on South Africa - Market size and forecast 2025-2030 ($ million)
Data Table on South Africa - Market size and forecast 2025-2030 ($ million)
Chart on South Africa - Year-over-year growth 2025-2030 (%)
Data Table on South Africa - Year-over-year growth 2025-2030 (%)

12.7.4 Israel - Market size and forecast 2025-2030

Chart on Israel - Market size and forecast 2025-2030 ($ million)
Data Table on Israel - Market size and forecast 2025-2030 ($ million)
Chart on Israel - Year-over-year growth 2025-2030 (%)
Data Table on Israel - Year-over-year growth 2025-2030 (%)

12.7.5 Turkey - Market size and forecast 2025-2030

Chart on Turkey - Market size and forecast 2025-2030 ($ million)
Data Table on Turkey - Market size and forecast 2025-2030 ($ million)
Chart on Turkey - Year-over-year growth 2025-2030 (%)
Data Table on Turkey - Year-over-year growth 2025-2030 (%)

12.8 Market opportunity by geography

Market opportunity by geography ($ million)
Data Tables on Market opportunity by geography ($ million)

13. Drivers, Challenges, and Opportunity

13.1 Market drivers

Modernization of network-centric warfare infrastructure
Expansion of satellite communication and LEO constellations
Rising geopolitical tensions and regional defense expenditures

13.2 Market challenges

Vulnerabilities in cybersecurity and space-based assets
Interoperability bottlenecks in multi-domain and coalition operations
Spectrum congestion and contested electromagnetic environments

13.3 Impact of drivers and challenges

Impact of drivers and challenges in 2025 and 2030

13.4 Market opportunities

Accelerating integration of AI and ML in network management
Shift toward proliferated low-earth orbit satellite constellations
Adoption of modular open systems approaches and interoperability standards

14. Competitive Landscape

14.1 Overview

14.2

Overview on criticality of inputs and factors of differentiation

14.3 Landscape disruption

Overview on factors of disruption

14.4 Industry risks

Impact of key risks on business

15. Competitive Analysis

15.1 Companies profiled

Companies covered

15.2 Company ranking index

15.3 Market positioning of companies

Matrix on companies position and classification

15.4 Airbus SE

Airbus SE - Overview
Airbus SE - Business segments
Airbus SE - Key news
Airbus SE - Key offerings
Airbus SE - Segment focus
SWOT

15.5 ASELSAN AS

ASELSAN AS - Overview
ASELSAN AS - Product / Service
ASELSAN AS - Key offerings
SWOT

15.6 BAE Systems Plc

BAE Systems Plc - Overview
BAE Systems Plc - Business segments
BAE Systems Plc - Key offerings
BAE Systems Plc - Segment focus
SWOT

15.7 Bittium Corp.

Bittium Corp. - Overview
Bittium Corp. - Product / Service
Bittium Corp. - Key offerings
SWOT

15.8 Elbit Systems Ltd.

Elbit Systems Ltd. - Overview
Elbit Systems Ltd. - Business segments
Elbit Systems Ltd. - Key offerings
Elbit Systems Ltd. - Segment focus
SWOT

15.9 General Dynamics Corp.

General Dynamics Corp. - Overview
General Dynamics Corp. - Business segments
General Dynamics Corp. - Key offerings
General Dynamics Corp. - Segment focus
SWOT

15.10 L3Harris Technologies Inc.

L3Harris Technologies Inc. - Overview
L3Harris Technologies Inc. - Business segments
L3Harris Technologies Inc. - Key offerings
L3Harris Technologies Inc. - Segment focus
SWOT

15.11 Leonardo S.p.A.

Leonardo S.p.A. - Overview
Leonardo S.p.A. - Business segments
Leonardo S.p.A. - Key offerings
Leonardo S.p.A. - Segment focus
SWOT

15.12 Lockheed Martin Corp.

Lockheed Martin Corp. - Overview
Lockheed Martin Corp. - Business segments
Lockheed Martin Corp. - Key offerings
Lockheed Martin Corp. - Segment focus
SWOT

15.13 Mercury Systems Inc.

Mercury Systems Inc. - Overview
Mercury Systems Inc. - Product / Service
Mercury Systems Inc. - Key offerings
SWOT

15.14 Nokia Corp.

Nokia Corp. - Overview
Nokia Corp. - Business segments
Nokia Corp. - Key offerings
Nokia Corp. - Segment focus
SWOT

15.15 Northrop Grumman Corp.

Northrop Grumman Corp. - Overview
Northrop Grumman Corp. - Business segments
Northrop Grumman Corp. - Key offerings
Northrop Grumman Corp. - Segment focus
SWOT

15.16 RTX Corp.

RTX Corp. - Overview
RTX Corp. - Business segments
RTX Corp. - Key offerings
RTX Corp. - Segment focus
SWOT

15.17 Thales Group

Thales Group - Overview
Thales Group - Business segments
Thales Group - Key offerings
Thales Group - Segment focus
SWOT

15.18 Viasat Inc.

Viasat Inc. - Overview
Viasat Inc. - Business segments
Viasat Inc. - Key offerings
Viasat Inc. - Segment focus
SWOT

16. Appendix

16.1 Scope of the report

Market definition
Objectives
Notes and caveats

16.2 Inclusions and exclusions checklist

Inclusions checklist
Exclusions checklist

16.3 Currency conversion rates for US$

16.4 Research methodology

16.5 Data procurement

Information sources

16.6 Data validation

16.7 Validation techniques employed for market sizing

16.8 Data synthesis

16.9 360 degree market analysis

16.10 List of abbreviations

Research Methodology

Technavio presents a detailed picture of the market by way of study, synthesis, and summation of data from multiple sources. The analysts have presented the various facets of the market with a particular focus on identifying the key industry influencers. The data thus presented is comprehensive, reliable, and the result of extensive research, both primary and secondary.

INFORMATION SOURCES

Primary sources

  • Manufacturers and suppliers
  • Channel partners
  • Industry experts
  • Strategic decision makers

Secondary sources

  • Industry journals and periodicals
  • Government data
  • Financial reports of key industry players
  • Historical data
  • Press releases

DATA ANALYSIS

Data Synthesis

  • Collation of data
  • Estimation of key figures
  • Analysis of derived insights

Data Validation

  • Triangulation with data models
  • Reference against proprietary databases
  • Corroboration with industry experts

REPORT WRITING

Qualitative

  • Market drivers
  • Market challenges
  • Market trends
  • Five forces analysis

Quantitative

  • Market size and forecast
  • Market segmentation
  • Geographical insights
  • Competitive landscape

Interested in this report?

Get your sample now to see our research methodology and insights!

Download Now

Frequently Asked Questions

Military Communication market growth will increase by USD 10542.5 million during 2026-2030.

The Military Communication market is expected to grow at a CAGR of 5.1% during 2026-2030.

Military Communication market is segmented by Component (Hardware, Software) End-user (Army, Air Force, Navy) Type (Ground-based communication, Air-ground communication, Shipborne communication, Underwater communication, Space-based communication)

Airbus SE, ASELSAN AS, BAE Systems Plc, Bittium Corp., Cobham Ltd., Elbit Systems Ltd., General Dynamics Corp., Iridium Communications Inc., Kymeta Corp., L3Harris Technologies Inc., Leonardo S.p.A., Lockheed Martin Corp., Mercury Systems Inc., Nemco Ltd., Nokia Corp., Northrop Grumman Corp., RTX Corp., Spectra Group UK Ltd., Thales Group, Viasat Inc. are a few of the key vendors in the Military Communication market.

North America will register the highest growth rate of 42.4% among the other regions. Therefore, the Military Communication market in North America is expected to garner significant business opportunities for the vendors during the forecast period.

US, Canada, Mexico, China, Japan, India, South Korea, Australia, Indonesia, Germany, UK, France, Italy, Spain, The Netherlands, Brazil, Argentina, Chile, Saudi Arabia, UAE, South Africa, Israel, Turkey

  • Modernization of network-centric warfare infrastructure is the driving factor this market.

The Military Communication market vendors should focus on grabbing business opportunities from the Component segment as it accounted for the largest market share in the base year.
RIA - Research AI Assistant
Ask RIA